Transcription factor omics
|
|
|
- Prosper Campbell
- 10 years ago
- Views:
Transcription
1 Transcription factor omics Comparative transcriptomics and DNA-protein interactomics disclose novel insights into transcription factor omics. Factor I C A G A G T A G T A G Factor II C A G A G T A G C TFx TFx A A A T T TFx TBP T A A Pol II TFx cis-element cis-element TATA-Box Dierk Wanke [email protected] 1

2 Principle of functional genomics Central Dogma of Molecular Biology DNA RNA Protein Metabolism Central Dogma of functional Genomics Physiology Genome Transcriptome Metabolomics Proteome DNA RNA Protein 2 (modified from Pevsner 2003)

3 Principle of functional genomics Central Dogma of Molecular Biology DNA RNA Protein Metabolism Central Dogma of functional Genomics Physiology Genome Transcriptome Metabolomics Proteome Besides the four classical omes, a number of derived omes exist: with Interactome being probably the most important one! There is high interdependency between the different omes 3

4 Individual history Developmental stage Previous stress Diurnal changes and circadian rhythm Tissue / organ specificity Output interpretation Omics analysis Condition laboratory / environmental setting quantitative OMICS Organism responses Documentation Network analysis Species level responses Genetic engineering Kilian et al. (2011)

5 Quantitative vs qualitative analyses Qualitative Analysis empirical data Yes / No / Maybe Quantitative Analysis mathematical data significance 5

6 Quantitative vs qualitative analyses Acquiring of quantitative data of subcellular processes with high spatiotemporal resolution in living (plant) cells in their native tissue environment Quantitative data Dynamics same direction, but different speed! 6

7 Principle of functional genomics Central Dogma of Molecular Biology DNA RNA Protein Metabolism Central Dogma of functional Genomics Physiology Genome Transcriptome Proteome Metabolomics qualitative data only! invariable given population (basic population) e.g. number of genes, number of bp easy to define a background model relatively easy to analyze f(x) = observed P expected P significance can be analyzed by Hypergeometric p 7
 e.g.")
8 Principle of functional genomics Central Dogma of Molecular Biology DNA RNA Protein Metabolism Central Dogma of functional Genomics Physiology Genome Transcriptome Proteome Metabolomics first real omics mostly qualitative information (e.g. different from control? Yes/No) data is highly variable depending on type experiment / researcher / method of detection a background model can not be defined significance can be inferred but not measured by values 8
 data is highly variable depending on type experiment / researcher / method of detection a background")
9 Principle of functional genomics Central Dogma of Molecular Biology DNA RNA Protein Metabolism Central Dogma of functional Genomics Physiology Genome Transcriptome Proteome Metabolomics qualitative and quantitative readout data is highly variable depending on type experiment / researcher / method of extraction analysis is driven by researcher s objectives due to high variability and data close to detection limit, metabolomes are very hard to analyze by statistics 9

10 Principle of functional genomics Central Dogma of Molecular Biology DNA RNA Protein Metabolism Central Dogma of functional Genomics Physiology Genome Transcriptome Metabolomics Proteome qualitative and quantitative readout data is highly variable depending on type experiment / researcher / method of detection various background models can be defined, which all end up with different results! - Analysis is driven by researcher s objectives various values can be computed to support significance of results 10

11 Principle of functional genomics Central Dogma of Molecular Biology DNA RNA Protein Metabolism Central Dogma of functional Genomics Physiology Genome Transkriptome Proteome Metabolomics Interestingly, due to the quantitative nature of the data types, both methods cope with similar problems e.g.: accession with low abundance, are sometimes below detection limit and have high variability large standard deviation / error bars 11 accession with high abundance, are so frequent that they compete with others or they saturate detection small error bars, due to signal saturation

12 Transcriptome Transcriptome Protein mrna Transcript transcription-start DNA ATG Introns * cis cis TATA cis cis distal proximal Exons Promoter gene sequence Transcriptome: all transcripts at a given time 12 2 current methods in the field: - microarrays - Next Generation Sequencing (NGS)

13 Microarray Transcriptome 13 more than 50 Mio. probe sets on 2 cm x 2 cm

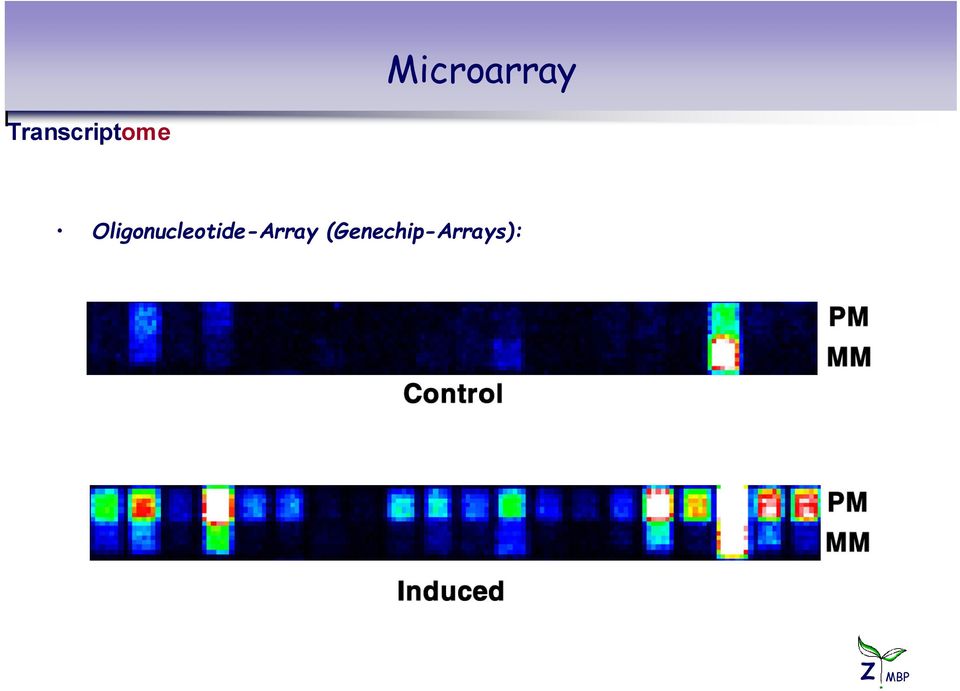
14 Microarray Transcriptome Oligonucleotide-Array (Genechip-Arrays): PerfectMatch (PM) AGATGATAGACAGAGCAGATGCTTG MisMatch (MM) AGATGATAGACAGACCAGATGCTTG PM MM Signal Ratio
")
15 Microarray Transcriptome Oligonucleotide-Array (Genechip-Arrays):
16 Microarray At2g19200 FRK1 (At2g19190) At2g19180 GeneChip Array Exon Array Tiling Array qualitative and quantitative readout BUT only the GeneChip Arrays have internal controls (mismatch probes) Exon- and Tiling Array are not assigned to ONE specific target (similar sequences in the genomes will cross-hybridize and add background) Data between different types of arrays is of low comparability
 Data between different types of arrays is of low")
17 Transcriptome Transcriptome Protein mrna Transcript transcription-start DNA ATG Introns * cis cis TATA cis cis distal proximal Exons Promoter gene sequence Transcriptome: all transcripts at a given time and tissue sample 2 current methods dominate the field: - microarrays - Next Generation Sequencing (NGS) 17

18 Next Generation Sequencing (NGS) Transcriptome
")
19 Next Generation Sequencing (NGS) At2g19200 FRK1 (At2g19190) At2g19180 Genome-Seq no sequence low coverage no informative data talk by Prof. Cole very high sequence no sequence coverage low coverage over-sampling, no informative data satuartion

20 Next Generation Sequencing (NGS) At2g19200 FRK1 (At2g19190) At2g19180 Genome-Seq RNA-Seq expression signal, but there is no annotated gene badly annotated, microrna-gene, differential splicing

21 Next Generation Sequencing (NGS) At2g19200 FRK1 (At2g19190) At2g19180 Genome-Seq low expression signal, (low coverage?) badly annotated, RNA-Seq cryptic intron in gene model, differential splicing
22 Transcriptome: What does ANALYSIS mean? Transcriptome Challenge: Find differentially expressed genes! Mine for meaningful gene sets! - fold difference from control (2x; 3x, 4x...) [simple data with control-treatments only] - LIMMA (Linear Models for Microarray Data) [all data, but linear modeling only] - probabilistic dynamical model - machine-learning approaches
23 Transcriptome: What does ANALYSIS mean? Transcriptome Challenge: Find differentially expressed genes! Mine for meaningful gene sets! Cluster analysis - Pearson correlation - k-means clustering - hierarchical clustering Problem: house-keeping genes!!!
24 Why searching for co-expression Transcriptome Co-expressed genes encode for proteins that act in the same signaling cascades, are enrolled in the same enzymatic pathways or represent interacting partners that form higher order complexes. Additionally, genes with similar expression profiles in microarray experiments might be regulated by the same cis-regulatory elements (CREs).
25 Related to photosynthesis Grundlagen der funktionellen Genomanalyse Related to aging
26 Transcriptome Co-expression reveals logic connections Co expression network reveals protein interaction network Transcriptome vs. Interactome Tanz et al. 2012
27 Transcriptome vs. metabolome Transcriptome Metabolome Combined analysis of transcriptomics and metabolomics in barley research simple Pearson correlation Mangelsen et al. 2010, Plant Phys.
28 sugars and genes exhibit diurnal fluctuations Transcriptome Correlation coefficients Metabolome 10 Fructose Kestose Median normalized (log scale) Glucose Sucrose several genes might act as potential sugar signaling targets
29 Transcriptome: What does ANALYSIS mean? meaningful Transcriptome data microarray next generation sequencing (RNA seq) quantitative data + relatively high comparability + identification of DE genes + co-expression analysis + gene regulatory network analysis - low comparability of data - difficult to identify DE genes - co-expression analysis impossible - no network analysis mainly qualitative data - requires known genome - weak on differential splicing events - weak on ChIP data + applicable to any organism + good on differential splicing events + very good on ChIP data
30 Interactome Chromatin-ImmunoPrecipitation-NGS (ChIP-seq) Identification of in vivo binding sites for DNA binding proteins Immunoprecipitation of specific DNA-protein-complexes with antibodies De-cross-link DNA-protein complexes Ligate adapters to DNA, use as template for sequencing (ChIP-seq)
31 Histone modification regulates expression Interactome transcriptional active [Euchromatin] ON Ac Ac Ac Ac Ac mono-acetylation TrxG PcGs H3K27me3 Me Me Me Ac H3K4me3 tri-methylation Me Me Me Me Me Me Me Me Me Me Me Me Me Me Me transcriptional inactive [Heterochromatin] OFF Histone-modifications are important for gene activation or repression Position of Histones on the DNA can be identified by Chromatin-Immunoprecipitation (ChIP) and subsequent NGS
32 Transcriptome (mrna-seq) + Epigenome (ChIP-Seq) At2g19200 FRK1 (At2g19190) At2g19180 low OFFsignal, high ONsignal high expression, good detection of mrna RNA-Seq (transcriptome) ChIP-Seq (H3K27me 3 ) OFF ChIP-Seq (H3K4me 3 ) ON
33 Transcriptome (mrna-seq) + Epigenome (ChIP-Seq) At2g19200 FRK1 (At2g19190) At2g19180 RNA-Seq (transcriptome) OFFsignal, but still mrna ChIP-Seq (H3K27me 3 ) OFF ChIP-Seq (H3K4me 3 ) ON
34 Research interest: Gene expression control
35 Research interest: Gene expression control mrna TF cis cis TATA distal proximal transcription-start ATG cis Introns * Exons cis Promoter Rapid gene expression response in plant - How are rapid (stress) responses controlled? - How is specificity of this response mediated? laboratory experiments bioinformatics synthetic promoters TF Motif - Interaction - How do TFs find their cis-element? - What is the specificity of this interaction? biotechnology spectro-microscopy 35
36 Transcription factors (TFs) act as molecular switches bzip BAM ARR WRKY BPC GATA 36
37 Research interest: Gene expression control Central Dogma of Molecular Biology DNA RNA Protein Metabolism Central Dogma of functional Genomics Physiology Genome Transkriptome Metabolome Proteome promoter analysis microarray analysis Interactome Protein DNAinteractome 37
38 Genome Is there a cryptic code in non-coding regulatory sequence? transcription-start cis cis TATA ATG cis Introns * cis distal proximal Exons Promoter 400 No. of hits frequency position ATG 38 Berendzen et al., 2006
39 Identification of putative cis-elements by genomic enrichment Genome transcription-start cis cis TATA ATG cis Introns * cis 1600 distal proximal Exons Promoter No. of hits frequency distribution curves for the TATATA motif No. of hits Berendzen et al., 2006
40 Genome Only ~10% of known DNA-binding proteins have a known DNA-binding motif We don t have knowledge on ~90 % of TF-function? What if these behave differently? 2340 ~ % 415 <200 <10 % 40 AGRIS TAIR TRANSFAC Arabidopsis average eukaryote Schröder et al., Plos One 2010
41 Binding specificity of TFs to their DNA motif Interactome DNA-protein interaction ELISA 2 pmol bio dsdna per well epitope tagged protein of interest in crude E. coli extract colorimetric detection DNA-Protein Interaction-ELISA provides quantitative data! 41 Brand et al., 2010
42 Development of a DPI-ELISA screen Interactome Binding site analysis by screening of all 6-mer binding motifs. 42 Brand et al., 2013a Brand et al., 2013b
43 A DPI-ELISA screen with stress responsive WRKY-TFs Interactome WRKY11 DBD Compare different WRKY binding affinities Characterization / identification of binding consensi 43 Brand et al., 2013a Brand et al., 2013b
44 Homology modeling of the WRKY protein at the binding motif Interactome WRKY WRKY WRKY33: One WRKY-protein with 2 WRKY domains! 44 Brand et al., 2013a Brand et al., 2013b
45 Homology modeling of the WRKY protein at the binding motif Interactome linker region variable library region WRKY-protein at the binding motif Homology modeling allows us to built hypotheses about binding of proteins to DNA, as soon as the sequences of both, protein and DNA-motifs are known linker region 45 Brand et al., 2013a Brand et al., 2013b
46 Molecular Dynamics (MD) simulations with WRKY33-domains Interactome weak binder strong binder MD gives an impression about binding strength requires usually complex physical experiments 46 Brand et al., 2013a Brand et al., 2013b
47 A DPI-ELISA screen with stress responsive WRKY-TFs Interactome Very similar WRKY domains have very different binding motifs 47 Brand et al., 2013a Brand et al., 2013b
48 Homology modeling and interactome provide functional clues Interactome affinity high low WRKY50 DBD hngach WRKY33 cdbd nngacw WRKY11 DBD ydgacy WRKY proteins recognize (slightly) different binding consensi Different binding consensi are bound with different affinities Quantitative binding information can be translated into a probability matrix to search genomic information for possible binding sites 48 Brand et al., 2013a Brand et al., 2013b
49 Microarray Transcriptome Oligonucleotide-Array (Genechip-Arrays): ATH1-Genechip: probe cells (79% of all A. thaliana genes) >24000 genes (85%) can be detected due to the high redundanzcy in the genome unique probe sets about (~60%) genes hybridize with probes to generate analyzable data We made use of the 1295 AtGenExpress Expression Profiles + ~1500 additional datasets for co-expression analyses
50 Transcriptome Homology modeling and interactome provide functional clues Which genes are co-expressed with WRKY genes AND have the respective binding site in their promoter?
51 Co-expression analysis in complex Microarray datasets Transcriptome Search for WRKYs as hubs ~ genes; analyzed in ~3000 microarray hybridizations Wanke et al., QBIC 2010
52 Genome analysis combined with transcriptome analysis Genome Transcriptome mrna transcription-start WRKY cis cis TATA distal proximal ATG cis Introns * Exons cis Promoter Identify binding sites in promoters Identify WRKY-co-expressed genes
53 Genome analysis combined with transcriptome analysis Genome - Transcriptome affinity high WRKY50 DBD WRKY33 cdbd WRKY11 DBD hngach nngacw ydgacy low No. co-expressed genes: ~300 ~400 ~400 No. binding sites: ~8000 ~ 5000 ~ 3000 No. put. targets ~250 ~60 ~40 We used publicly available microarray data on WRKY33 to verify our data.
54 Genome analysis combined with transcriptome analysis Transcriptome 100 mock stress stress normalized signal intensity (log scale) activator repressor control AtWRKY33 Integration of metadata from the Somssich Lab (Birkenbihl et al., 2012)
55 NGS coupled genomics: In vivo target gene identification by chromatin immuno-precipitation Genome Sequencing by NGS 100 Isolation of bound DNA normalized signal intensity (log scale) activator All ~60 putative target genes were independently identified as true in vivo targets! repressor AtWRKY33 Integration of metadata from the Somssich Lab (Birkenbihl et al., 2012)
56 What is the function of the putative target genes! Genome - Transcriptome affinity high WRKY50 DBD WRKY33 cdbd WRKY11 DBD hngach nngacw ydgacy low cell cycle chromatin remodeling pathogen response basal resistance No. put. targets ~250 ~60 ~40
57 What is the function of plant specific BBR/BPC factors? 0.05 changes Os10g Os10g HvBBR GmGAGA-BP AtBPC2 AtBPC1 AtBPC3 AtBPC7 AtBPC4 AtBPC5 AtBPC6 Os06g Ceratopteris richardii Group I Group II Physcomitrella patens BBR/BPCs arose evolutionary late in the green plant lineage Bind to GAGA-motifs and recruit LHP1 to DNA Wanke et al., 2011; Santi et al., 2003
58 Transcriptome Microarray vs. NGS Mutants in transcription factor genes exhibit differences in development Control lhp1-4 bpc4 bpc6 lhp1-4 bpc4 bpc6
59 Microarray vs. NGS Transcriptome Strong defects in flowers and seed production! Control lhp1-4 bpc4 bpc6 lhp1-4 bpc4 bpc6 Transcriptome (microarray) analysis to understand what is wrong!
60 Microarray vs. NGS microarrays provide the potential to compare the data with already existing microarrays (intercomparability)
61 Microarray vs. NGS more induced genes in the mutants function as repressor proteins repression coincides with already known repressive H3K27me3 marks
62 Microarray vs. NGS identical RNA used in both experiments two replicates libraries paired end reads ~ 80 Mio analyzable reads from each library microarray NGS Verify the data by Transcriptome (NGS) analysis!
63 Microarray vs. NGS microarray NGS Both methods provide Transcriptome data, but which is correct?
64 Microarray vs. NGS Genome - Interactome two replicate libraries from BPC6-expressing plants single end reads ~ 50 Mio analyzable reads each Isolation of target DNA Sequencing by NGS Interactome (ChIP-seq) analysis to identify direct target genes! We identified 350 putative in vivo target genes!
65 Microarray vs. NGS microarray NGS 33 putative direct targets overlapped with microarray expression 47 putative direct targets overlapped with NGS expression only a total of 8 were picked up with both techniques
66 Next Generation Sequencing (NGS) Transcriptome GLOBAL vs. LOCAL NGS is a quantitative approach, but reveals mostly (high value) qualitative data Quantitative analyses on a Global scale are informative, while specific local questions provide qualitative data only or remain hidden. Unfortunately, NGS for transcriptomics is often useless (to date) local expression analysis is difficult co-expression analysis is almost impossible Chromatin-ImmunoPrecipitation-NGS (ChIP-seq) data is highly informative, but mainly of qualitative nature!
67 Transcription factor omics Quantitative omics data can be normalized and, thus, is comparable. Quantitative data from different sources can be used directly in a simultaneous combined analysis (e.g. transcriptomics and metabolomics) NGS data harbors great potential, but (at present) can not substitute quantitative gene expression data e.g. in co-expression analyses Novel methods, such as the DPI-ELISA, enable quantitative proteomics The combined analysis of quantitative transcriptome and interactome data provide unique insights into protein function
68 What does ANALYSIS mean - personally? Challenge: Mine for meaningful data Problem: Conflicting interests bioinformatics biologists significant output is not interested in a special gene or outcome (unbiased) independent of funding biologically relevant output is ONLY interested in his special gene(s) of interest (biased) important for funding
69 Thank you! Tübingen Andreas Hecker Sachie Kimura Rebecca Dautel Joachim Kilian Luise Brand Saarland Nathalie Sebening Christine Zehren Angelika Anna Dagmar Pogomara Jan Hirsch MPI Tübingen Markus Schmid Silvio Collani Uni Rostock Birgit Piechulla Katrin Wenke INRA Versailles Valerie Gaudin ETH Zürich Sam Zeeman Sebastian Soyk Uni Würzburg Wolfgang Dröge Laser Christoph Weiste
How many of you have checked out the web site on protein-dna interactions?
 How many of you have checked out the web site on protein-dna interactions? Example of an approximately 40,000 probe spotted oligo microarray with enlarged inset to show detail. Find and be ready to discuss
Current Motif Discovery Tools and their Limitations
 Current Motif Discovery Tools and their Limitations Philipp Bucher SIB / CIG Workshop 3 October 2006 Trendy Concepts and Hypotheses Transcription regulatory elements act in a context-dependent manner.
New Technologies for Sensitive, Low-Input RNA-Seq. Clontech Laboratories, Inc.
 New Technologies for Sensitive, Low-Input RNA-Seq Clontech Laboratories, Inc. Outline Introduction Single-Cell-Capable mrna-seq Using SMART Technology SMARTer Ultra Low RNA Kit for the Fluidigm C 1 System
Analysis of gene expression data. Ulf Leser and Philippe Thomas
 Analysis of gene expression data Ulf Leser and Philippe Thomas This Lecture Protein synthesis Microarray Idea Technologies Applications Problems Quality control Normalization Analysis next week! Ulf Leser:
BBSRC TECHNOLOGY STRATEGY: TECHNOLOGIES NEEDED BY RESEARCH KNOWLEDGE PROVIDERS
 BBSRC TECHNOLOGY STRATEGY: TECHNOLOGIES NEEDED BY RESEARCH KNOWLEDGE PROVIDERS 1. The Technology Strategy sets out six areas where technological developments are required to push the frontiers of knowledge
BIOINF 525 Winter 2016 Foundations of Bioinformatics and Systems Biology http://tinyurl.com/bioinf525-w16
 Course Director: Dr. Barry Grant (DCM&B, [email protected]) Description: This is a three module course covering (1) Foundations of Bioinformatics, (2) Statistics in Bioinformatics, and (3) Systems
Analysis and Integration of Big Data from Next-Generation Genomics, Epigenomics, and Transcriptomics
 Analysis and Integration of Big Data from Next-Generation Genomics, Epigenomics, and Transcriptomics Christopher Benner, PhD Director, Integrative Genomics and Bioinformatics Core (IGC) idash Webinar,
How To Understand How Gene Expression Is Regulated
 What makes cells different from each other? How do cells respond to information from environment? Regulation of: - Transcription - prokaryotes - eukaryotes - mrna splicing - mrna localisation and translation
Interaktionen von Nukleinsäuren und Proteinen
 Sonja Prohaska Computational EvoDevo Universitaet Leipzig June 9, 2015 DNA is never naked in a cell DNA is usually in association with proteins. In all domains of life there are small, basic chromosomal
A Primer of Genome Science THIRD
 A Primer of Genome Science THIRD EDITION GREG GIBSON-SPENCER V. MUSE North Carolina State University Sinauer Associates, Inc. Publishers Sunderland, Massachusetts USA Contents Preface xi 1 Genome Projects:
Faculty of Medicine. Settore disciplinare: BIO/10. functional domains. Monica Soldi. IFOM-IEO Campus, Milan. Matricola n. R08407
 PhD degree in Molecular Medicine European School of Molecular Medicine (SEMM), University of Milan and University of Naples Federico II Faculty of Medicine Settore disciplinare: BIO/10 Establishment and
GENE REGULATION. Teacher Packet
 AP * BIOLOGY GENE REGULATION Teacher Packet AP* is a trademark of the College Entrance Examination Board. The College Entrance Examination Board was not involved in the production of this material. Pictures
Discovery and Quantification of RNA with RNASeq Roderic Guigó Serra Centre de Regulació Genòmica (CRG) [email protected]
 roderic.guigo@crg.cat") Bioinformatique et Séquençage Haut Débit, Discovery and Quantification of RNA with RNASeq Roderic Guigó Serra Centre de Regulació Genòmica (CRG) [email protected] 1 RNA Transcription to RNA and subsequent
Bioinformatique et Séquençage Haut Débit, Discovery and Quantification of RNA with RNASeq Roderic Guigó Serra Centre de Regulació Genòmica (CRG) [email protected] 1 RNA Transcription to RNA and subsequent
Core Facility Genomics
 Core Facility Genomics versatile genome or transcriptome analyses based on quantifiable highthroughput data ascertainment 1 Topics Collaboration with Harald Binder and Clemens Kreutz Project: Microarray
Lecture 1 MODULE 3 GENE EXPRESSION AND REGULATION OF GENE EXPRESSION. Professor Bharat Patel Office: Science 2, 2.36 Email: [email protected].
 Lecture 1 MODULE 3 GENE EXPRESSION AND REGULATION OF GENE EXPRESSION Professor Bharat Patel Office: Science 2, 2.36 Email: [email protected] What is Gene Expression & Gene Regulation? 1. Gene Expression
Just the Facts: A Basic Introduction to the Science Underlying NCBI Resources
 1 of 8 11/7/2004 11:00 AM National Center for Biotechnology Information About NCBI NCBI at a Glance A Science Primer Human Genome Resources Model Organisms Guide Outreach and Education Databases and Tools
BIO 3352: BIOINFORMATICS II HYBRID COURSE SYLLABUS
 BIO 3352: BIOINFORMATICS II HYBRID COURSE SYLLABUS NEW YORK CITY COLLEGE OF TECHNOLOGY The City University Of New York School of Arts and Sciences Biological Sciences Department Course title: Bioinformatics
Next Generation Sequencing
 Next Generation Sequencing Technology and applications 10/1/2015 Jeroen Van Houdt - Genomics Core - KU Leuven - UZ Leuven 1 Landmarks in DNA sequencing 1953 Discovery of DNA double helix structure 1977
Control of Gene Expression
 Control of Gene Expression What is Gene Expression? Gene expression is the process by which informa9on from a gene is used in the synthesis of a func9onal gene product. What is Gene Expression? Figure
GMQL Functional Comparison with BEDTools and BEDOPS
 GMQL Functional Comparison with BEDTools and BEDOPS Genomic Computing Group Dipartimento di Elettronica, Informazione e Bioingegneria Politecnico di Milano This document presents a functional comparison
Control of Gene Expression
 Home Gene Regulation Is Necessary? Control of Gene Expression By switching genes off when they are not needed, cells can prevent resources from being wasted. There should be natural selection favoring
AGILENT S BIOINFORMATICS ANALYSIS SOFTWARE
 ACCELERATING PROGRESS IS IN OUR GENES AGILENT S BIOINFORMATICS ANALYSIS SOFTWARE GENESPRING GENE EXPRESSION (GX) MASS PROFILER PROFESSIONAL (MPP) PATHWAY ARCHITECT (PA) See Deeper. Reach Further. BIOINFORMATICS
Correlation of microarray and quantitative real-time PCR results. Elisa Wurmbach Mount Sinai School of Medicine New York
 Correlation of microarray and quantitative real-time PCR results Elisa Wurmbach Mount Sinai School of Medicine New York Microarray techniques Oligo-array: Affymetrix, Codelink, spotted oligo-arrays (60-70mers)
Gene Expression Analysis
 Gene Expression Analysis Jie Peng Department of Statistics University of California, Davis May 2012 RNA expression technologies High-throughput technologies to measure the expression levels of thousands
Systematic discovery of regulatory motifs in human promoters and 30 UTRs by comparison of several mammals
 Systematic discovery of regulatory motifs in human promoters and 30 UTRs by comparison of several mammals Xiaohui Xie 1, Jun Lu 1, E. J. Kulbokas 1, Todd R. Golub 1, Vamsi Mootha 1, Kerstin Lindblad-Toh
The world of non-coding RNA. Espen Enerly
 The world of non-coding RNA Espen Enerly ncrna in general Different groups Small RNAs Outline mirnas and sirnas Speculations Common for all ncrna Per def.: never translated Not spurious transcripts Always/often
Shouguo Gao Ph. D Department of Physics and Comprehensive Diabetes Center
 Computational Challenges in Storage, Analysis and Interpretation of Next-Generation Sequencing Data Shouguo Gao Ph. D Department of Physics and Comprehensive Diabetes Center Next Generation Sequencing
Qualitative Simulation and Model Checking in Genetic Regulatory Networks
 An Application of Model Checking to a realistic biological problem: Qualitative Simulation and Model Checking in Genetic Regulatory Networks A presentation of Formal Methods in Biology Justin Hogg [email protected]
RETRIEVING SEQUENCE INFORMATION. Nucleotide sequence databases. Database search. Sequence alignment and comparison
 RETRIEVING SEQUENCE INFORMATION Nucleotide sequence databases Database search Sequence alignment and comparison Biological sequence databases Originally just a storage place for sequences. Currently the
Gene Models & Bed format: What they represent.
 GeneModels&Bedformat:Whattheyrepresent. Gene models are hypotheses about the structure of transcripts produced by a gene. Like all models, they may be correct, partly correct, or entirely wrong. Typically,
Complex multicellular organisms are produced by cells that switch genes on and off during development.
 Home Control of Gene Expression Gene Regulation Is Necessary? By switching genes off when they are not needed, cells can prevent resources from being wasted. There should be natural selection favoring
Interaktionen von RNAs und Proteinen
 Sonja Prohaska Computational EvoDevo Universitaet Leipzig June 9, 2015 Studying RNA-protein interactions Given: target protein known to bind to RNA problem: find binding partners and binding sites experimental
Plant Growth & Development. Growth Stages. Differences in the Developmental Mechanisms of Plants and Animals. Development
 Plant Growth & Development Plant body is unable to move. To survive and grow, plants must be able to alter its growth, development and physiology. Plants are able to produce complex, yet variable forms
Appendix 2 Molecular Biology Core Curriculum. Websites and Other Resources
 Appendix 2 Molecular Biology Core Curriculum Websites and Other Resources Chapter 1 - The Molecular Basis of Cancer 1. Inside Cancer http://www.insidecancer.org/ From the Dolan DNA Learning Center Cold
Molecular Genetics: Challenges for Statistical Practice. J.K. Lindsey
 Molecular Genetics: Challenges for Statistical Practice J.K. Lindsey 1. What is a Microarray? 2. Design Questions 3. Modelling Questions 4. Longitudinal Data 5. Conclusions 1. What is a microarray? A microarray
Frequently Asked Questions Next Generation Sequencing
 Frequently Asked Questions Next Generation Sequencing Import These Frequently Asked Questions for Next Generation Sequencing are some of the more common questions our customers ask. Questions are divided
Data Integration. Lectures 16 & 17. ECS289A, WQ03, Filkov
 Data Integration Lectures 16 & 17 Lectures Outline Goals for Data Integration Homogeneous data integration time series data (Filkov et al. 2002) Heterogeneous data integration microarray + sequence microarray
Core Bioinformatics. Degree Type Year Semester. 4313473 Bioinformàtica/Bioinformatics OB 0 1
 Core Bioinformatics 2014/2015 Code: 42397 ECTS Credits: 12 Degree Type Year Semester 4313473 Bioinformàtica/Bioinformatics OB 0 1 Contact Name: Sònia Casillas Viladerrams Email: [email protected]
13.4 Gene Regulation and Expression
 13.4 Gene Regulation and Expression Lesson Objectives Describe gene regulation in prokaryotes. Explain how most eukaryotic genes are regulated. Relate gene regulation to development in multicellular organisms.
Introduction to Genome Annotation
 Introduction to Genome Annotation AGCGTGGTAGCGCGAGTTTGCGAGCTAGCTAGGCTCCGGATGCGA CCAGCTTTGATAGATGAATATAGTGTGCGCGACTAGCTGTGTGTT GAATATATAGTGTGTCTCTCGATATGTAGTCTGGATCTAGTGTTG GTGTAGATGGAGATCGCGTAGCGTGGTAGCGCGAGTTTGCGAGCT
Standards, Guidelines and Best Practices for RNA-Seq V1.0 (June 2011) The ENCODE Consortium
 The ENCODE Consortium") Standards, Guidelines and Best Practices for RNA-Seq V1.0 (June 2011) The ENCODE Consortium I. Introduction: Sequence based assays of transcriptomes (RNA-seq) are in wide use because of their favorable
Standards, Guidelines and Best Practices for RNA-Seq V1.0 (June 2011) The ENCODE Consortium I. Introduction: Sequence based assays of transcriptomes (RNA-seq) are in wide use because of their favorable
Quality Assessment of Exon and Gene Arrays
 Quality Assessment of Exon and Gene Arrays I. Introduction In this white paper we describe some quality assessment procedures that are computed from CEL files from Whole Transcript (WT) based arrays such
Genetomic Promototypes
 Genetomic Promototypes Mirkó Palla and Dana Pe er Department of Mechanical Engineering Clarkson University Potsdam, New York and Department of Genetics Harvard Medical School 77 Avenue Louis Pasteur Boston,
Quantitative proteomics background
 Proteomics data analysis seminar Quantitative proteomics and transcriptomics of anaerobic and aerobic yeast cultures reveals post transcriptional regulation of key cellular processes de Groot, M., Daran
FlipFlop: Fast Lasso-based Isoform Prediction as a Flow Problem
 FlipFlop: Fast Lasso-based Isoform Prediction as a Flow Problem Elsa Bernard Laurent Jacob Julien Mairal Jean-Philippe Vert September 24, 2013 Abstract FlipFlop implements a fast method for de novo transcript
A Brief Introduction on DNase-Seq Data Aanalysis
 A Brief Introduction on DNase-Seq Data Aanalysis Hashem Koohy, Thomas Down, Mikhail Spivakov and Tim Hubbard Spivakov s and Fraser s Lab September 13, 2014 1 Introduction DNaseI is an enzyme which cuts
Dr Alexander Henzing
 Horizon 2020 Health, Demographic Change & Wellbeing EU funding, research and collaboration opportunities for 2016/17 Innovate UK funding opportunities in omics, bridging health and life sciences Dr Alexander
Module 3 Questions. 7. Chemotaxis is an example of signal transduction. Explain, with the use of diagrams.
 Module 3 Questions Section 1. Essay and Short Answers. Use diagrams wherever possible 1. With the use of a diagram, provide an overview of the general regulation strategies available to a bacterial cell.
Feed Forward Loops in Biological Systems
 Feed Forward Loops in Biological Systems Dr. M. Vijayalakshmi School of Chemical and Biotechnology SASTRA University Joint Initiative of IITs and IISc Funded by MHRD Page 1 of 7 Table of Contents 1 INTRODUCTION...
School of Nursing. Presented by Yvette Conley, PhD
 Presented by Yvette Conley, PhD What we will cover during this webcast: Briefly discuss the approaches introduced in the paper: Genome Sequencing Genome Wide Association Studies Epigenomics Gene Expression
Expression Quantification (I)
") Expression Quantification (I) Mario Fasold, LIFE, IZBI Sequencing Technology One Illumina HiSeq 2000 run produces 2 times (paired-end) ca. 1,2 Billion reads ca. 120 GB FASTQ file RNA-seq protocol Task
Expression Quantification (I) Mario Fasold, LIFE, IZBI Sequencing Technology One Illumina HiSeq 2000 run produces 2 times (paired-end) ca. 1,2 Billion reads ca. 120 GB FASTQ file RNA-seq protocol Task
Comparing Methods for Identifying Transcription Factor Target Genes
 Comparing Methods for Identifying Transcription Factor Target Genes Alena van Bömmel (R 3.3.73) Matthew Huska (R 3.3.18) Max Planck Institute for Molecular Genetics Folie 1 Transcriptional Regulation TF
Control of Gene Expression
 Control of Gene Expression (Learning Objectives) Explain the role of gene expression is differentiation of function of cells which leads to the emergence of different tissues, organs, and organ systems
Genetic information (DNA) determines structure of proteins DNA RNA proteins cell structure 3.11 3.15 enzymes control cell chemistry ( metabolism )
 determines structure of proteins DNA RNA proteins cell structure 3.11 3.15 enzymes control cell chemistry ( metabolism )") Biology 1406 Exam 3 Notes Structure of DNA Ch. 10 Genetic information (DNA) determines structure of proteins DNA RNA proteins cell structure 3.11 3.15 enzymes control cell chemistry ( metabolism ) Proteins
Biology 1406 Exam 3 Notes Structure of DNA Ch. 10 Genetic information (DNA) determines structure of proteins DNA RNA proteins cell structure 3.11 3.15 enzymes control cell chemistry ( metabolism ) Proteins
Software and Methods for the Analysis of Affymetrix GeneChip Data. Rafael A Irizarry Department of Biostatistics Johns Hopkins University
 Software and Methods for the Analysis of Affymetrix GeneChip Data Rafael A Irizarry Department of Biostatistics Johns Hopkins University Outline Overview Bioconductor Project Examples 1: Gene Annotation
Chapter 18 Regulation of Gene Expression
 Chapter 18 Regulation of Gene Expression 18.1. Gene Regulation Is Necessary By switching genes off when they are not needed, cells can prevent resources from being wasted. There should be natural selection
Next Generation Sequencing: Technology, Mapping, and Analysis
 Next Generation Sequencing: Technology, Mapping, and Analysis Gary Benson Computer Science, Biology, Bioinformatics Boston University [email protected] http://tandem.bu.edu/ The Human Genome Project took
Protein Protein Interaction Networks
 Functional Pattern Mining from Genome Scale Protein Protein Interaction Networks Young-Rae Cho, Ph.D. Assistant Professor Department of Computer Science Baylor University it My Definition of Bioinformatics
Row Quantile Normalisation of Microarrays
 Row Quantile Normalisation of Microarrays W. B. Langdon Departments of Mathematical Sciences and Biological Sciences University of Essex, CO4 3SQ Technical Report CES-484 ISSN: 1744-8050 23 June 2008 Abstract
Introduction to transcriptome analysis using High Throughput Sequencing technologies (HTS)
") Introduction to transcriptome analysis using High Throughput Sequencing technologies (HTS) A typical RNA Seq experiment Library construction Protocol variations Fragmentation methods RNA: nebulization,
Introduction to transcriptome analysis using High Throughput Sequencing technologies (HTS) A typical RNA Seq experiment Library construction Protocol variations Fragmentation methods RNA: nebulization,
Twincore - Zentrum für Experimentelle und Klinische Infektionsforschung Institut für Molekulare Bakteriologie
 Twincore - Zentrum für Experimentelle und Klinische Infektionsforschung Institut für Molekulare Bakteriologie 0 HELMHOLTZ I ZENTRUM FÜR INFEKTIONSFORSCHUNG Technische Universität Braunschweig Institut
Gene Regulation -- The Lac Operon
 Gene Regulation -- The Lac Operon Specific proteins are present in different tissues and some appear only at certain times during development. All cells of a higher organism have the full set of genes:
Web-Based Genomic Information Integration with Gene Ontology
 Web-Based Genomic Information Integration with Gene Ontology Kai Xu 1 IMAGEN group, National ICT Australia, Sydney, Australia, [email protected] Abstract. Despite the dramatic growth of online genomic
Basic Analysis of Microarray Data
 Basic Analysis of Microarray Data A User Guide and Tutorial Scott A. Ness, Ph.D. Co-Director, Keck-UNM Genomics Resource and Dept. of Molecular Genetics and Microbiology University of New Mexico HSC Tel.
FACULTY OF MEDICAL SCIENCE
 Doctor of Philosophy in Biochemistry FACULTY OF MEDICAL SCIENCE Naresuan University 73 Doctor of Philosophy in Biochemistry The Biochemistry Department at Naresuan University is a leader in lower northern
GeneProf and the new GeneProf Web Services
 GeneProf and the new GeneProf Web Services Florian Halbritter [email protected] Stem Cell Bioinformatics Group (Simon R. Tomlinson) [email protected] December 10, 2012 Florian Halbritter
Understanding West Nile Virus Infection
 Understanding West Nile Virus Infection The QIAGEN Bioinformatics Solution: Biomedical Genomics Workbench (BXWB) + Ingenuity Pathway Analysis (IPA) Functional Genomics & Predictive Medicine, May 21-22,
University of Glasgow - Programme Structure Summary C1G5-5100 MSc Bioinformatics, Polyomics and Systems Biology
 University of Glasgow - Programme Structure Summary C1G5-5100 MSc Bioinformatics, Polyomics and Systems Biology Programme Structure - the MSc outcome will require 180 credits total (full-time only) - 60
Next Generation Sequencing: Adjusting to Big Data. Daniel Nicorici, Dr.Tech. Statistikot Suomen Lääketeollisuudessa 29.10.2013
 Next Generation Sequencing: Adjusting to Big Data Daniel Nicorici, Dr.Tech. Statistikot Suomen Lääketeollisuudessa 29.10.2013 Outline Human Genome Project Next-Generation Sequencing Personalized Medicine
T cell Epitope Prediction
 Institute for Immunology and Informatics T cell Epitope Prediction EpiMatrix Eric Gustafson January 6, 2011 Overview Gathering raw data Popular sources Data Management Conservation Analysis Multiple Alignments
Introduction To Epigenetic Regulation: How Can The Epigenomics Core Services Help Your Research? Maria (Ken) Figueroa, M.D. Core Scientific Director
 Figueroa, M.D. Core Scientific Director") Introduction To Epigenetic Regulation: How Can The Epigenomics Core Services Help Your Research? Maria (Ken) Figueroa, M.D. Core Scientific Director Gene expression depends upon multiple factors Gene Transcription
Introduction To Epigenetic Regulation: How Can The Epigenomics Core Services Help Your Research? Maria (Ken) Figueroa, M.D. Core Scientific Director Gene expression depends upon multiple factors Gene Transcription
Challenges associated with analysis and storage of NGS data
 Challenges associated with analysis and storage of NGS data Gabriella Rustici Research and training coordinator Functional Genomics Group [email protected] Next-generation sequencing Next-generation sequencing
Final Project Report
 CPSC545 by Introduction to Data Mining Prof. Martin Schultz & Prof. Mark Gerstein Student Name: Yu Kor Hugo Lam Student ID : 904907866 Due Date : May 7, 2007 Introduction Final Project Report Pseudogenes
Plant Metabolomics. For BOT 6516
 Plant Metabolomics For BOT 6516 Introduction Modern metabolomics began about ten years ago and yet many continue to question the relative performance of this area of technology in advancing plant biology.
PreciseTM Whitepaper
 Precise TM Whitepaper Introduction LIMITATIONS OF EXISTING RNA-SEQ METHODS Correctly designed gene expression studies require large numbers of samples, accurate results and low analysis costs. Analysis
AP BIOLOGY 2009 SCORING GUIDELINES
 AP BIOLOGY 2009 SCORING GUIDELINES Question 4 The flow of genetic information from DNA to protein in eukaryotic cells is called the central dogma of biology. (a) Explain the role of each of the following
Algorithms in Computational Biology (236522) spring 2007 Lecture #1
 spring 2007 Lecture #1") Algorithms in Computational Biology (236522) spring 2007 Lecture #1 Lecturer: Shlomo Moran, Taub 639, tel 4363 Office hours: Tuesday 11:00-12:00/by appointment TA: Ilan Gronau, Taub 700, tel 4894 Office
Algorithms in Computational Biology (236522) spring 2007 Lecture #1 Lecturer: Shlomo Moran, Taub 639, tel 4363 Office hours: Tuesday 11:00-12:00/by appointment TA: Ilan Gronau, Taub 700, tel 4894 Office
Integrating DNA Motif Discovery and Genome-Wide Expression Analysis. Erin M. Conlon
 Integrating DNA Motif Discovery and Genome-Wide Expression Analysis Department of Mathematics and Statistics University of Massachusetts Amherst Statistics in Functional Genomics Workshop Ascona, Switzerland
PrimePCR Assay Validation Report
 Gene Information Gene Name sorbin and SH3 domain containing 2 Gene Symbol Organism Gene Summary Gene Aliases RefSeq Accession No. UniGene ID Ensembl Gene ID SORBS2 Human Arg and c-abl represent the mammalian
MORPHEUS. http://biodev.cea.fr/morpheus/ Prediction of Transcription Factors Binding Sites based on Position Weight Matrix.
 MORPHEUS http://biodev.cea.fr/morpheus/ Prediction of Transcription Factors Binding Sites based on Position Weight Matrix. Reference: MORPHEUS, a Webtool for Transcripton Factor Binding Analysis Using
Gene expression analysis. Ulf Leser and Karin Zimmermann
 Gene expression analysis Ulf Leser and Karin Zimmermann Ulf Leser: Bioinformatics, Wintersemester 2010/2011 1 Last lecture What are microarrays? - Biomolecular devices measuring the transcriptome of a
Lecture 11 Data storage and LIMS solutions. Stéphane LE CROM [email protected]
 Lecture 11 Data storage and LIMS solutions Stéphane LE CROM [email protected] Various steps of a DNA microarray experiment Experimental steps Data analysis Experimental design set up Chips on catalog
Go where the biology takes you. Genome Analyzer IIx Genome Analyzer IIe
 Go where the biology takes you. Genome Analyzer IIx Genome Analyzer IIe Go where the biology takes you. To published results faster With proven scalability To the forefront of discovery To limitless applications
Computational Genomics. Next generation sequencing (NGS)
") Computational Genomics Next generation sequencing (NGS) Sequencing technology defies Moore s law Nature Methods 2011 Log 10 (price) Sequencing the Human Genome 2001: Human Genome Project 2.7G$, 11 years
Computational Genomics Next generation sequencing (NGS) Sequencing technology defies Moore s law Nature Methods 2011 Log 10 (price) Sequencing the Human Genome 2001: Human Genome Project 2.7G$, 11 years
Analyzing microrna Data and Integrating mirna with Gene Expression Data in Partek Genomics Suite 6.6
 Analyzing microrna Data and Integrating mirna with Gene Expression Data in Partek Genomics Suite 6.6 Overview This tutorial outlines how microrna data can be analyzed within Partek Genomics Suite. Additionally,
Overview of Eukaryotic Gene Prediction
 Overview of Eukaryotic Gene Prediction CBB 231 / COMPSCI 261 W.H. Majoros What is DNA? Nucleus Chromosome Telomere Centromere Cell Telomere base pairs histones DNA (double helix) DNA is a Double Helix
PrimePCR Assay Validation Report
 Gene Information Gene Name Gene Symbol Organism Gene Summary Gene Aliases RefSeq Accession No. UniGene ID Ensembl Gene ID papillary renal cell carcinoma (translocation-associated) PRCC Human This gene
Name Class Date. Figure 13 1. 2. Which nucleotide in Figure 13 1 indicates the nucleic acid above is RNA? a. uracil c. cytosine b. guanine d.
 13 Multiple Choice RNA and Protein Synthesis Chapter Test A Write the letter that best answers the question or completes the statement on the line provided. 1. Which of the following are found in both
Understanding the dynamics and function of cellular networks
 Understanding the dynamics and function of cellular networks Cells are complex systems functionally diverse elements diverse interactions that form networks signal transduction-, gene regulatory-, metabolic-