ANALYSIS OF TREND CHAPTER 5
|
|
|
- Ernest Howard
- 9 years ago
- Views:
Transcription
1 ANALYSIS OF TREND CHAPTER 5 ERSH 8310 Lecture 7 September 13, 2007

2 Today s Class Analysis of trends Using contrasts to do something a bit more practical. Linear trends. Quadratic trends. Trends in SPSS.

3 Today s Example Data Training Times

4 Yet Another Experiment From p. 89: Consider an experiment designed to test the proposition that subjects learn better when training is distributed or spaced over a period of time than when the training is massed all at once. We could investigate this question with just two groups, one group that receives massed training and another that receives training at spaced intervals. However, this study would allow only a restricted glimpse of the phenomenon. Instead we could conduct a more comprehensive study that included conditions with several different spacings. It would provide information about the form of the relationship between learning and the degree of distributed training, giving a much clearer picture of the spacing phenomenon.

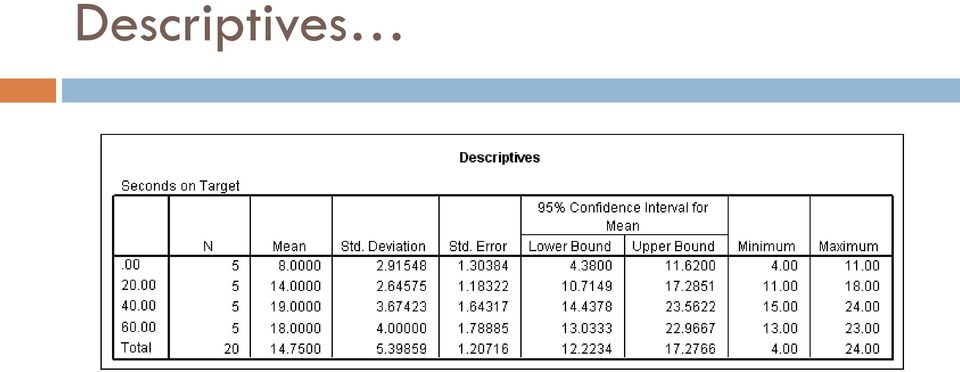
5 The Task P. 89, continued The subject s task is to track a spot moving in a random path around a computer screen, using a control stick to position a circle over it. Each subject has 10 one-minute practice trials learning how to track the spot. The independent variable is the time between practice trials: For one group the trials immediately follow another (0 seconds spacing the massed condition); for a second group there is a 20- second pause between trials, for a third group there is a 40-second pause; and for the fourth group there is a 60-second pause. Twenty minutes after the last practice trial, each subject is given a 30- second test trial, and the dependent variable is the number of seconds that the subject is able to keep on the target. Suppose n=5 subjects are randomly assigned to the four groups. [The scores are given in the table on the next slide.]

6 Analysis of Linear Trend

7 Trend Analysis Trend analysis is a specialized form of single-df comparisons when a quantitative independent variable is manipulated. The treatment levels represent different amount of a single common variable (e.g., the number of hours of food deprivation, different dosage levels of particular drug, rates of stimulus presentation, and the intensity of the unconditional stimulus in a conditioning experiment). We usually plot the entire set of treatment means on a graph, connect the points, and examine the display for any underling shape or trend.

8 A Numerical Example Assume the following experiment: Subjects are given some material to learn with the independent variable, the trial interval of 0, 20, 40, and 60 seconds (i.e., a = 4). The dependent variable is the number of seconds that the subject is able to keep on the target (i.e., tracking score). Suppose that an = 20 and the hypothetical results are presented in Table 5.1.
.")
9 Tracking Task Bringing You To Our Data

10 The Data Intertrial Interval (A) 0 seconds 20 seconds 40 seconds 60 seconds a 1 a 2 a 3 a

11 Testing for Linear Trend A way of assessing linear trend is to use a set of coefficients that represents an idealized version of a straight line (see Appendix A.3 on p. 577). Note that there are a-1 number of the orthogonal polynomials. For our example, this would be: c 1 c 2 c 3 c


12 Example in SPSS Run the ANOVA: Analyze Compare Means One-Way ANOVA


13 Example in SPSS Click on the Contrasts button Be sure the checkbox by polynomial is checked. Select linear in the degree listbox.

14 Descriptives

15 Means Plot (Is There A Trend?)
")
16 The Single-df Linear Trend Test The single-df comparison for the testing of linear trend is performed with:


17 We Can Formulate Our Contrast

18 Contrast Test of Hypothesis We can test the hypothesis: H 0: Ψ = 0 This is the p-value for the contrast hypothesis test

19 Contrast Coefficients The c 1j are the linear coefficients in Appendix A.3 (e.g., -3, -1, 1, 3, for a = 4) and df num = 1 and df denom = a(n-1). The four means can be plotted and a straight line can also be drawn. The straight line (i.e., the linear function) does not fit the data perfectly.
 does not fit the data perfectly.")
20 Plotting the Regression Line We may express the linear relationship using the liner regression equation,

21 Evaluating the Linear Fit It can be determined if the linear function provides a complete summary of the relationship between X and Y. The test is:
22 Analysis of Quadratic Trend
23 Analysis of Quadratic Trend A quadratic trend is one that displays concavity, a single bend either upward or downward. The coefficients of orthogonal polynomials in Appendix A.3 can be used to test quadratic trend. The testing of quadratic trend can be accomplished by the formulae on the next slide.

24 Our Example Quadratic contrast coefficients: c 1 c 2 c 3 c
25 Testing Quadratic Trend with df num = 1 and df denom = a(n-1).

26 In SPSS
27 SPSS Output Is our quadratic trend contrast significant?
28 Evaluating the Quadratic Fit The residual variation remaining beyond the linear and quadratic components can be evaluated with F failure. The quadratic regression equation can be constructed, similarly to the linear regression equation: Use a multiple regression program to obtain the regression coefficients.
29 Higher-Order Trend Components Testing for Higher-Order Trends: A curve that has two reversals is called a cubic trend component, and one that has three reversals is called a quartic trend component. The higher-order trend can be tested with the coefficients in Appendix A.3. For example, we may calculate the cubic trend for a = 4.
30 Planning a Trend Analysis
31 Issues in Trend Analysis There are two questions that surround the choice of intervals, namely, the nature of the spacing between adjacent levels and the number of intervals. It is better to use equally spaced intervals. Trend Coefficients for Unequal Intervals: The coefficients can be found by simply picking numbers that agree with the actual spacing and adjust them to sum to zero. The Number of Intervals: Seriously consider investing in a substantial experiment that includes a sufficient number of treatment conditions to provide convincing evidence of the trends.
32 Other Issues Other Functional Forms Other functions (e.g., exponential or logarithm) can be used. Monotonic Trend Analysis When we have only predicted the rank order of the conditions, we have a monotonic hypothesis based on a monotonic function. We may apply the logic behind the trend coefficients in Appendix A.3 appropriately modified for a given problem.
33 Final Thought Trend analysis takes the idea of contrasts and maps it onto looking at trends. Trend analysis is typically conducted when the factor levels have some understandable scale. Contrasts are specific hypothesis tests that examine how each mean may differ from all the other means.
34 Next Class Chapter 6: Pairwise Comparisons
Unit 31 A Hypothesis Test about Correlation and Slope in a Simple Linear Regression
 Unit 31 A Hypothesis Test about Correlation and Slope in a Simple Linear Regression Objectives: To perform a hypothesis test concerning the slope of a least squares line To recognize that testing for a
SPSS Guide: Regression Analysis
 SPSS Guide: Regression Analysis I put this together to give you a step-by-step guide for replicating what we did in the computer lab. It should help you run the tests we covered. The best way to get familiar
Chapter 10. Key Ideas Correlation, Correlation Coefficient (r),
,") Chapter 0 Key Ideas Correlation, Correlation Coefficient (r), Section 0-: Overview We have already explored the basics of describing single variable data sets. However, when two quantitative variables
Chapter 0 Key Ideas Correlation, Correlation Coefficient (r), Section 0-: Overview We have already explored the basics of describing single variable data sets. However, when two quantitative variables
3.3. Solving Polynomial Equations. Introduction. Prerequisites. Learning Outcomes
 Solving Polynomial Equations 3.3 Introduction Linear and quadratic equations, dealt within Sections 3.1 and 3.2, are members of a class of equations, called polynomial equations. These have the general
Simple linear regression
 Simple linear regression Introduction Simple linear regression is a statistical method for obtaining a formula to predict values of one variable from another where there is a causal relationship between
Multiple Linear Regression
 Multiple Linear Regression A regression with two or more explanatory variables is called a multiple regression. Rather than modeling the mean response as a straight line, as in simple regression, it is
POLYNOMIAL AND MULTIPLE REGRESSION. Polynomial regression used to fit nonlinear (e.g. curvilinear) data into a least squares linear regression model.
 data into a least squares linear regression model.") Polynomial Regression POLYNOMIAL AND MULTIPLE REGRESSION Polynomial regression used to fit nonlinear (e.g. curvilinear) data into a least squares linear regression model. It is a form of linear regression
Polynomial Regression POLYNOMIAL AND MULTIPLE REGRESSION Polynomial regression used to fit nonlinear (e.g. curvilinear) data into a least squares linear regression model. It is a form of linear regression
Mixed 2 x 3 ANOVA. Notes
 Mixed 2 x 3 ANOVA This section explains how to perform an ANOVA when one of the variables takes the form of repeated measures and the other variable is between-subjects that is, independent groups of participants
NCSS Statistical Software Principal Components Regression. In ordinary least squares, the regression coefficients are estimated using the formula ( )
") Chapter 340 Principal Components Regression Introduction is a technique for analyzing multiple regression data that suffer from multicollinearity. When multicollinearity occurs, least squares estimates
Chapter 340 Principal Components Regression Introduction is a technique for analyzing multiple regression data that suffer from multicollinearity. When multicollinearity occurs, least squares estimates
Chapter 13 Introduction to Linear Regression and Correlation Analysis
 Chapter 3 Student Lecture Notes 3- Chapter 3 Introduction to Linear Regression and Correlation Analsis Fall 2006 Fundamentals of Business Statistics Chapter Goals To understand the methods for displaing
Regression III: Advanced Methods
 Lecture 16: Generalized Additive Models Regression III: Advanced Methods Bill Jacoby Michigan State University http://polisci.msu.edu/jacoby/icpsr/regress3 Goals of the Lecture Introduce Additive Models
INTERPRETING THE ONE-WAY ANALYSIS OF VARIANCE (ANOVA)
") INTERPRETING THE ONE-WAY ANALYSIS OF VARIANCE (ANOVA) As with other parametric statistics, we begin the one-way ANOVA with a test of the underlying assumptions. Our first assumption is the assumption of
INTERPRETING THE ONE-WAY ANALYSIS OF VARIANCE (ANOVA) As with other parametric statistics, we begin the one-way ANOVA with a test of the underlying assumptions. Our first assumption is the assumption of
Doing Multiple Regression with SPSS. In this case, we are interested in the Analyze options so we choose that menu. If gives us a number of choices:
 Doing Multiple Regression with SPSS Multiple Regression for Data Already in Data Editor Next we want to specify a multiple regression analysis for these data. The menu bar for SPSS offers several options:
One-Way ANOVA using SPSS 11.0. SPSS ANOVA procedures found in the Compare Means analyses. Specifically, we demonstrate
 1 One-Way ANOVA using SPSS 11.0 This section covers steps for testing the difference between three or more group means using the SPSS ANOVA procedures found in the Compare Means analyses. Specifically,
Using R for Linear Regression
 Using R for Linear Regression In the following handout words and symbols in bold are R functions and words and symbols in italics are entries supplied by the user; underlined words and symbols are optional
Lesson 1: Comparison of Population Means Part c: Comparison of Two- Means
 Lesson : Comparison of Population Means Part c: Comparison of Two- Means Welcome to lesson c. This third lesson of lesson will discuss hypothesis testing for two independent means. Steps in Hypothesis
ORTHOGONAL POLYNOMIAL CONTRASTS INDIVIDUAL DF COMPARISONS: EQUALLY SPACED TREATMENTS
 ORTHOGONAL POLYNOMIAL CONTRASTS INDIVIDUAL DF COMPARISONS: EQUALLY SPACED TREATMENTS Many treatments are equally spaced (incremented). This provides us with the opportunity to look at the response curve
Interaction between quantitative predictors
 Interaction between quantitative predictors In a first-order model like the ones we have discussed, the association between E(y) and a predictor x j does not depend on the value of the other predictors
Regression Analysis: A Complete Example
 Regression Analysis: A Complete Example This section works out an example that includes all the topics we have discussed so far in this chapter. A complete example of regression analysis. PhotoDisc, Inc./Getty
CALCULATIONS & STATISTICS
 CALCULATIONS & STATISTICS CALCULATION OF SCORES Conversion of 1-5 scale to 0-100 scores When you look at your report, you will notice that the scores are reported on a 0-100 scale, even though respondents
1.5 Oneway Analysis of Variance
 Statistics: Rosie Cornish. 200. 1.5 Oneway Analysis of Variance 1 Introduction Oneway analysis of variance (ANOVA) is used to compare several means. This method is often used in scientific or medical experiments
Review of Fundamental Mathematics
 Review of Fundamental Mathematics As explained in the Preface and in Chapter 1 of your textbook, managerial economics applies microeconomic theory to business decision making. The decision-making tools
Premaster Statistics Tutorial 4 Full solutions
 Premaster Statistics Tutorial 4 Full solutions Regression analysis Q1 (based on Doane & Seward, 4/E, 12.7) a. Interpret the slope of the fitted regression = 125,000 + 150. b. What is the prediction for
Demand Forecasting When a product is produced for a market, the demand occurs in the future. The production planning cannot be accomplished unless
 Demand Forecasting When a product is produced for a market, the demand occurs in the future. The production planning cannot be accomplished unless the volume of the demand known. The success of the business
KSTAT MINI-MANUAL. Decision Sciences 434 Kellogg Graduate School of Management
 KSTAT MINI-MANUAL Decision Sciences 434 Kellogg Graduate School of Management Kstat is a set of macros added to Excel and it will enable you to do the statistics required for this course very easily. To
Straightening Data in a Scatterplot Selecting a Good Re-Expression Model
 Straightening Data in a Scatterplot Selecting a Good Re-Expression What Is All This Stuff? Here s what is included: Page 3: Graphs of the three main patterns of data points that the student is likely to
The Bullet-Block Mystery
 LivePhoto IVV Physics Activity 1 Name: Date: 1. Introduction The Bullet-Block Mystery Suppose a vertically mounted 22 Gauge rifle fires a bullet upwards into a block of wood (shown in Fig. 1a). If the
Section 14 Simple Linear Regression: Introduction to Least Squares Regression
 Slide 1 Section 14 Simple Linear Regression: Introduction to Least Squares Regression There are several different measures of statistical association used for understanding the quantitative relationship
Non-Inferiority Tests for Two Means using Differences
 Chapter 450 on-inferiority Tests for Two Means using Differences Introduction This procedure computes power and sample size for non-inferiority tests in two-sample designs in which the outcome is a continuous
ABSORBENCY OF PAPER TOWELS
 ABSORBENCY OF PAPER TOWELS 15. Brief Version of the Case Study 15.1 Problem Formulation 15.2 Selection of Factors 15.3 Obtaining Random Samples of Paper Towels 15.4 How will the Absorbency be measured?
Chapter 5 Analysis of variance SPSS Analysis of variance
 Chapter 5 Analysis of variance SPSS Analysis of variance Data file used: gss.sav How to get there: Analyze Compare Means One-way ANOVA To test the null hypothesis that several population means are equal,
Zeros of Polynomial Functions
 Review: Synthetic Division Find (x 2-5x - 5x 3 + x 4 ) (5 + x). Factor Theorem Solve 2x 3-5x 2 + x + 2 =0 given that 2 is a zero of f(x) = 2x 3-5x 2 + x + 2. Zeros of Polynomial Functions Introduction
A Primer on Forecasting Business Performance
 A Primer on Forecasting Business Performance There are two common approaches to forecasting: qualitative and quantitative. Qualitative forecasting methods are important when historical data is not available.
Absorbance Spectrophotometry: Analysis of FD&C Red Food Dye #40 Calibration Curve Procedure
 Absorbance Spectrophotometry: Analysis of FD&C Red Food Dye #40 Calibration Curve Procedure Note: there is a second document that goes with this one! 2046 - Absorbance Spectrophotometry. Make sure you
X X X a) perfect linear correlation b) no correlation c) positive correlation (r = 1) (r = 0) (0 < r < 1)
 perfect linear correlation b) no correlation c) positive correlation (r = 1) (r = 0) (0 < r < 1)") CORRELATION AND REGRESSION / 47 CHAPTER EIGHT CORRELATION AND REGRESSION Correlation and regression are statistical methods that are commonly used in the medical literature to compare two or more variables.
CORRELATION AND REGRESSION / 47 CHAPTER EIGHT CORRELATION AND REGRESSION Correlation and regression are statistical methods that are commonly used in the medical literature to compare two or more variables.
expression is written horizontally. The Last terms ((2)( 4)) because they are the last terms of the two polynomials. This is called the FOIL method.
( 4)) because they are the last terms of the two polynomials. This is called the FOIL method.") A polynomial of degree n (in one variable, with real coefficients) is an expression of the form: a n x n + a n 1 x n 1 + a n 2 x n 2 + + a 2 x 2 + a 1 x + a 0 where a n, a n 1, a n 2, a 2, a 1, a 0 are
A polynomial of degree n (in one variable, with real coefficients) is an expression of the form: a n x n + a n 1 x n 1 + a n 2 x n 2 + + a 2 x 2 + a 1 x + a 0 where a n, a n 1, a n 2, a 2, a 1, a 0 are
Plot and Solve Equations
 Plot and Solve Equations With SigmaPlot s equation plotter and solver, you can - plot curves of data from user-defined equations - evaluate equations for data points, and solve them for a data range. You
Prentice Hall Mathematics: Algebra 2 2007 Correlated to: Utah Core Curriculum for Math, Intermediate Algebra (Secondary)
") Core Standards of the Course Standard 1 Students will acquire number sense and perform operations with real and complex numbers. Objective 1.1 Compute fluently and make reasonable estimates. 1. Simplify
Core Standards of the Course Standard 1 Students will acquire number sense and perform operations with real and complex numbers. Objective 1.1 Compute fluently and make reasonable estimates. 1. Simplify
Introduction to General and Generalized Linear Models
 Introduction to General and Generalized Linear Models General Linear Models - part I Henrik Madsen Poul Thyregod Informatics and Mathematical Modelling Technical University of Denmark DK-2800 Kgs. Lyngby
We extended the additive model in two variables to the interaction model by adding a third term to the equation.
 Quadratic Models We extended the additive model in two variables to the interaction model by adding a third term to the equation. Similarly, we can extend the linear model in one variable to the quadratic
Multiple Regression in SPSS This example shows you how to perform multiple regression. The basic command is regression : linear.
 Multiple Regression in SPSS This example shows you how to perform multiple regression. The basic command is regression : linear. In the main dialog box, input the dependent variable and several predictors.
Year 9 set 1 Mathematics notes, to accompany the 9H book.
 Part 1: Year 9 set 1 Mathematics notes, to accompany the 9H book. equations 1. (p.1), 1.6 (p. 44), 4.6 (p.196) sequences 3. (p.115) Pupils use the Elmwood Press Essential Maths book by David Raymer (9H
Main Effects and Interactions
 Main Effects & Interactions page 1 Main Effects and Interactions So far, we ve talked about studies in which there is just one independent variable, such as violence of television program. You might randomly
CHAPTER 13 SIMPLE LINEAR REGRESSION. Opening Example. Simple Regression. Linear Regression
 Opening Example CHAPTER 13 SIMPLE LINEAR REGREION SIMPLE LINEAR REGREION! Simple Regression! Linear Regression Simple Regression Definition A regression model is a mathematical equation that descries the
SPSS Tests for Versions 9 to 13
 SPSS Tests for Versions 9 to 13 Chapter 2 Descriptive Statistic (including median) Choose Analyze Descriptive statistics Frequencies... Click on variable(s) then press to move to into Variable(s): list
QUANTITATIVE METHODS BIOLOGY FINAL HONOUR SCHOOL NON-PARAMETRIC TESTS
 QUANTITATIVE METHODS BIOLOGY FINAL HONOUR SCHOOL NON-PARAMETRIC TESTS This booklet contains lecture notes for the nonparametric work in the QM course. This booklet may be online at http://users.ox.ac.uk/~grafen/qmnotes/index.html.
This chapter will demonstrate how to perform multiple linear regression with IBM SPSS
 CHAPTER 7B Multiple Regression: Statistical Methods Using IBM SPSS This chapter will demonstrate how to perform multiple linear regression with IBM SPSS first using the standard method and then using the
2.5 Zeros of a Polynomial Functions
 .5 Zeros of a Polynomial Functions Section.5 Notes Page 1 The first rule we will talk about is Descartes Rule of Signs, which can be used to determine the possible times a graph crosses the x-axis and
Directions for using SPSS
 Directions for using SPSS Table of Contents Connecting and Working with Files 1. Accessing SPSS... 2 2. Transferring Files to N:\drive or your computer... 3 3. Importing Data from Another File Format...
Simple Predictive Analytics Curtis Seare
 Using Excel to Solve Business Problems: Simple Predictive Analytics Curtis Seare Copyright: Vault Analytics July 2010 Contents Section I: Background Information Why use Predictive Analytics? How to use
Simple Methods and Procedures Used in Forecasting
 Simple Methods and Procedures Used in Forecasting The project prepared by : Sven Gingelmaier Michael Richter Under direction of the Maria Jadamus-Hacura What Is Forecasting? Prediction of future events
is the degree of the polynomial and is the leading coefficient.
 Property: T. Hrubik-Vulanovic e-mail: [email protected] Content (in order sections were covered from the book): Chapter 6 Higher-Degree Polynomial Functions... 1 Section 6.1 Higher-Degree Polynomial Functions...
Lecture 11: Chapter 5, Section 3 Relationships between Two Quantitative Variables; Correlation
 Lecture 11: Chapter 5, Section 3 Relationships between Two Quantitative Variables; Correlation Display and Summarize Correlation for Direction and Strength Properties of Correlation Regression Line Cengage
T-test & factor analysis
 Parametric tests T-test & factor analysis Better than non parametric tests Stringent assumptions More strings attached Assumes population distribution of sample is normal Major problem Alternatives Continue
2. What is the general linear model to be used to model linear trend? (Write out the model) = + + + or
 = + + + or") Simple and Multiple Regression Analysis Example: Explore the relationships among Month, Adv.$ and Sales $: 1. Prepare a scatter plot of these data. The scatter plots for Adv.$ versus Sales, and Month versus
Simple and Multiple Regression Analysis Example: Explore the relationships among Month, Adv.$ and Sales $: 1. Prepare a scatter plot of these data. The scatter plots for Adv.$ versus Sales, and Month versus
Chapter 3 RANDOM VARIATE GENERATION
 Chapter 3 RANDOM VARIATE GENERATION In order to do a Monte Carlo simulation either by hand or by computer, techniques must be developed for generating values of random variables having known distributions.
Research Methods & Experimental Design
 Research Methods & Experimental Design 16.422 Human Supervisory Control April 2004 Research Methods Qualitative vs. quantitative Understanding the relationship between objectives (research question) and
SCHOOL OF HEALTH AND HUMAN SCIENCES DON T FORGET TO RECODE YOUR MISSING VALUES
 SCHOOL OF HEALTH AND HUMAN SCIENCES Using SPSS Topics addressed today: 1. Differences between groups 2. Graphing Use the s4data.sav file for the first part of this session. DON T FORGET TO RECODE YOUR
Confidence Intervals for the Difference Between Two Means
 Chapter 47 Confidence Intervals for the Difference Between Two Means Introduction This procedure calculates the sample size necessary to achieve a specified distance from the difference in sample means
The KaleidaGraph Guide to Curve Fitting
 The KaleidaGraph Guide to Curve Fitting Contents Chapter 1 Curve Fitting Overview 1.1 Purpose of Curve Fitting... 5 1.2 Types of Curve Fits... 5 Least Squares Curve Fits... 5 Nonlinear Curve Fits... 6
Normality Testing in Excel
 Normality Testing in Excel By Mark Harmon Copyright 2011 Mark Harmon No part of this publication may be reproduced or distributed without the express permission of the author. [email protected]
Microeconomic Theory: Basic Math Concepts
 Microeconomic Theory: Basic Math Concepts Matt Van Essen University of Alabama Van Essen (U of A) Basic Math Concepts 1 / 66 Basic Math Concepts In this lecture we will review some basic mathematical concepts
Module 6: Introduction to Time Series Forecasting
 Using Statistical Data to Make Decisions Module 6: Introduction to Time Series Forecasting Titus Awokuse and Tom Ilvento, University of Delaware, College of Agriculture and Natural Resources, Food and
Fairfield Public Schools
 Mathematics Fairfield Public Schools AP Statistics AP Statistics BOE Approved 04/08/2014 1 AP STATISTICS Critical Areas of Focus AP Statistics is a rigorous course that offers advanced students an opportunity
Week 1: Functions and Equations
 Week 1: Functions and Equations Goals: Review functions Introduce modeling using linear and quadratic functions Solving equations and systems Suggested Textbook Readings: Chapter 2: 2.1-2.2, and Chapter
6 EXTENDING ALGEBRA. 6.0 Introduction. 6.1 The cubic equation. Objectives
 6 EXTENDING ALGEBRA Chapter 6 Extending Algebra Objectives After studying this chapter you should understand techniques whereby equations of cubic degree and higher can be solved; be able to factorise
Data Analysis Tools. Tools for Summarizing Data
 Data Analysis Tools This section of the notes is meant to introduce you to many of the tools that are provided by Excel under the Tools/Data Analysis menu item. If your computer does not have that tool
MATH BOOK OF PROBLEMS SERIES. New from Pearson Custom Publishing!
 MATH BOOK OF PROBLEMS SERIES New from Pearson Custom Publishing! The Math Book of Problems Series is a database of math problems for the following courses: Pre-algebra Algebra Pre-calculus Calculus Statistics
8. Time Series and Prediction
 8. Time Series and Prediction Definition: A time series is given by a sequence of the values of a variable observed at sequential points in time. e.g. daily maximum temperature, end of day share prices,
Multiple Regression. Page 24
 Multiple Regression Multiple regression is an extension of simple (bi-variate) regression. The goal of multiple regression is to enable a researcher to assess the relationship between a dependent (predicted)
Regression and Correlation
 Regression and Correlation Topics Covered: Dependent and independent variables. Scatter diagram. Correlation coefficient. Linear Regression line. by Dr.I.Namestnikova 1 Introduction Regression analysis
Introduction to Quantitative Methods
 Introduction to Quantitative Methods October 15, 2009 Contents 1 Definition of Key Terms 2 2 Descriptive Statistics 3 2.1 Frequency Tables......................... 4 2.2 Measures of Central Tendencies.................
Week TSX Index 1 8480 2 8470 3 8475 4 8510 5 8500 6 8480
 1) The S & P/TSX Composite Index is based on common stock prices of a group of Canadian stocks. The weekly close level of the TSX for 6 weeks are shown: Week TSX Index 1 8480 2 8470 3 8475 4 8510 5 8500
SAS Software to Fit the Generalized Linear Model
 SAS Software to Fit the Generalized Linear Model Gordon Johnston, SAS Institute Inc., Cary, NC Abstract In recent years, the class of generalized linear models has gained popularity as a statistical modeling
QUADRATIC, EXPONENTIAL AND LOGARITHMIC FUNCTIONS
 QUADRATIC, EXPONENTIAL AND LOGARITHMIC FUNCTIONS Content 1. Parabolas... 1 1.1. Top of a parabola... 2 1.2. Orientation of a parabola... 2 1.3. Intercept of a parabola... 3 1.4. Roots (or zeros) of a parabola...
UNDERSTANDING THE TWO-WAY ANOVA
 UNDERSTANDING THE e have seen how the one-way ANOVA can be used to compare two or more sample means in studies involving a single independent variable. This can be extended to two independent variables
Precalculus REVERSE CORRELATION. Content Expectations for. Precalculus. Michigan CONTENT EXPECTATIONS FOR PRECALCULUS CHAPTER/LESSON TITLES
 Content Expectations for Precalculus Michigan Precalculus 2011 REVERSE CORRELATION CHAPTER/LESSON TITLES Chapter 0 Preparing for Precalculus 0-1 Sets There are no state-mandated Precalculus 0-2 Operations
Curve Fitting, Loglog Plots, and Semilog Plots 1
 Curve Fitting, Loglog Plots, and Semilog Plots 1 In this MATLAB exercise, you will learn how to plot data and how to fit lines to your data. Suppose you are measuring the height h of a seedling as it grows.
Example: Boats and Manatees
 Figure 9-6 Example: Boats and Manatees Slide 1 Given the sample data in Table 9-1, find the value of the linear correlation coefficient r, then refer to Table A-6 to determine whether there is a significant
11. Analysis of Case-control Studies Logistic Regression
 Research methods II 113 11. Analysis of Case-control Studies Logistic Regression This chapter builds upon and further develops the concepts and strategies described in Ch.6 of Mother and Child Health:
BookTOC.txt. 1. Functions, Graphs, and Models. Algebra Toolbox. Sets. The Real Numbers. Inequalities and Intervals on the Real Number Line
 College Algebra in Context with Applications for the Managerial, Life, and Social Sciences, 3rd Edition Ronald J. Harshbarger, University of South Carolina - Beaufort Lisa S. Yocco, Georgia Southern University
Simple Tricks for Using SPSS for Windows
 Simple Tricks for Using SPSS for Windows Chapter 14. Follow-up Tests for the Two-Way Factorial ANOVA The Interaction is Not Significant If you have performed a two-way ANOVA using the General Linear Model,
UNDERSTANDING ANALYSIS OF COVARIANCE (ANCOVA)
") UNDERSTANDING ANALYSIS OF COVARIANCE () In general, research is conducted for the purpose of explaining the effects of the independent variable on the dependent variable, and the purpose of research design
UNDERSTANDING ANALYSIS OF COVARIANCE () In general, research is conducted for the purpose of explaining the effects of the independent variable on the dependent variable, and the purpose of research design
Algebra II New Summit School High School Diploma Program
 Syllabus Course Description: Algebra II is a two semester course. Students completing this course will earn 1.0 unit upon completion. Required Materials: 1. Student Text Glencoe Algebra 2: Integration,
Chapter 27 Using Predictor Variables. Chapter Table of Contents
 Chapter 27 Using Predictor Variables Chapter Table of Contents LINEAR TREND...1329 TIME TREND CURVES...1330 REGRESSORS...1332 ADJUSTMENTS...1334 DYNAMIC REGRESSOR...1335 INTERVENTIONS...1339 TheInterventionSpecificationWindow...1339
6.1 Add & Subtract Polynomial Expression & Functions
 6.1 Add & Subtract Polynomial Expression & Functions Objectives 1. Know the meaning of the words term, monomial, binomial, trinomial, polynomial, degree, coefficient, like terms, polynomial funciton, quardrtic
Lagrange Interpolation is a method of fitting an equation to a set of points that functions well when there are few points given.
 Polynomials (Ch.1) Study Guide by BS, JL, AZ, CC, SH, HL Lagrange Interpolation is a method of fitting an equation to a set of points that functions well when there are few points given. Sasha s method
Indiana State Core Curriculum Standards updated 2009 Algebra I
 Indiana State Core Curriculum Standards updated 2009 Algebra I Strand Description Boardworks High School Algebra presentations Operations With Real Numbers Linear Equations and A1.1 Students simplify and
DATA INTERPRETATION AND STATISTICS
 PholC60 September 001 DATA INTERPRETATION AND STATISTICS Books A easy and systematic introductory text is Essentials of Medical Statistics by Betty Kirkwood, published by Blackwell at about 14. DESCRIPTIVE
Answer: C. The strength of a correlation does not change if units change by a linear transformation such as: Fahrenheit = 32 + (5/9) * Centigrade
 * Centigrade") Statistics Quiz Correlation and Regression -- ANSWERS 1. Temperature and air pollution are known to be correlated. We collect data from two laboratories, in Boston and Montreal. Boston makes their measurements
Statistics Quiz Correlation and Regression -- ANSWERS 1. Temperature and air pollution are known to be correlated. We collect data from two laboratories, in Boston and Montreal. Boston makes their measurements
SPSS Explore procedure
 SPSS Explore procedure One useful function in SPSS is the Explore procedure, which will produce histograms, boxplots, stem-and-leaf plots and extensive descriptive statistics. To run the Explore procedure,
Moderation. Moderation
 Stats - Moderation Moderation A moderator is a variable that specifies conditions under which a given predictor is related to an outcome. The moderator explains when a DV and IV are related. Moderation
Pearson's Correlation Tests
 Chapter 800 Pearson's Correlation Tests Introduction The correlation coefficient, ρ (rho), is a popular statistic for describing the strength of the relationship between two variables. The correlation
Algebra 1 Course Title
 Algebra 1 Course Title Course- wide 1. What patterns and methods are being used? Course- wide 1. Students will be adept at solving and graphing linear and quadratic equations 2. Students will be adept
2. Simple Linear Regression
 Research methods - II 3 2. Simple Linear Regression Simple linear regression is a technique in parametric statistics that is commonly used for analyzing mean response of a variable Y which changes according
Bill Burton Albert Einstein College of Medicine [email protected] April 28, 2014 EERS: Managing the Tension Between Rigor and Resources 1
 Bill Burton Albert Einstein College of Medicine [email protected] April 28, 2014 EERS: Managing the Tension Between Rigor and Resources 1 Calculate counts, means, and standard deviations Produce
Chapter 23. Inferences for Regression
 Chapter 23. Inferences for Regression Topics covered in this chapter: Simple Linear Regression Simple Linear Regression Example 23.1: Crying and IQ The Problem: Infants who cry easily may be more easily