Regression and Correlation
|
|
|
- Gabriel Stevenson
- 8 years ago
- Views:
Transcription
1 Regression and Correlation Topics Covered: Dependent and independent variables. Scatter diagram. Correlation coefficient. Linear Regression line. by Dr.I.Namestnikova 1

2 Introduction Regression analysis is used to model and analyse numerical data consisting of values of an independent variable X (the variable that we fix or choose deliberately) and dependent variable Y. The main purpose of finding a relationship is that the knowledge of the relationship may enable events to be predicted and perhaps controlled. Correlation coefficient To measure the strength of the linear relationship between X and Y the sample correlation coefficient r is used. r = S xy Sxx S xy, S xy = n xy x y, S xx = n ( ) 2, x 2 x Syy = n ( ) 2 y 2 y Where x and y observed values of variables X and Y respectively. Important notes 1. If the calculatedr value is positive then the slope will rise from left to right on the graph. If the calculated value ofr is negative the slope will fall from left to right. 2. The r value will always lie between 1 and +1. If you have an r value outside of this range you have made an error in the calculations. 3. Remember that a correlation does not necessarily demonstrate a causal relationship. A significant correlation only shows that two factors vary in a related way (positively or negatively). 4. The formula above can be rewritten as r = σ xy 1 1, σ x = x2 x 2, σ y = y2 ȳ 2 σ x σ y n n σ xy = xy xȳ, x = x, ȳ = y n n n 2
 2, x 2 x Syy = n ( ) 2 y 2 y Where x and y observed values of variables X and Y respectively. Important notes 1.")
3 Scatter Diagrams Scatter diagrams are used to graphically represent and compare two sets of data. The independent variable is usually plotted on thex axis. The dependent variable is plotted on the Y axis. By looking at a scatter diagram, we can see whether there is any connection (correlation) between the two sets of data. A scatter plot is a useful summary of a set of bivariate data (two variables), usually drawn before working out a linear correlation coefficient or fitting a regression line. It gives a good visual picture of the relationship between the two variables, and aids the interpretation of the correlation coefficient or regression model. Strong positive correlation r Positive correlation r Y 6 4 Y X X 10 Negative correlation r No correlation r Y 6 4 Y X X From plots one can see that if the more the points tend to cluster around a straight line and the higher the correlation (the stronger the linear relationship between the two variables). If there exists a random scatter of points, there is no relationship between the two variables (very low or zero correlation). Very low or zero correlation could result from a non-linear relationship between the variables. If the relationship is in fact non-linear (points clustering around a curve, not a straight line), the correlation coefficient will not be a good measure of the strength. A scatter plot will also show up a non-linear relationship between the two variables and whether or not there exist any outliers in the data. 3

4 Example 1 Determine on the basis of the following data whether there is a relationship between the time, in minutes, it takes a person to complete a task in the morningx and in the late afternoony. Morning(x) (min) Afternoon(y) (min) Solution The data set consists ofn = 10 observations. Step 1. Afternoon Y min Morning X min To construct the scatter diagram for the given data set to see any correlation between two sets of data. From the scatter diagram we can conclude that it is likely that there is a linear relationship between two variables. Step 2. Set out a table as follows and calculate all required values x, y, x 2, y 2, xy. Morning(x) (min) Afternoon(y) (min) x 2 y 2 xy x = 86.7 y = 88.8 x 2 = y 2 = xy =

5 Step 3. Calculate S xy = n xy x y = = S xx = n x 2 ( x) 2 = (86.7) 2 = S yy = n y 2 ( y) 2 = = Step 4 Finally we obtain correlation coefficient r r = S xy Sxx S xy = = The correlation coefficient is closed to 1 therefore the linear relationship exists between the two variables. Afternoon Y min Morning X min It would be tempting to try to fit a line to the data we have just analysed - producing an equation that shows the relationship, The method for this is called linear regression. By using linear regression method the line of best fit is Regression equation: y = 1.171x This line is shown in blue on the above graph. How to find this equation one can see in the next section. 5

6 Linear regression analysis: fitting a regression line to the data When a scatter plot indicates that there is a strong linear relationship between two variables (confirmed by high correlation coefficient), we can fit a straight line to this data which may be used to predict a value of the dependent variable, given the value of the independent variable. Recall that the equation of a regression line (straight line) is y = a + bx b = S xy S xx a = ȳ b x = i y i b i x i n To illustrate the technic, let us consider the following data. Example 2 Suppose that we had the following results from an experiment in which we measured the growth of a cell culture (as optical density) at different ph levels. ph Optical density Find the equation to fit these data. Solution We can follow the same procedures for correlation, as before. The data set consists ofn = 9 observations. Step 1. To construct the scatter diagram for the given data set to see any correlation between two sets of data. Optical density These results suggest a linear relationship ph 6
 at different ph levels. ph 3 4 4.5 5 5.5 6 6.5 7 7.")
7 Step 2. Set out a table as follows and calculate all required values x, y, x 2, y 2, xy. ph(x) Optical density(y) x 2 y 2 xy x = 49 y = 3.04 x 2 = 284 y 2 = xy = 18.2 x = ȳ = Step 3. Calculate S xy = n xy x y = = = S xx = n x 2 ( x) 2 = = 155. S yy = n y 2 ( y) 2 = = Step 4. Finally we obtain correlation coefficient r r = S xy Sxx S xy = = The correlation coefficient is closed to1therefore it is likely that the linear relationship exists between the two variables. To verify the correlation r we can run a hypothesis test. 7

8 Step 5. A hypothesis test Hypothesis about the population correlation coefficient ρ 1. The null hypothesish 0 : ρ = The alternative hypothesish A : ρ 0. Distribution of test statistic. When H 0 is true (ρ = 0) and the assumption are met, the appropriate test statistic is distributed as Student s t distribution n 2 ( the test statistics ist = r withn 2 degrees of freedom). 1 r2 The number of degrees of freedom is two less than the number of points on the graph (9 2 7 degrees of freedom in our example because we have 9 points). Decision rule. If we let α = 0.025, 2α = 0.05, the critical values of t in the present example are ±2.365 (e.g. see John Murdoch, Statistical tables for students of science, engineering, psychology, business, management, finance, 1998, Macmillan, 79 p., Table 7). If, from our data, we compute a value of t that is either greater or equal to or less than or equal to 2.365, we will reject the null hypothesis. Calculation of test statistic. Statistical decision. 7 t = = critical value of t, we reject the null hypothesis. Since the computed value of the test statistic exceed the Conclusion. We conclude that there is a very highly significant positive correlation between ph and growth as measured by optical density of the cell culture. 8

9 Step 6. Now we want to use regression analysis to find the line of best fit to the data. We have done nearly all the work for this in the calculations above. The regression equation fory onxis: y = bx + a where b is the slope anda is the intercept (the point where the line crosses the y axis) We calculatebandaas: b = S xy S xx = = a = ȳ b x So the equation for the line of best fit is: (to 3 decimal places). = = = y = 0.096x Optical density ph r = y = 0.096x
. = 0.3378 0.")
10 Example 3 The tensile strength of a cable for upper-limb prosthesis was investigated. Stainless steel cable is commonly available in three sizes (diameters): 1.19 mm, 1.59 mm and2.38 mm. Four tests were performed for each diameter size and the results are given in the table below Cable diameter (mm) Cable cross area (mm 2 ) Tensile strength (KN) Let bex = Cable cross area (mm 2 ),Y =Tensile strength (KN) 1. Construct a scatter diagram to illustrate these results. 2. Calculate the correlation coefficient for the data and comment on the result. 3. Obtain the least squares estimates for the sample regression equation of Tensile strength on Cable cross area. 4. Estimate the tensile strength for cable with cross area Comment on the suitability of using the sample regression equation to estimate the tensile strength for cable with cross area 5. 10

11 Solution We can follow the same procedure, as before. The data set consists of n = 12 observations. 1. To construct the scatter diagram for the given data set to see any correlation between two sets of data. Tensile Strength Cross Area These results may suggest a linear relationship. 2. Set out a table as follows and calculate all required values x, y, x 2, y 2, xy. Cable cross area(x) Tensile strength(y) x 2 y 2 xy x = y = x 2 = y 2 = xy = x = ȳ =

12 Calculate S xy = n xy x y = = = S xx = n x 2 ( x) 2 = = S yy = n y 2 ( y) 2 = = Finally we obtain correlation coefficient r r = S xy Sxx S xy = = The correlation coefficient is closed to1therefore it is likely that the linear relationship exists between the two variables. To verify the correlation we can run a hypothesis test. 3. We calculatebandaas: b = S xy = S xx = a = ȳ b x = = So the equation for the line of best fit is: y = 1.053x (to 3 decimal places). 5 Tensile Strength r = y = 1.053x Cross Area 12

13 4. To estimate the tensile strength for cable with cross area 3 we need to substitute x = 3 into the regression equationy(3) = = The sample regression equation is not suitable to estimate the tensile strength for cable with cross area5because this value is outside the test range (1.1 x 4.45). Example 4 To make a prosthesis we must know the force that acts in it as the person moves. This force depends on the adjacent musculature. Records of the variation with time of the force in hip joints during level walking show two maximum values in the stance phase of each cycle. A total of16 subjects took part in the study. An indication of the variation in average of the maxima hip joint force with body weight W and the ratio of stride lengthlto heighth are given in the table below. WL (kg) H Mean hip joint force F (kn) Let bex = WL H and mean hip joint forcey Construct a scatter diagram to illustrate these results. Calculate the correlation coefficient for the data and comment on the result. Obtain the least squares estimates for the sample regression equation of WL H on Mean hip joint force. Solution We can follow the same procedure, as before. Another option is to use SPSS or Excel. 13


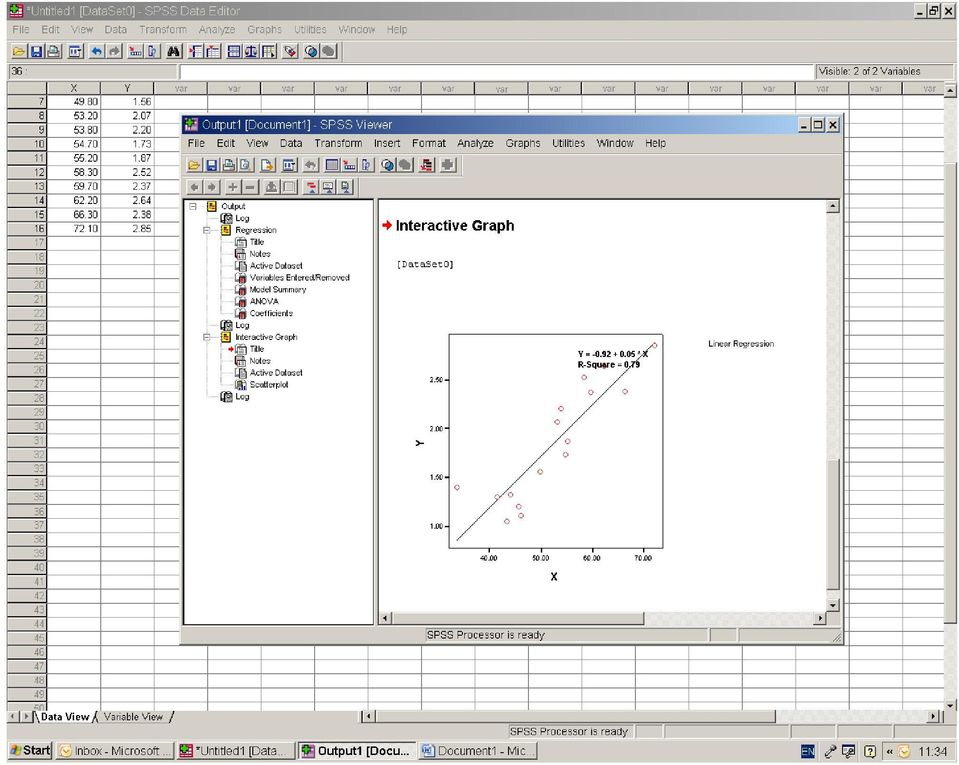
14 Example of using SPSS for Regression Analysis Open Data.sav. Click Analyze, click Regression and click Linear. In the Linear Regression dialog box click X and click an arrow to move X into Independent Variable list. In the Linear Regression dialog box click Y and click an arrow to move Y into Dependent Variable list.

15 Then click OK


16 You can use the Output Viewer to browse resultes. You can add a scatter plot. Click Graphs, click Iteractive, than click Scatterplot. The scatter plot can be edited, just double click on it.


17


18

19

CHAPTER 13 SIMPLE LINEAR REGRESSION. Opening Example. Simple Regression. Linear Regression
 Opening Example CHAPTER 13 SIMPLE LINEAR REGREION SIMPLE LINEAR REGREION! Simple Regression! Linear Regression Simple Regression Definition A regression model is a mathematical equation that descries the
Regression Analysis: A Complete Example
 Regression Analysis: A Complete Example This section works out an example that includes all the topics we have discussed so far in this chapter. A complete example of regression analysis. PhotoDisc, Inc./Getty
2. Simple Linear Regression
 Research methods - II 3 2. Simple Linear Regression Simple linear regression is a technique in parametric statistics that is commonly used for analyzing mean response of a variable Y which changes according
Example: Boats and Manatees
 Figure 9-6 Example: Boats and Manatees Slide 1 Given the sample data in Table 9-1, find the value of the linear correlation coefficient r, then refer to Table A-6 to determine whether there is a significant
Simple Linear Regression, Scatterplots, and Bivariate Correlation
 1 Simple Linear Regression, Scatterplots, and Bivariate Correlation This section covers procedures for testing the association between two continuous variables using the SPSS Regression and Correlate analyses.
NCSS Statistical Software Principal Components Regression. In ordinary least squares, the regression coefficients are estimated using the formula ( )
") Chapter 340 Principal Components Regression Introduction is a technique for analyzing multiple regression data that suffer from multicollinearity. When multicollinearity occurs, least squares estimates
Chapter 340 Principal Components Regression Introduction is a technique for analyzing multiple regression data that suffer from multicollinearity. When multicollinearity occurs, least squares estimates
Chapter 23. Inferences for Regression
 Chapter 23. Inferences for Regression Topics covered in this chapter: Simple Linear Regression Simple Linear Regression Example 23.1: Crying and IQ The Problem: Infants who cry easily may be more easily
SPSS Guide: Regression Analysis
 SPSS Guide: Regression Analysis I put this together to give you a step-by-step guide for replicating what we did in the computer lab. It should help you run the tests we covered. The best way to get familiar
WEB APPENDIX. Calculating Beta Coefficients. b Beta Rise Run Y 7.1 1 8.92 X 10.0 0.0 16.0 10.0 1.6
 WEB APPENDIX 8A Calculating Beta Coefficients The CAPM is an ex ante model, which means that all of the variables represent before-thefact, expected values. In particular, the beta coefficient used in
Scatter Plot, Correlation, and Regression on the TI-83/84
 Scatter Plot, Correlation, and Regression on the TI-83/84 Summary: When you have a set of (x,y) data points and want to find the best equation to describe them, you are performing a regression. This page
Chapter 7: Simple linear regression Learning Objectives
 Chapter 7: Simple linear regression Learning Objectives Reading: Section 7.1 of OpenIntro Statistics Video: Correlation vs. causation, YouTube (2:19) Video: Intro to Linear Regression, YouTube (5:18) -
Point Biserial Correlation Tests
 Chapter 807 Point Biserial Correlation Tests Introduction The point biserial correlation coefficient (ρ in this chapter) is the product-moment correlation calculated between a continuous random variable
DATA INTERPRETATION AND STATISTICS
 PholC60 September 001 DATA INTERPRETATION AND STATISTICS Books A easy and systematic introductory text is Essentials of Medical Statistics by Betty Kirkwood, published by Blackwell at about 14. DESCRIPTIVE
How To Run Statistical Tests in Excel
 How To Run Statistical Tests in Excel Microsoft Excel is your best tool for storing and manipulating data, calculating basic descriptive statistics such as means and standard deviations, and conducting
Course Objective This course is designed to give you a basic understanding of how to run regressions in SPSS.
 SPSS Regressions Social Science Research Lab American University, Washington, D.C. Web. www.american.edu/provost/ctrl/pclabs.cfm Tel. x3862 Email. SSRL@American.edu Course Objective This course is designed
Pearson's Correlation Tests
 Chapter 800 Pearson's Correlation Tests Introduction The correlation coefficient, ρ (rho), is a popular statistic for describing the strength of the relationship between two variables. The correlation
Unit 31 A Hypothesis Test about Correlation and Slope in a Simple Linear Regression
 Unit 31 A Hypothesis Test about Correlation and Slope in a Simple Linear Regression Objectives: To perform a hypothesis test concerning the slope of a least squares line To recognize that testing for a
Chapter 5 Analysis of variance SPSS Analysis of variance
 Chapter 5 Analysis of variance SPSS Analysis of variance Data file used: gss.sav How to get there: Analyze Compare Means One-way ANOVA To test the null hypothesis that several population means are equal,
Correlation Coefficient The correlation coefficient is a summary statistic that describes the linear relationship between two numerical variables 2
 Lesson 4 Part 1 Relationships between two numerical variables 1 Correlation Coefficient The correlation coefficient is a summary statistic that describes the linear relationship between two numerical variables
Diagrams and Graphs of Statistical Data
 Diagrams and Graphs of Statistical Data One of the most effective and interesting alternative way in which a statistical data may be presented is through diagrams and graphs. There are several ways in
Correlation key concepts:
 CORRELATION Correlation key concepts: Types of correlation Methods of studying correlation a) Scatter diagram b) Karl pearson s coefficient of correlation c) Spearman s Rank correlation coefficient d)
Part 2: Analysis of Relationship Between Two Variables
 Part 2: Analysis of Relationship Between Two Variables Linear Regression Linear correlation Significance Tests Multiple regression Linear Regression Y = a X + b Dependent Variable Independent Variable
Linear Regression. Chapter 5. Prediction via Regression Line Number of new birds and Percent returning. Least Squares
 Linear Regression Chapter 5 Regression Objective: To quantify the linear relationship between an explanatory variable (x) and response variable (y). We can then predict the average response for all subjects
Curve Fitting in Microsoft Excel By William Lee
 Curve Fitting in Microsoft Excel By William Lee This document is here to guide you through the steps needed to do curve fitting in Microsoft Excel using the least-squares method. In mathematical equations
A synonym is a word that has the same or almost the same definition of
 Slope-Intercept Form Determining the Rate of Change and y-intercept Learning Goals In this lesson, you will: Graph lines using the slope and y-intercept. Calculate the y-intercept of a line when given
Module 3: Correlation and Covariance
 Using Statistical Data to Make Decisions Module 3: Correlation and Covariance Tom Ilvento Dr. Mugdim Pašiƒ University of Delaware Sarajevo Graduate School of Business O ften our interest in data analysis
3.3. Solving Polynomial Equations. Introduction. Prerequisites. Learning Outcomes
 Solving Polynomial Equations 3.3 Introduction Linear and quadratic equations, dealt within Sections 3.1 and 3.2, are members of a class of equations, called polynomial equations. These have the general
Chapter 13 Introduction to Linear Regression and Correlation Analysis
 Chapter 3 Student Lecture Notes 3- Chapter 3 Introduction to Linear Regression and Correlation Analsis Fall 2006 Fundamentals of Business Statistics Chapter Goals To understand the methods for displaing
Introduction to Regression and Data Analysis
 Statlab Workshop Introduction to Regression and Data Analysis with Dan Campbell and Sherlock Campbell October 28, 2008 I. The basics A. Types of variables Your variables may take several forms, and it
Exercise 1.12 (Pg. 22-23)
") Individuals: The objects that are described by a set of data. They may be people, animals, things, etc. (Also referred to as Cases or Records) Variables: The characteristics recorded about each individual.
Individuals: The objects that are described by a set of data. They may be people, animals, things, etc. (Also referred to as Cases or Records) Variables: The characteristics recorded about each individual.
Homework 11. Part 1. Name: Score: / null
 Name: Score: / Homework 11 Part 1 null 1 For which of the following correlations would the data points be clustered most closely around a straight line? A. r = 0.50 B. r = -0.80 C. r = 0.10 D. There is
1. What is the critical value for this 95% confidence interval? CV = z.025 = invnorm(0.025) = 1.96
 = 1.96") 1 Final Review 2 Review 2.1 CI 1-propZint Scenario 1 A TV manufacturer claims in its warranty brochure that in the past not more than 10 percent of its TV sets needed any repair during the first two years
1 Final Review 2 Review 2.1 CI 1-propZint Scenario 1 A TV manufacturer claims in its warranty brochure that in the past not more than 10 percent of its TV sets needed any repair during the first two years
Elements of a graph. Click on the links below to jump directly to the relevant section
 Click on the links below to jump directly to the relevant section Elements of a graph Linear equations and their graphs What is slope? Slope and y-intercept in the equation of a line Comparing lines on
Section 14 Simple Linear Regression: Introduction to Least Squares Regression
 Slide 1 Section 14 Simple Linear Regression: Introduction to Least Squares Regression There are several different measures of statistical association used for understanding the quantitative relationship
The Correlation Coefficient
 The Correlation Coefficient Lelys Bravo de Guenni April 22nd, 2015 Outline The Correlation coefficient Positive Correlation Negative Correlation Properties of the Correlation Coefficient Non-linear association
2013 MBA Jump Start Program. Statistics Module Part 3
 2013 MBA Jump Start Program Module 1: Statistics Thomas Gilbert Part 3 Statistics Module Part 3 Hypothesis Testing (Inference) Regressions 2 1 Making an Investment Decision A researcher in your firm just
Simple linear regression
 Simple linear regression Introduction Simple linear regression is a statistical method for obtaining a formula to predict values of one variable from another where there is a causal relationship between
Section 3 Part 1. Relationships between two numerical variables
 Section 3 Part 1 Relationships between two numerical variables 1 Relationship between two variables The summary statistics covered in the previous lessons are appropriate for describing a single variable.
What does the number m in y = mx + b measure? To find out, suppose (x 1, y 1 ) and (x 2, y 2 ) are two points on the graph of y = mx + b.
 and (x 2, y 2 ) are two points on the graph of y = mx + b.") PRIMARY CONTENT MODULE Algebra - Linear Equations & Inequalities T-37/H-37 What does the number m in y = mx + b measure? To find out, suppose (x 1, y 1 ) and (x 2, y 2 ) are two points on the graph of
PRIMARY CONTENT MODULE Algebra - Linear Equations & Inequalities T-37/H-37 What does the number m in y = mx + b measure? To find out, suppose (x 1, y 1 ) and (x 2, y 2 ) are two points on the graph of
Module 5: Statistical Analysis
 Module 5: Statistical Analysis To answer more complex questions using your data, or in statistical terms, to test your hypothesis, you need to use more advanced statistical tests. This module reviews the
TIME SERIES ANALYSIS & FORECASTING
 CHAPTER 19 TIME SERIES ANALYSIS & FORECASTING Basic Concepts 1. Time Series Analysis BASIC CONCEPTS AND FORMULA The term Time Series means a set of observations concurring any activity against different
Common Core Unit Summary Grades 6 to 8
 Common Core Unit Summary Grades 6 to 8 Grade 8: Unit 1: Congruence and Similarity- 8G1-8G5 rotations reflections and translations,( RRT=congruence) understand congruence of 2 d figures after RRT Dilations
Tutorial on Using Excel Solver to Analyze Spin-Lattice Relaxation Time Data
 Tutorial on Using Excel Solver to Analyze Spin-Lattice Relaxation Time Data In the measurement of the Spin-Lattice Relaxation time T 1, a 180 o pulse is followed after a delay time of t with a 90 o pulse,
5 Systems of Equations
 Systems of Equations Concepts: Solutions to Systems of Equations-Graphically and Algebraically Solving Systems - Substitution Method Solving Systems - Elimination Method Using -Dimensional Graphs to Approximate
X X X a) perfect linear correlation b) no correlation c) positive correlation (r = 1) (r = 0) (0 < r < 1)
 perfect linear correlation b) no correlation c) positive correlation (r = 1) (r = 0) (0 < r < 1)") CORRELATION AND REGRESSION / 47 CHAPTER EIGHT CORRELATION AND REGRESSION Correlation and regression are statistical methods that are commonly used in the medical literature to compare two or more variables.
CORRELATION AND REGRESSION / 47 CHAPTER EIGHT CORRELATION AND REGRESSION Correlation and regression are statistical methods that are commonly used in the medical literature to compare two or more variables.
Formula for linear models. Prediction, extrapolation, significance test against zero slope.
 Formula for linear models. Prediction, extrapolation, significance test against zero slope. Last time, we looked the linear regression formula. It s the line that fits the data best. The Pearson correlation
There are six different windows that can be opened when using SPSS. The following will give a description of each of them.
 SPSS Basics Tutorial 1: SPSS Windows There are six different windows that can be opened when using SPSS. The following will give a description of each of them. The Data Editor The Data Editor is a spreadsheet
Hypothesis testing - Steps
 Hypothesis testing - Steps Steps to do a two-tailed test of the hypothesis that β 1 0: 1. Set up the hypotheses: H 0 : β 1 = 0 H a : β 1 0. 2. Compute the test statistic: t = b 1 0 Std. error of b 1 =
2. What is the general linear model to be used to model linear trend? (Write out the model) = + + + or
 = + + + or") Simple and Multiple Regression Analysis Example: Explore the relationships among Month, Adv.$ and Sales $: 1. Prepare a scatter plot of these data. The scatter plots for Adv.$ versus Sales, and Month versus
Simple and Multiple Regression Analysis Example: Explore the relationships among Month, Adv.$ and Sales $: 1. Prepare a scatter plot of these data. The scatter plots for Adv.$ versus Sales, and Month versus
The KaleidaGraph Guide to Curve Fitting
 The KaleidaGraph Guide to Curve Fitting Contents Chapter 1 Curve Fitting Overview 1.1 Purpose of Curve Fitting... 5 1.2 Types of Curve Fits... 5 Least Squares Curve Fits... 5 Nonlinear Curve Fits... 6
DEPARTMENT OF PSYCHOLOGY UNIVERSITY OF LANCASTER MSC IN PSYCHOLOGICAL RESEARCH METHODS ANALYSING AND INTERPRETING DATA 2 PART 1 WEEK 9
 DEPARTMENT OF PSYCHOLOGY UNIVERSITY OF LANCASTER MSC IN PSYCHOLOGICAL RESEARCH METHODS ANALYSING AND INTERPRETING DATA 2 PART 1 WEEK 9 Analysis of covariance and multiple regression So far in this course,
Univariate Regression
 Univariate Regression Correlation and Regression The regression line summarizes the linear relationship between 2 variables Correlation coefficient, r, measures strength of relationship: the closer r is
Copyright 2013 by Laura Schultz. All rights reserved. Page 1 of 7
 Using Your TI-83/84/89 Calculator: Linear Correlation and Regression Dr. Laura Schultz Statistics I This handout describes how to use your calculator for various linear correlation and regression applications.
Directions for using SPSS
 Directions for using SPSS Table of Contents Connecting and Working with Files 1. Accessing SPSS... 2 2. Transferring Files to N:\drive or your computer... 3 3. Importing Data from Another File Format...
We are often interested in the relationship between two variables. Do people with more years of full-time education earn higher salaries?
 Statistics: Correlation Richard Buxton. 2008. 1 Introduction We are often interested in the relationship between two variables. Do people with more years of full-time education earn higher salaries? Do
LAGUARDIA COMMUNITY COLLEGE CITY UNIVERSITY OF NEW YORK DEPARTMENT OF MATHEMATICS, ENGINEERING, AND COMPUTER SCIENCE
 LAGUARDIA COMMUNITY COLLEGE CITY UNIVERSITY OF NEW YORK DEPARTMENT OF MATHEMATICS, ENGINEERING, AND COMPUTER SCIENCE MAT 119 STATISTICS AND ELEMENTARY ALGEBRA 5 Lecture Hours, 2 Lab Hours, 3 Credits Pre-
Statistical Models in R
 Statistical Models in R Some Examples Steven Buechler Department of Mathematics 276B Hurley Hall; 1-6233 Fall, 2007 Outline Statistical Models Linear Models in R Regression Regression analysis is the appropriate
Using Excel (Microsoft Office 2007 Version) for Graphical Analysis of Data
 for Graphical Analysis of Data") Using Excel (Microsoft Office 2007 Version) for Graphical Analysis of Data Introduction In several upcoming labs, a primary goal will be to determine the mathematical relationship between two variable
Using Excel (Microsoft Office 2007 Version) for Graphical Analysis of Data Introduction In several upcoming labs, a primary goal will be to determine the mathematical relationship between two variable
Using Microsoft Excel to Plot and Analyze Kinetic Data
 Entering and Formatting Data Using Microsoft Excel to Plot and Analyze Kinetic Data Open Excel. Set up the spreadsheet page (Sheet 1) so that anyone who reads it will understand the page (Figure 1). Type
Linear Approximations ACADEMIC RESOURCE CENTER
 Linear Approximations ACADEMIC RESOURCE CENTER Table of Contents Linear Function Linear Function or Not Real World Uses for Linear Equations Why Do We Use Linear Equations? Estimation with Linear Approximations
January 26, 2009 The Faculty Center for Teaching and Learning
 THE BASICS OF DATA MANAGEMENT AND ANALYSIS A USER GUIDE January 26, 2009 The Faculty Center for Teaching and Learning THE BASICS OF DATA MANAGEMENT AND ANALYSIS Table of Contents Table of Contents... i
Moderation. Moderation
 Stats - Moderation Moderation A moderator is a variable that specifies conditions under which a given predictor is related to an outcome. The moderator explains when a DV and IV are related. Moderation
CORRELATION ANALYSIS
 CORRELATION ANALYSIS Learning Objectives Understand how correlation can be used to demonstrate a relationship between two factors. Know how to perform a correlation analysis and calculate the coefficient
" Y. Notation and Equations for Regression Lecture 11/4. Notation:
 Notation: Notation and Equations for Regression Lecture 11/4 m: The number of predictor variables in a regression Xi: One of multiple predictor variables. The subscript i represents any number from 1 through
Multiple Linear Regression
 Multiple Linear Regression A regression with two or more explanatory variables is called a multiple regression. Rather than modeling the mean response as a straight line, as in simple regression, it is
with functions, expressions and equations which follow in units 3 and 4.
 Grade 8 Overview View unit yearlong overview here The unit design was created in line with the areas of focus for grade 8 Mathematics as identified by the Common Core State Standards and the PARCC Model
DESCRIPTIVE STATISTICS AND EXPLORATORY DATA ANALYSIS
 DESCRIPTIVE STATISTICS AND EXPLORATORY DATA ANALYSIS SEEMA JAGGI Indian Agricultural Statistics Research Institute Library Avenue, New Delhi - 110 012 seema@iasri.res.in 1. Descriptive Statistics Statistics
Copyright 2007 by Laura Schultz. All rights reserved. Page 1 of 5
 Using Your TI-83/84 Calculator: Linear Correlation and Regression Elementary Statistics Dr. Laura Schultz This handout describes how to use your calculator for various linear correlation and regression
Calculator Notes for the TI-Nspire and TI-Nspire CAS
 CHAPTER 11 Calculator Notes for the Note 11A: Entering e In any application, press u to display the value e. Press. after you press u to display the value of e without an exponent. Note 11B: Normal Graphs
Simple Regression Theory II 2010 Samuel L. Baker
 SIMPLE REGRESSION THEORY II 1 Simple Regression Theory II 2010 Samuel L. Baker Assessing how good the regression equation is likely to be Assignment 1A gets into drawing inferences about how close the
Elementary Statistics Sample Exam #3
 Elementary Statistics Sample Exam #3 Instructions. No books or telephones. Only the supplied calculators are allowed. The exam is worth 100 points. 1. A chi square goodness of fit test is considered to
Year 9 set 1 Mathematics notes, to accompany the 9H book.
 Part 1: Year 9 set 1 Mathematics notes, to accompany the 9H book. equations 1. (p.1), 1.6 (p. 44), 4.6 (p.196) sequences 3. (p.115) Pupils use the Elmwood Press Essential Maths book by David Raymer (9H
Using Excel for inferential statistics
 FACT SHEET Using Excel for inferential statistics Introduction When you collect data, you expect a certain amount of variation, just caused by chance. A wide variety of statistical tests can be applied
Getting Correct Results from PROC REG
 Getting Correct Results from PROC REG Nathaniel Derby, Statis Pro Data Analytics, Seattle, WA ABSTRACT PROC REG, SAS s implementation of linear regression, is often used to fit a line without checking
AP Physics 1 and 2 Lab Investigations
 AP Physics 1 and 2 Lab Investigations Student Guide to Data Analysis New York, NY. College Board, Advanced Placement, Advanced Placement Program, AP, AP Central, and the acorn logo are registered trademarks
Calibration and Linear Regression Analysis: A Self-Guided Tutorial
 Calibration and Linear Regression Analysis: A Self-Guided Tutorial Part 1 Instrumental Analysis with Excel: The Basics CHM314 Instrumental Analysis Department of Chemistry, University of Toronto Dr. D.
GRADES 7, 8, AND 9 BIG IDEAS
 Table 1: Strand A: BIG IDEAS: MATH: NUMBER Introduce perfect squares, square roots, and all applications Introduce rational numbers (positive and negative) Introduce the meaning of negative exponents for
17. SIMPLE LINEAR REGRESSION II
 17. SIMPLE LINEAR REGRESSION II The Model In linear regression analysis, we assume that the relationship between X and Y is linear. This does not mean, however, that Y can be perfectly predicted from X.
 T O P I C 1 2 Techniques and tools for data analysis Preview Introduction In chapter 3 of Statistics In A Day different combinations of numbers and types of variables are presented. We go through these
6 EXTENDING ALGEBRA. 6.0 Introduction. 6.1 The cubic equation. Objectives
 6 EXTENDING ALGEBRA Chapter 6 Extending Algebra Objectives After studying this chapter you should understand techniques whereby equations of cubic degree and higher can be solved; be able to factorise
Simple Linear Regression Inference
 Simple Linear Regression Inference 1 Inference requirements The Normality assumption of the stochastic term e is needed for inference even if it is not a OLS requirement. Therefore we have: Interpretation
ESTIMATING THE DISTRIBUTION OF DEMAND USING BOUNDED SALES DATA
 ESTIMATING THE DISTRIBUTION OF DEMAND USING BOUNDED SALES DATA Michael R. Middleton, McLaren School of Business, University of San Francisco 0 Fulton Street, San Francisco, CA -00 -- middleton@usfca.edu
Solving Quadratic Equations
 9.3 Solving Quadratic Equations by Using the Quadratic Formula 9.3 OBJECTIVES 1. Solve a quadratic equation by using the quadratic formula 2. Determine the nature of the solutions of a quadratic equation
Absorbance Spectrophotometry: Analysis of FD&C Red Food Dye #40 Calibration Curve Procedure
 Absorbance Spectrophotometry: Analysis of FD&C Red Food Dye #40 Calibration Curve Procedure Note: there is a second document that goes with this one! 2046 - Absorbance Spectrophotometry. Make sure you
Econometrics Simple Linear Regression
 Econometrics Simple Linear Regression Burcu Eke UC3M Linear equations with one variable Recall what a linear equation is: y = b 0 + b 1 x is a linear equation with one variable, or equivalently, a straight
Vertical Alignment Colorado Academic Standards 6 th - 7 th - 8 th
 Vertical Alignment Colorado Academic Standards 6 th - 7 th - 8 th Standard 3: Data Analysis, Statistics, and Probability 6 th Prepared Graduates: 1. Solve problems and make decisions that depend on un
CORRELATED TO THE SOUTH CAROLINA COLLEGE AND CAREER-READY FOUNDATIONS IN ALGEBRA
 We Can Early Learning Curriculum PreK Grades 8 12 INSIDE ALGEBRA, GRADES 8 12 CORRELATED TO THE SOUTH CAROLINA COLLEGE AND CAREER-READY FOUNDATIONS IN ALGEBRA April 2016 www.voyagersopris.com Mathematical
3.2. Solving quadratic equations. Introduction. Prerequisites. Learning Outcomes. Learning Style
 Solving quadratic equations 3.2 Introduction A quadratic equation is one which can be written in the form ax 2 + bx + c = 0 where a, b and c are numbers and x is the unknown whose value(s) we wish to find.
PERFORMING REGRESSION ANALYSIS USING MICROSOFT EXCEL
 PERFORMING REGRESSION ANALYSIS USING MICROSOFT EXCEL John O. Mason, Ph.D., CPA Professor of Accountancy Culverhouse School of Accountancy The University of Alabama Abstract: This paper introduces you to
Physics Lab Report Guidelines
 Physics Lab Report Guidelines Summary The following is an outline of the requirements for a physics lab report. A. Experimental Description 1. Provide a statement of the physical theory or principle observed
Business Statistics. Successful completion of Introductory and/or Intermediate Algebra courses is recommended before taking Business Statistics.
 Business Course Text Bowerman, Bruce L., Richard T. O'Connell, J. B. Orris, and Dawn C. Porter. Essentials of Business, 2nd edition, McGraw-Hill/Irwin, 2008, ISBN: 978-0-07-331988-9. Required Computing
Prism 6 Step-by-Step Example Linear Standard Curves Interpolating from a standard curve is a common way of quantifying the concentration of a sample.
 Prism 6 Step-by-Step Example Linear Standard Curves Interpolating from a standard curve is a common way of quantifying the concentration of a sample. Step 1 is to construct a standard curve that defines
The North Carolina Health Data Explorer
 1 The North Carolina Health Data Explorer The Health Data Explorer provides access to health data for North Carolina counties in an interactive, user-friendly atlas of maps, tables, and charts. It allows
You buy a TV for $1000 and pay it off with $100 every week. The table below shows the amount of money you sll owe every week. Week 1 2 3 4 5 6 7 8 9
 Warm Up: You buy a TV for $1000 and pay it off with $100 every week. The table below shows the amount of money you sll owe every week Week 1 2 3 4 5 6 7 8 9 Money Owed 900 800 700 600 500 400 300 200 100
Indiana State Core Curriculum Standards updated 2009 Algebra I
 Indiana State Core Curriculum Standards updated 2009 Algebra I Strand Description Boardworks High School Algebra presentations Operations With Real Numbers Linear Equations and A1.1 Students simplify and
ANALYSIS OF TREND CHAPTER 5
 ANALYSIS OF TREND CHAPTER 5 ERSH 8310 Lecture 7 September 13, 2007 Today s Class Analysis of trends Using contrasts to do something a bit more practical. Linear trends. Quadratic trends. Trends in SPSS.
A Guide to Using Excel in Physics Lab
 A Guide to Using Excel in Physics Lab Excel has the potential to be a very useful program that will save you lots of time. Excel is especially useful for making repetitious calculations on large data sets.
The importance of graphing the data: Anscombe s regression examples
 The importance of graphing the data: Anscombe s regression examples Bruce Weaver Northern Health Research Conference Nipissing University, North Bay May 30-31, 2008 B. Weaver, NHRC 2008 1 The Objective
EXCEL Tutorial: How to use EXCEL for Graphs and Calculations.
 EXCEL Tutorial: How to use EXCEL for Graphs and Calculations. Excel is powerful tool and can make your life easier if you are proficient in using it. You will need to use Excel to complete most of your
Chapter 10. Key Ideas Correlation, Correlation Coefficient (r),
,") Chapter 0 Key Ideas Correlation, Correlation Coefficient (r), Section 0-: Overview We have already explored the basics of describing single variable data sets. However, when two quantitative variables
Chapter 0 Key Ideas Correlation, Correlation Coefficient (r), Section 0-: Overview We have already explored the basics of describing single variable data sets. However, when two quantitative variables