PROBABILITY DISTRIBUTIONS. Introduction to Probability Distributions
|
|
|
- Deborah Casey
- 9 years ago
- Views:
Transcription
1 PROBABILITY DISTRIBUTIONS Introduction to Probability Distributions

2 What is a Probability Distribution? Experiment: Toss a coin three times. Observe the number of heads. The possible results are: zero heads, one head, two heads, and three heads. What is the probability distribution for the number of heads?

3 Probability Distribution of Number of Heads Observed in 3 Tosses of a Coin

4 Characteristics of a Probability Distribution
5 Discrete Probability Distribution 1. List of All possible [x, p(x)] pairs x = Value of Random Variable (Outcome) p(x) = Probability Associated with Value 2. Mutually Exclusive (No Overlap) 3. Collectively Exhaustive (Nothing Left Out) 4. 0 p(x) 1 5. p(x) = 1 5

6 Random Variables Random variable - a quantity resulting from an experiment that, by chance, can assume different values.
7 Types of Random Variables Discrete Random Variable can assume only certain clearly separated values. It is usually the result of counting something Continuous Random Variable can assume an infinite number of values within a given range. It is usually the result of some type of measurement
8 Discrete Random Variables - Examples The number of students in a class. The number of children in a family. The number of cars entering a carwash in a hour. Number of home mortgages approved by Coastal Federal Bank last week.
9 Continuous Random Variables - Examples The distance students travel to class. The time it takes an executive to drive to work. The length of an afternoon nap. The length of time of a particular phone call.
10 Features of a Discrete Distribution The main features of a discrete probability distribution are: The sum of the probabilities of the various outcomes is The probability of a particular outcome is between 0 and The outcomes are mutually exclusive.
11 The Mean of a Probability Distribution MEAN The mean is a typical value used to represent the central location of a probability distribution. The mean of a probability distribution is also referred to as its expected value.
12 The Variance, and Standard Deviation of a Probability Distribution Variance and Standard Deviation Measures the amount of spread in a distribution The computational steps are: 1. Subtract the mean from each value, and square this difference. 2. Multiply each squared difference by its probability. 3. Sum the resulting products to arrive at the variance. The standard deviation is found by taking the positive square root of the variance.

13 Mean, Variance, and Standard Deviation of a Probability Distribution - Example John Ragsdale sells new cars for Pelican Ford. John usually sells the largest number of cars on Saturday. He has developed the following probability distribution for the number of cars he expects to sell on a particular Saturday.

14 Mean of a Probability Distribution - Example

15 Variance and Standard Deviation of a Probability Distribution - Example
16 Example 2
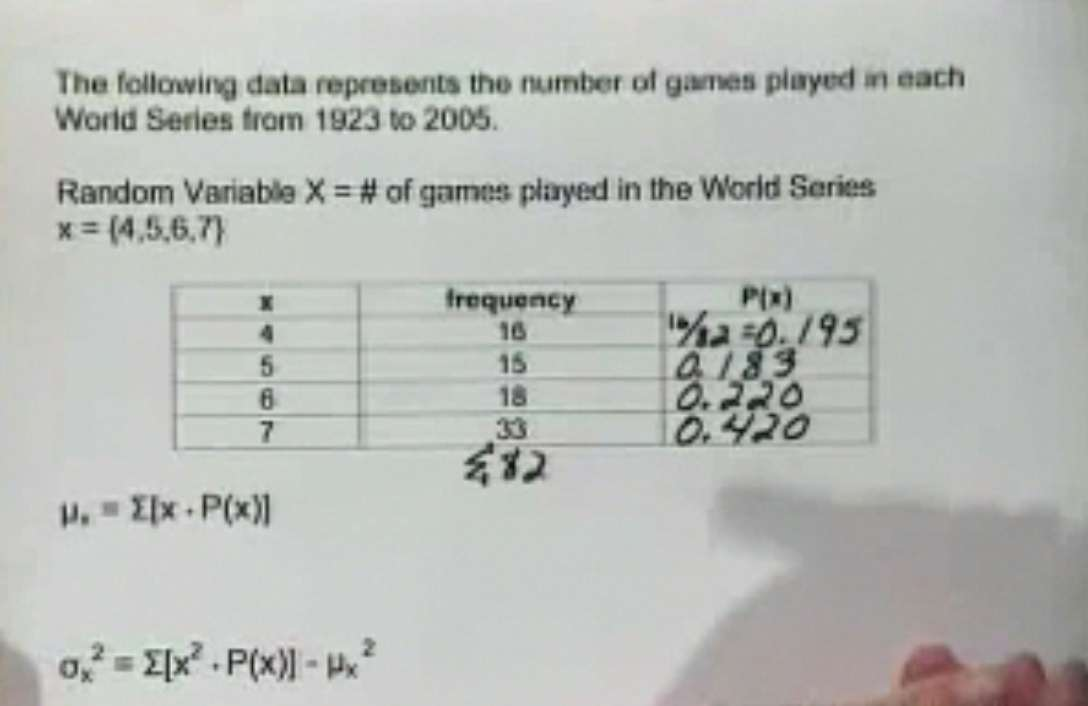
17 Example 2
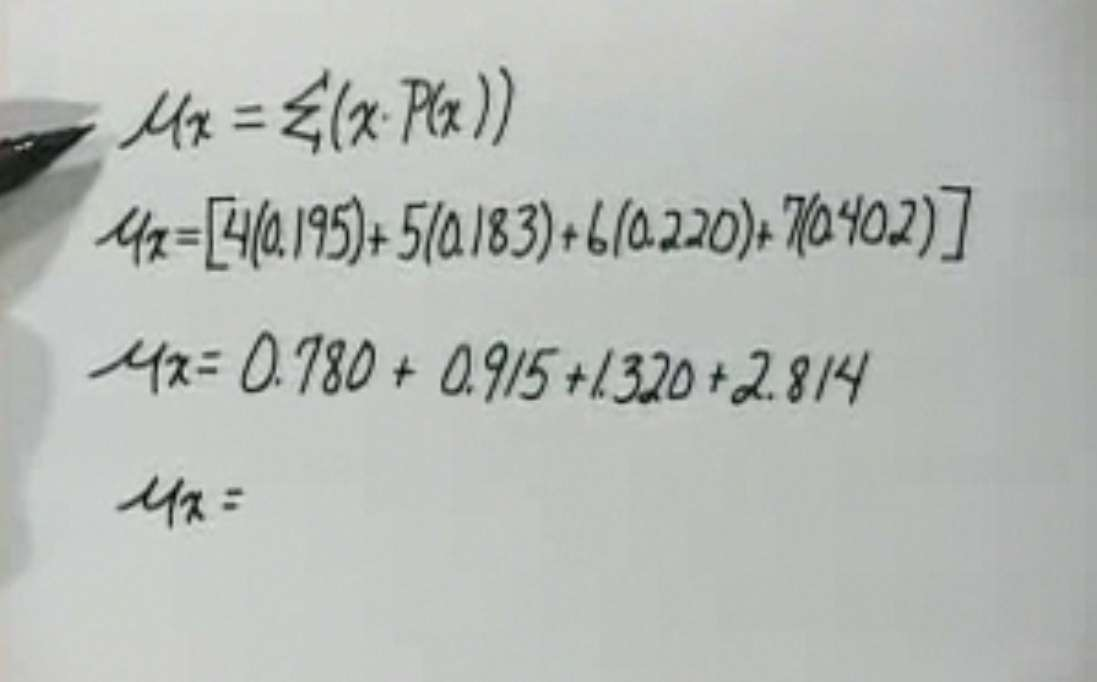
18 Example 2

19 Example 2
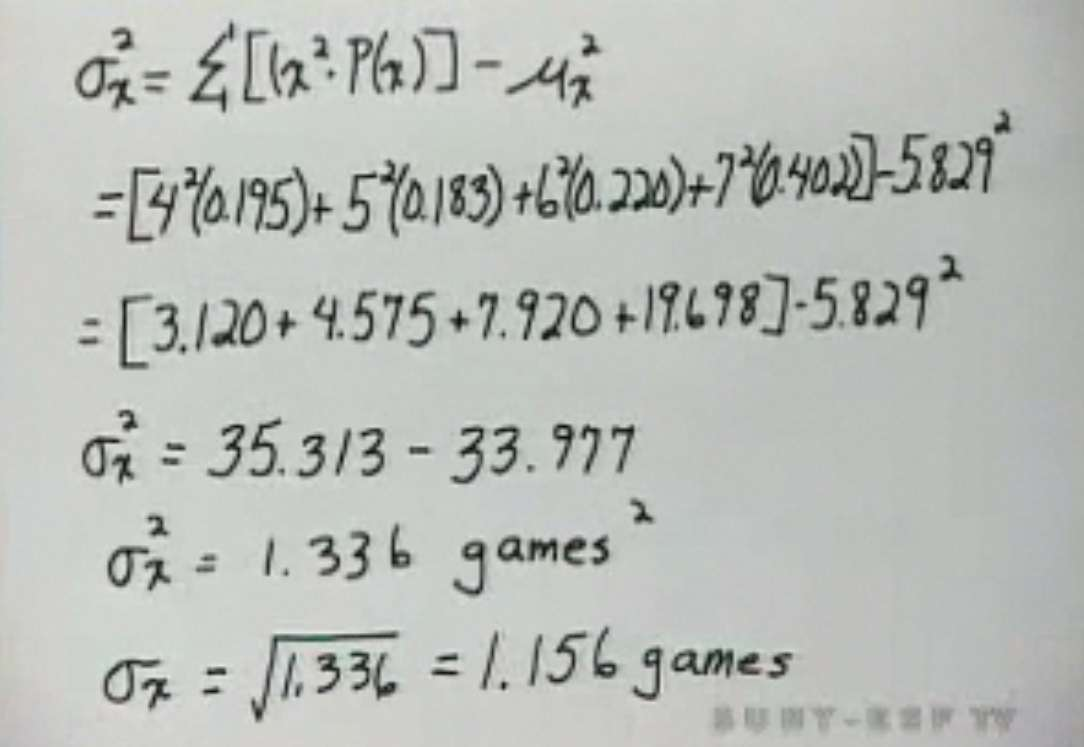
20 Example 2
21 Summary Measures mu 1. Expected Value Mean of Probability Distribution Weighted Average of All Possible Values = E(X) = x p(x) 2. Variance Sigma -squared Weighted Average Squared Deviation about Mean 2 = V(X)= E[ (x (x p(x) 2 = V(X)=E(X [E(X 3. Standard Deviation 2 = SD(X) 21
22 Binomial Probability Distribution Characteristics of a Binomial Probability Distribution There are only two possible outcomes on a particular trial of an experiment. The outcomes are mutually exclusive, The random variable is the result of counts. Each trial is independent of any other trial

23 Binomial Probability Formula

24 Binomial Probability - Example There are five flights daily from Pittsburgh via US Airways into the Bradford, Pennsylvania, Regional Airport. Suppose the probability that any flight arrives late is.20. What is the probability that none of the flights are late today?

25 Binomial Probability - Excel

26 Binomial Dist. Mean and Variance

27 Binomial Dist. Mean and Variance: Example For the example regarding the number of late flights, recall that =.20 and n = 5. What is the average number of late flights? What is the variance of the number of late flights?

28 Binomial Dist. Mean and Variance: Another Solution

29 Binomial Distribution - Table Five percent of the worm gears produced by an automatic, highspeed Carter-Bell milling machine are defective. What is the probability that out of six gears selected at random none will be defective? Exactly one? Exactly two? Exactly three? Exactly four? Exactly five? Exactly six out of six?

30 Binomial Distribution - MegaStat Five percent of the worm gears produced by an automatic, high-speed Carter-Bell milling machine are defective. What is the probability that out of six gears selected at random none will be defective? Exactly one? Exactly two? Exactly three? Exactly four? Exactly five? Exactly six out of six?

31 Binomial Shapes for Varying (n constant)

32 Binomial Shapes for Varying n ( constant)

33 Cumulative Binomial Probability Distributions A study in June 2003 by the Illinois Department of Transportation concluded that 76.2 percent of front seat occupants used seat belts. A sample of 12 vehicles is selected. What is the probability the front seat occupants in at least 7 of the 12 vehicles are wearing seat belts?

34 Cumulative Binomial Probability Distributions - Excel
35 Finite Population A finite population is a population consisting of a fixed number of known individuals, objects, or measurements. Examples include: The number of students in this class. The number of cars in the parking lot. The number of homes built in Temerloh
36 Hypergeometric Distribution The hypergeometric distribution has the following characteristics: There are only 2 possible outcomes. The probability of a success is not the same on each trial. It results from a count of the number of successes in a fixed number of trials.
37 Hypergeometric Distribution Use the hypergeometric distribution to find the probability of a specified number of successes or failures if: the sample is selected from a finite population without replacement the size of the sample n is greater than 5% of the size of the population N (i.e. n/n.05)

38 Hypergeometric Distribution

39 Hypergeometric Distribution - Example PlayTime Toys, Inc., employs 50 people in the Assembly Department. Forty of the employees belong to a union and ten do not. Five employees are selected at random to form a committee to meet with management regarding shift starting times. What is the probability that four of the five selected for the committee belong to a union?

40 Hypergeometric Distribution - Example

41 Hypergeometric Distribution - Excel
42 Poisson Probability Distribution The Poisson probability distribution describes the number of times some event occurs during a specified interval. The interval may be time, distance, area, or volume. Assumptions of the Poisson Distribution (1) The probability is proportional to the length of the interval. (2) The intervals are independent.

43 Poisson Probability Distribution The Poisson distribution can be described mathematically using the formula:
44 Poisson Probability Distribution The mean number of successes can be determined in binomial situations by n, where n is the number of trials and the probability of a success. The variance of the Poisson distribution is also equal to n.
. If the number of lost bags per flight follows a Poisson distribution with u = 0.")
45 Poisson Probability Distribution - Example Assume baggage is rarely lost by Northwest Airlines. Suppose a random sample of 1,000 flights shows a total of 300 bags were lost. Thus, the arithmetic mean number of lost bags per flight is 0.3 (300/1,000). If the number of lost bags per flight follows a Poisson distribution with u = 0.3, find the probability of not losing any bags.
. If the number of lost bags per flight follows a Poisson distribution with mean = 0.")
46 Poisson Probability Distribution - Table Assume baggage is rarely lost by Northwest Airlines. Suppose a random sample of 1,000 flights shows a total of 300 bags were lost. Thus, the arithmetic mean number of lost bags per flight is 0.3 (300/1,000). If the number of lost bags per flight follows a Poisson distribution with mean = 0.3, find the probability of not losing any bags
Distributions. GOALS When you have completed this chapter, you will be able to: 1 Define the terms probability distribution and random variable.
 6 Discrete GOALS When you have completed this chapter, you will be able to: Probability 1 Define the terms probability distribution and random variable. 2 Distinguish between discrete and continuous probability
Chapter 5. Random variables
 Random variables random variable numerical variable whose value is the outcome of some probabilistic experiment; we use uppercase letters, like X, to denote such a variable and lowercase letters, like
Chapter 4 Lecture Notes
 Chapter 4 Lecture Notes Random Variables October 27, 2015 1 Section 4.1 Random Variables A random variable is typically a real-valued function defined on the sample space of some experiment. For instance,
CHAPTER 7 SECTION 5: RANDOM VARIABLES AND DISCRETE PROBABILITY DISTRIBUTIONS
 CHAPTER 7 SECTION 5: RANDOM VARIABLES AND DISCRETE PROBABILITY DISTRIBUTIONS TRUE/FALSE 235. The Poisson probability distribution is a continuous probability distribution. F 236. In a Poisson distribution,
Normal distribution. ) 2 /2σ. 2π σ
 2 /2σ. 2π σ") Normal distribution The normal distribution is the most widely known and used of all distributions. Because the normal distribution approximates many natural phenomena so well, it has developed into a
Normal distribution The normal distribution is the most widely known and used of all distributions. Because the normal distribution approximates many natural phenomena so well, it has developed into a
Important Probability Distributions OPRE 6301
 Important Probability Distributions OPRE 6301 Important Distributions... Certain probability distributions occur with such regularity in real-life applications that they have been given their own names.
Chapter 4. Probability Distributions
 Chapter 4 Probability Distributions Lesson 4-1/4-2 Random Variable Probability Distributions This chapter will deal the construction of probability distribution. By combining the methods of descriptive
The Binomial Probability Distribution
 The Binomial Probability Distribution MATH 130, Elements of Statistics I J. Robert Buchanan Department of Mathematics Fall 2015 Objectives After this lesson we will be able to: determine whether a probability
4.1 4.2 Probability Distribution for Discrete Random Variables
 4.1 4.2 Probability Distribution for Discrete Random Variables Key concepts: discrete random variable, probability distribution, expected value, variance, and standard deviation of a discrete random variable.
Random variables, probability distributions, binomial random variable
 Week 4 lecture notes. WEEK 4 page 1 Random variables, probability distributions, binomial random variable Eample 1 : Consider the eperiment of flipping a fair coin three times. The number of tails that
39.2. The Normal Approximation to the Binomial Distribution. Introduction. Prerequisites. Learning Outcomes
 The Normal Approximation to the Binomial Distribution 39.2 Introduction We have already seen that the Poisson distribution can be used to approximate the binomial distribution for large values of n and
CHAPTER 6: Continuous Uniform Distribution: 6.1. Definition: The density function of the continuous random variable X on the interval [A, B] is.
![CHAPTER 6: Continuous Uniform Distribution: 6.1. Definition: The density function of the continuous random variable X on the interval [A, B] is.](/thumbs/40/21160284.jpg "CHAPTER 6: Continuous Uniform Distribution: 6.1. Definition: The density function of the continuous random variable X on the interval [A, B] is.") Some Continuous Probability Distributions CHAPTER 6: Continuous Uniform Distribution: 6. Definition: The density function of the continuous random variable X on the interval [A, B] is B A A x B f(x; A,
Some Continuous Probability Distributions CHAPTER 6: Continuous Uniform Distribution: 6. Definition: The density function of the continuous random variable X on the interval [A, B] is B A A x B f(x; A,
WHERE DOES THE 10% CONDITION COME FROM?
 1 WHERE DOES THE 10% CONDITION COME FROM? The text has mentioned The 10% Condition (at least) twice so far: p. 407 Bernoulli trials must be independent. If that assumption is violated, it is still okay
Section 6.1 Discrete Random variables Probability Distribution
 Section 6.1 Discrete Random variables Probability Distribution Definitions a) Random variable is a variable whose values are determined by chance. b) Discrete Probability distribution consists of the values
Chapter 3: DISCRETE RANDOM VARIABLES AND PROBABILITY DISTRIBUTIONS. Part 3: Discrete Uniform Distribution Binomial Distribution
 Chapter 3: DISCRETE RANDOM VARIABLES AND PROBABILITY DISTRIBUTIONS Part 3: Discrete Uniform Distribution Binomial Distribution Sections 3-5, 3-6 Special discrete random variable distributions we will cover
Lecture 5 : The Poisson Distribution
 Lecture 5 : The Poisson Distribution Jonathan Marchini November 10, 2008 1 Introduction Many experimental situations occur in which we observe the counts of events within a set unit of time, area, volume,
4. Continuous Random Variables, the Pareto and Normal Distributions
 4. Continuous Random Variables, the Pareto and Normal Distributions A continuous random variable X can take any value in a given range (e.g. height, weight, age). The distribution of a continuous random
An Introduction to Basic Statistics and Probability
 An Introduction to Basic Statistics and Probability Shenek Heyward NCSU An Introduction to Basic Statistics and Probability p. 1/4 Outline Basic probability concepts Conditional probability Discrete Random
Normal Distribution as an Approximation to the Binomial Distribution
 Chapter 1 Student Lecture Notes 1-1 Normal Distribution as an Approximation to the Binomial Distribution : Goals ONE TWO THREE 2 Review Binomial Probability Distribution applies to a discrete random variable
The normal approximation to the binomial
 The normal approximation to the binomial The binomial probability function is not useful for calculating probabilities when the number of trials n is large, as it involves multiplying a potentially very
ACMS 10140 Section 02 Elements of Statistics October 28, 2010. Midterm Examination II
 ACMS 10140 Section 02 Elements of Statistics October 28, 2010 Midterm Examination II Name DO NOT remove this answer page. DO turn in the entire exam. Make sure that you have all ten (10) pages of the examination
2. Discrete random variables
 2. Discrete random variables Statistics and probability: 2-1 If the chance outcome of the experiment is a number, it is called a random variable. Discrete random variable: the possible outcomes can be
Chapter 5 Discrete Probability Distribution. Learning objectives
 Chapter 5 Discrete Probability Distribution Slide 1 Learning objectives 1. Understand random variables and probability distributions. 1.1. Distinguish discrete and continuous random variables. 2. Able
ST 371 (IV): Discrete Random Variables
: Discrete Random Variables") ST 371 (IV): Discrete Random Variables 1 Random Variables A random variable (rv) is a function that is defined on the sample space of the experiment and that assigns a numerical variable to each possible
ST 371 (IV): Discrete Random Variables 1 Random Variables A random variable (rv) is a function that is defined on the sample space of the experiment and that assigns a numerical variable to each possible
STT315 Chapter 4 Random Variables & Probability Distributions KM. Chapter 4.5, 6, 8 Probability Distributions for Continuous Random Variables
 Chapter 4.5, 6, 8 Probability Distributions for Continuous Random Variables Discrete vs. continuous random variables Examples of continuous distributions o Uniform o Exponential o Normal Recall: A random
DETERMINE whether the conditions for a binomial setting are met. COMPUTE and INTERPRET probabilities involving binomial random variables
 1 Section 7.B Learning Objectives After this section, you should be able to DETERMINE whether the conditions for a binomial setting are met COMPUTE and INTERPRET probabilities involving binomial random
Ch5: Discrete Probability Distributions Section 5-1: Probability Distribution
 Recall: Ch5: Discrete Probability Distributions Section 5-1: Probability Distribution A variable is a characteristic or attribute that can assume different values. o Various letters of the alphabet (e.g.
SOLUTIONS: 4.1 Probability Distributions and 4.2 Binomial Distributions
 SOLUTIONS: 4.1 Probability Distributions and 4.2 Binomial Distributions 1. The following table contains a probability distribution for a random variable X. a. Find the expected value (mean) of X. x 1 2
39.2. The Normal Approximation to the Binomial Distribution. Introduction. Prerequisites. Learning Outcomes
 The Normal Approximation to the Binomial Distribution 39.2 Introduction We have already seen that the Poisson distribution can be used to approximate the binomial distribution for large values of n and
Sample Questions for Mastery #5
 Name: Class: Date: Sample Questions for Mastery #5 Multiple Choice Identify the choice that best completes the statement or answers the question.. For which of the following binomial experiments could
Exploratory Data Analysis
 Exploratory Data Analysis Johannes Schauer [email protected] Institute of Statistics Graz University of Technology Steyrergasse 17/IV, 8010 Graz www.statistics.tugraz.at February 12, 2008 Introduction
The normal approximation to the binomial
 The normal approximation to the binomial In order for a continuous distribution (like the normal) to be used to approximate a discrete one (like the binomial), a continuity correction should be used. There
ACMS 10140 Section 02 Elements of Statistics October 28, 2010 Midterm Examination II Answers
 ACMS 10140 Section 02 Elements of Statistics October 28, 2010 Midterm Examination II Answers Name DO NOT remove this answer page. DO turn in the entire exam. Make sure that you have all ten (10) pages
12.5: CHI-SQUARE GOODNESS OF FIT TESTS
 125: Chi-Square Goodness of Fit Tests CD12-1 125: CHI-SQUARE GOODNESS OF FIT TESTS In this section, the χ 2 distribution is used for testing the goodness of fit of a set of data to a specific probability
ECON1003: Analysis of Economic Data Fall 2003 Answers to Quiz #2 11:40a.m. 12:25p.m. (45 minutes) Tuesday, October 28, 2003
 Tuesday, October 28, 2003") ECON1003: Analysis of Economic Data Fall 2003 Answers to Quiz #2 11:40a.m. 12:25p.m. (45 minutes) Tuesday, October 28, 2003 1. (4 points) The number of claims for missing baggage for a well-known airline
ECON1003: Analysis of Economic Data Fall 2003 Answers to Quiz #2 11:40a.m. 12:25p.m. (45 minutes) Tuesday, October 28, 2003 1. (4 points) The number of claims for missing baggage for a well-known airline
Chapter 4. Probability and Probability Distributions
 Chapter 4. robability and robability Distributions Importance of Knowing robability To know whether a sample is not identical to the population from which it was selected, it is necessary to assess the
Characteristics of Binomial Distributions
 Lesson2 Characteristics of Binomial Distributions In the last lesson, you constructed several binomial distributions, observed their shapes, and estimated their means and standard deviations. In Investigation
6 PROBABILITY GENERATING FUNCTIONS
 6 PROBABILITY GENERATING FUNCTIONS Certain derivations presented in this course have been somewhat heavy on algebra. For example, determining the expectation of the Binomial distribution (page 5.1 turned
MULTIPLE CHOICE. Choose the one alternative that best completes the statement or answers the question.
 MULTIPLE CHOICE. Choose the one alternative that best completes the statement or answers the question. 1) If two events are mutually exclusive, what is the probability that one or the other occurs? A)
8. THE NORMAL DISTRIBUTION
 8. THE NORMAL DISTRIBUTION The normal distribution with mean μ and variance σ 2 has the following density function: The normal distribution is sometimes called a Gaussian Distribution, after its inventor,
Question: What is the probability that a five-card poker hand contains a flush, that is, five cards of the same suit?
 ECS20 Discrete Mathematics Quarter: Spring 2007 Instructor: John Steinberger Assistant: Sophie Engle (prepared by Sophie Engle) Homework 8 Hints Due Wednesday June 6 th 2007 Section 6.1 #16 What is the
Business Statistics, 9e (Groebner/Shannon/Fry) Chapter 5 Discrete Probability Distributions
 Chapter 5 Discrete Probability Distributions") Business Statistics, 9e (Groebner/Shannon/Fry) Chapter 5 Discrete Probability Distributions 1) A random variable is generated when a variableʹs value is determined by using classical probability. Answer:
Business Statistics, 9e (Groebner/Shannon/Fry) Chapter 5 Discrete Probability Distributions 1) A random variable is generated when a variableʹs value is determined by using classical probability. Answer:
Unit 4 The Bernoulli and Binomial Distributions
 PubHlth 540 4. Bernoulli and Binomial Page 1 of 19 Unit 4 The Bernoulli and Binomial Distributions Topic 1. Review What is a Discrete Probability Distribution... 2. Statistical Expectation.. 3. The Population
STAT 35A HW2 Solutions
 STAT 35A HW2 Solutions http://www.stat.ucla.edu/~dinov/courses_students.dir/09/spring/stat35.dir 1. A computer consulting firm presently has bids out on three projects. Let A i = { awarded project i },
BINOMIAL DISTRIBUTION
 MODULE IV BINOMIAL DISTRIBUTION A random variable X is said to follow binomial distribution with parameters n & p if P ( X ) = nc x p x q n x where x = 0, 1,2,3..n, p is the probability of success & q
Chapter 4. iclicker Question 4.4 Pre-lecture. Part 2. Binomial Distribution. J.C. Wang. iclicker Question 4.4 Pre-lecture
 Chapter 4 Part 2. Binomial Distribution J.C. Wang iclicker Question 4.4 Pre-lecture iclicker Question 4.4 Pre-lecture Outline Computing Binomial Probabilities Properties of a Binomial Distribution Computing
Normal Approximation. Contents. 1 Normal Approximation. 1.1 Introduction. Anthony Tanbakuchi Department of Mathematics Pima Community College
 Introductory Statistics Lectures Normal Approimation To the binomial distribution Department of Mathematics Pima Community College Redistribution of this material is prohibited without written permission
Chapter 5. Discrete Probability Distributions
 Chapter 5. Discrete Probability Distributions Chapter Problem: Did Mendel s result from plant hybridization experiments contradicts his theory? 1. Mendel s theory says that when there are two inheritable
Probability Calculator
 Chapter 95 Introduction Most statisticians have a set of probability tables that they refer to in doing their statistical wor. This procedure provides you with a set of electronic statistical tables that
Probability and Statistics Prof. Dr. Somesh Kumar Department of Mathematics Indian Institute of Technology, Kharagpur
 Probability and Statistics Prof. Dr. Somesh Kumar Department of Mathematics Indian Institute of Technology, Kharagpur Module No. #01 Lecture No. #15 Special Distributions-VI Today, I am going to introduce
Binomial Distribution Problems. Binomial Distribution SOLUTIONS. Poisson Distribution Problems
 1 Binomial Distribution Problems (1) A company owns 400 laptops. Each laptop has an 8% probability of not working. You randomly select 20 laptops for your salespeople. (a) What is the likelihood that 5
Chapter 9 Monté Carlo Simulation
 MGS 3100 Business Analysis Chapter 9 Monté Carlo What Is? A model/process used to duplicate or mimic the real system Types of Models Physical simulation Computer simulation When to Use (Computer) Models?
MAT 155. Key Concept. September 27, 2010. 155S5.5_3 Poisson Probability Distributions. Chapter 5 Probability Distributions
 MAT 155 Dr. Claude Moore Cape Fear Community College Chapter 5 Probability Distributions 5 1 Review and Preview 5 2 Random Variables 5 3 Binomial Probability Distributions 5 4 Mean, Variance and Standard
Notes on Continuous Random Variables
 Notes on Continuous Random Variables Continuous random variables are random quantities that are measured on a continuous scale. They can usually take on any value over some interval, which distinguishes
6.2. Discrete Probability Distributions
 6.2. Discrete Probability Distributions Discrete Uniform distribution (diskreetti tasajakauma) A random variable X follows the dicrete uniform distribution on the interval [a, a+1,..., b], if it may attain
IEOR 6711: Stochastic Models I Fall 2012, Professor Whitt, Tuesday, September 11 Normal Approximations and the Central Limit Theorem
 IEOR 6711: Stochastic Models I Fall 2012, Professor Whitt, Tuesday, September 11 Normal Approximations and the Central Limit Theorem Time on my hands: Coin tosses. Problem Formulation: Suppose that I have
Descriptive Statistics and Measurement Scales
 Descriptive Statistics 1 Descriptive Statistics and Measurement Scales Descriptive statistics are used to describe the basic features of the data in a study. They provide simple summaries about the sample
99.37, 99.38, 99.38, 99.39, 99.39, 99.39, 99.39, 99.40, 99.41, 99.42 cm
 Error Analysis and the Gaussian Distribution In experimental science theory lives or dies based on the results of experimental evidence and thus the analysis of this evidence is a critical part of the
You flip a fair coin four times, what is the probability that you obtain three heads.
 Handout 4: Binomial Distribution Reading Assignment: Chapter 5 In the previous handout, we looked at continuous random variables and calculating probabilities and percentiles for those type of variables.
University of California, Los Angeles Department of Statistics. Random variables
 University of California, Los Angeles Department of Statistics Statistics Instructor: Nicolas Christou Random variables Discrete random variables. Continuous random variables. Discrete random variables.
Math 461 Fall 2006 Test 2 Solutions
 Math 461 Fall 2006 Test 2 Solutions Total points: 100. Do all questions. Explain all answers. No notes, books, or electronic devices. 1. [105+5 points] Assume X Exponential(λ). Justify the following two
6.4 Normal Distribution
 Contents 6.4 Normal Distribution....................... 381 6.4.1 Characteristics of the Normal Distribution....... 381 6.4.2 The Standardized Normal Distribution......... 385 6.4.3 Meaning of Areas under
MBA 611 STATISTICS AND QUANTITATIVE METHODS
 MBA 611 STATISTICS AND QUANTITATIVE METHODS Part I. Review of Basic Statistics (Chapters 1-11) A. Introduction (Chapter 1) Uncertainty: Decisions are often based on incomplete information from uncertain
Probability Distributions
 CHAPTER 5 Probability Distributions CHAPTER OUTLINE 5.1 Probability Distribution of a Discrete Random Variable 5.2 Mean and Standard Deviation of a Probability Distribution 5.3 The Binomial Distribution
Lecture 2: Discrete Distributions, Normal Distributions. Chapter 1
 Lecture 2: Discrete Distributions, Normal Distributions Chapter 1 Reminders Course website: www. stat.purdue.edu/~xuanyaoh/stat350 Office Hour: Mon 3:30-4:30, Wed 4-5 Bring a calculator, and copy Tables
CA200 Quantitative Analysis for Business Decisions. File name: CA200_Section_04A_StatisticsIntroduction
 CA200 Quantitative Analysis for Business Decisions File name: CA200_Section_04A_StatisticsIntroduction Table of Contents 4. Introduction to Statistics... 1 4.1 Overview... 3 4.2 Discrete or continuous
Stats on the TI 83 and TI 84 Calculator
 Stats on the TI 83 and TI 84 Calculator Entering the sample values STAT button Left bracket { Right bracket } Store (STO) List L1 Comma Enter Example: Sample data are {5, 10, 15, 20} 1. Press 2 ND and
Probability Distributions
 CHAPTER 6 Probability Distributions Calculator Note 6A: Computing Expected Value, Variance, and Standard Deviation from a Probability Distribution Table Using Lists to Compute Expected Value, Variance,
Means, standard deviations and. and standard errors
 CHAPTER 4 Means, standard deviations and standard errors 4.1 Introduction Change of units 4.2 Mean, median and mode Coefficient of variation 4.3 Measures of variation 4.4 Calculating the mean and standard
Introduction to the Practice of Statistics Fifth Edition Moore, McCabe Section 4.4 Homework
 Introduction to the Practice of Statistics Fifth Edition Moore, McCabe Section 4.4 Homework 4.65 You buy a hot stock for $1000. The stock either gains 30% or loses 25% each day, each with probability.
Some special discrete probability distributions
 University of California, Los Angeles Department of Statistics Statistics 100A Instructor: Nicolas Christou Some special discrete probability distributions Bernoulli random variable: It is a variable that
Probability Distributions
 Learning Objectives Probability Distributions Section 1: How Can We Summarize Possible Outcomes and Their Probabilities? 1. Random variable 2. Probability distributions for discrete random variables 3.
The Math. P (x) = 5! = 1 2 3 4 5 = 120.
 = 5! = 1 2 3 4 5 = 120.") The Math Suppose there are n experiments, and the probability that someone gets the right answer on any given experiment is p. So in the first example above, n = 5 and p = 0.2. Let X be the number of correct
The Math Suppose there are n experiments, and the probability that someone gets the right answer on any given experiment is p. So in the first example above, n = 5 and p = 0.2. Let X be the number of correct
STAT 3502. x 0 < x < 1
 Solution - Assignment # STAT 350 Total mark=100 1. A large industrial firm purchases several new word processors at the end of each year, the exact number depending on the frequency of repairs in the previous
The Binomial Distribution
 The Binomial Distribution James H. Steiger November 10, 00 1 Topics for this Module 1. The Binomial Process. The Binomial Random Variable. The Binomial Distribution (a) Computing the Binomial pdf (b) Computing
Section 5 Part 2. Probability Distributions for Discrete Random Variables
 Section 5 Part 2 Probability Distributions for Discrete Random Variables Review and Overview So far we ve covered the following probability and probability distribution topics Probability rules Probability
3.4. The Binomial Probability Distribution. Copyright Cengage Learning. All rights reserved.
 3.4 The Binomial Probability Distribution Copyright Cengage Learning. All rights reserved. The Binomial Probability Distribution There are many experiments that conform either exactly or approximately
AP STATISTICS 2010 SCORING GUIDELINES
 2010 SCORING GUIDELINES Question 4 Intent of Question The primary goals of this question were to (1) assess students ability to calculate an expected value and a standard deviation; (2) recognize the applicability
Solutions for Review Problems for Exam 2 Math 1040 1 1. You roll two fair dice. (a) Draw a tree diagram for this experiment.
 Draw a tree diagram for this experiment.") Solutions for Review Problems for Exam 2 Math 1040 1 1. You roll two fair dice. (a) Draw a tree diagram for this experiment. 1 2 3 4 5 6 1 2 3 4 5 6 1 2 3 4 5 6 1 2 3 4 5 6 1 2 3 4 5 6 1 2 3 4 5 6 1 2
Solutions for Review Problems for Exam 2 Math 1040 1 1. You roll two fair dice. (a) Draw a tree diagram for this experiment. 1 2 3 4 5 6 1 2 3 4 5 6 1 2 3 4 5 6 1 2 3 4 5 6 1 2 3 4 5 6 1 2 3 4 5 6 1 2
Chapter 4 & 5 practice set. The actual exam is not multiple choice nor does it contain like questions.
 Chapter 4 & 5 practice set. The actual exam is not multiple choice nor does it contain like questions. MULTIPLE CHOICE. Choose the one alternative that best completes the statement or answers the question.
Binomial random variables (Review)
") Poisson / Empirical Rule Approximations / Hypergeometric Solutions STAT-UB.3 Statistics for Business Control and Regression Models Binomial random variables (Review. Suppose that you are rolling a die
Poisson / Empirical Rule Approximations / Hypergeometric Solutions STAT-UB.3 Statistics for Business Control and Regression Models Binomial random variables (Review. Suppose that you are rolling a die
Summary of Formulas and Concepts. Descriptive Statistics (Ch. 1-4)
") Summary of Formulas and Concepts Descriptive Statistics (Ch. 1-4) Definitions Population: The complete set of numerical information on a particular quantity in which an investigator is interested. We assume
Summary of Formulas and Concepts Descriptive Statistics (Ch. 1-4) Definitions Population: The complete set of numerical information on a particular quantity in which an investigator is interested. We assume
MA 1125 Lecture 14 - Expected Values. Friday, February 28, 2014. Objectives: Introduce expected values.
 MA 5 Lecture 4 - Expected Values Friday, February 2, 24. Objectives: Introduce expected values.. Means, Variances, and Standard Deviations of Probability Distributions Two classes ago, we computed the
STATISTICS 8: CHAPTERS 7 TO 10, SAMPLE MULTIPLE CHOICE QUESTIONS
 STATISTICS 8: CHAPTERS 7 TO 10, SAMPLE MULTIPLE CHOICE QUESTIONS 1. If two events (both with probability greater than 0) are mutually exclusive, then: A. They also must be independent. B. They also could
Biostatistics: DESCRIPTIVE STATISTICS: 2, VARIABILITY
 Biostatistics: DESCRIPTIVE STATISTICS: 2, VARIABILITY 1. Introduction Besides arriving at an appropriate expression of an average or consensus value for observations of a population, it is important to
STAT 315: HOW TO CHOOSE A DISTRIBUTION FOR A RANDOM VARIABLE
 STAT 315: HOW TO CHOOSE A DISTRIBUTION FOR A RANDOM VARIABLE TROY BUTLER 1. Random variables and distributions We are often presented with descriptions of problems involving some level of uncertainty about
Lecture 8. Confidence intervals and the central limit theorem
 Lecture 8. Confidence intervals and the central limit theorem Mathematical Statistics and Discrete Mathematics November 25th, 2015 1 / 15 Central limit theorem Let X 1, X 2,... X n be a random sample of
X: 0 1 2 3 4 5 6 7 8 9 Probability: 0.061 0.154 0.228 0.229 0.173 0.094 0.041 0.015 0.004 0.001
 Tuesday, January 17: 6.1 Discrete Random Variables Read 341 344 What is a random variable? Give some examples. What is a probability distribution? What is a discrete random variable? Give some examples.
5/31/2013. 6.1 Normal Distributions. Normal Distributions. Chapter 6. Distribution. The Normal Distribution. Outline. Objectives.
 The Normal Distribution C H 6A P T E R The Normal Distribution Outline 6 1 6 2 Applications of the Normal Distribution 6 3 The Central Limit Theorem 6 4 The Normal Approximation to the Binomial Distribution
Probability and Statistics Vocabulary List (Definitions for Middle School Teachers)
") Probability and Statistics Vocabulary List (Definitions for Middle School Teachers) B Bar graph a diagram representing the frequency distribution for nominal or discrete data. It consists of a sequence
Probability and Statistics Vocabulary List (Definitions for Middle School Teachers) B Bar graph a diagram representing the frequency distribution for nominal or discrete data. It consists of a sequence
ECE302 Spring 2006 HW4 Solutions February 6, 2006 1
 ECE302 Spring 2006 HW4 Solutions February 6, 2006 1 Solutions to HW4 Note: Most of these solutions were generated by R. D. Yates and D. J. Goodman, the authors of our textbook. I have added comments in
Simple Random Sampling
 Source: Frerichs, R.R. Rapid Surveys (unpublished), 2008. NOT FOR COMMERCIAL DISTRIBUTION 3 Simple Random Sampling 3.1 INTRODUCTION Everyone mentions simple random sampling, but few use this method for
APPLICATIONS AND MODELING WITH QUADRATIC EQUATIONS
 APPLICATIONS AND MODELING WITH QUADRATIC EQUATIONS Now that we are starting to feel comfortable with the factoring process, the question becomes what do we use factoring to do? There are a variety of classic
Statistics and Random Variables. Math 425 Introduction to Probability Lecture 14. Finite valued Random Variables. Expectation defined
 Expectation Statistics and Random Variables Math 425 Introduction to Probability Lecture 4 Kenneth Harris [email protected] Department of Mathematics University of Michigan February 9, 2009 When a large
THE BINOMIAL DISTRIBUTION & PROBABILITY
 REVISION SHEET STATISTICS 1 (MEI) THE BINOMIAL DISTRIBUTION & PROBABILITY The main ideas in this chapter are Probabilities based on selecting or arranging objects Probabilities based on the binomial distribution
Thursday, November 13: 6.1 Discrete Random Variables
 Thursday, November 13: 6.1 Discrete Random Variables Read 347 350 What is a random variable? Give some examples. What is a probability distribution? What is a discrete random variable? Give some examples.
Math 370/408, Spring 2008 Prof. A.J. Hildebrand. Actuarial Exam Practice Problem Set 2 Solutions
 Math 70/408, Spring 2008 Prof. A.J. Hildebrand Actuarial Exam Practice Problem Set 2 Solutions About this problem set: These are problems from Course /P actuarial exams that I have collected over the years,
Math 202-0 Quizzes Winter 2009
 Quiz : Basic Probability Ten Scrabble tiles are placed in a bag Four of the tiles have the letter printed on them, and there are two tiles each with the letters B, C and D on them (a) Suppose one tile
MULTIPLE CHOICE. Choose the one alternative that best completes the statement or answers the question. A) 0.4987 B) 0.9987 C) 0.0010 D) 0.
 0.4987 B) 0.9987 C) 0.0010 D) 0.") Ch. 5 Normal Probability Distributions 5.1 Introduction to Normal Distributions and the Standard Normal Distribution 1 Find Areas Under the Standard Normal Curve 1) Find the area under the standard normal
Ch. 5 Normal Probability Distributions 5.1 Introduction to Normal Distributions and the Standard Normal Distribution 1 Find Areas Under the Standard Normal Curve 1) Find the area under the standard normal
Chapter 3 RANDOM VARIATE GENERATION
 Chapter 3 RANDOM VARIATE GENERATION In order to do a Monte Carlo simulation either by hand or by computer, techniques must be developed for generating values of random variables having known distributions.