Lecture 5: Measures of Center and Variability for Distributions (Population); Quartiles, Boxplots for Data (Sample) Chapter 2
|
|
|
- Dominick Woods
- 7 years ago
- Views:
Transcription
1 Lecture 5: Measures of Center and Variability for Distributions (Population); Quartiles, Boxplots for Data (Sample) Chapter 2
2 2.1 Measures of Center (Distributions) Mean for continuous distributions Let f(x) be the density function for a continuous random variable X, then the mean of X is: µ X x f ( x) = dx Mean for discrete distributions Let p(x) be the mass function for a continuous random variable X, then the mean of X is: µ X = x p(x)
3 Examples Means Continuous distributions Normal (µ,σ) µ Exponential (λ) 1/ λ Uniform (a, b) (a+b)/2 Discrete distributions Binomial (n, π) nπ Poisson (λ) λ
4 Example 1 Find the mean value of a variable x with density function: f(x) = 1.5(1-x^2), 0<x<1 = 0, o.w. What s the median of X distribution?
5 Example - Medians Median for continuous distributions Let f(x) be the density function for a continuous random variable X, then the median of X is whatever value which satisfies: ~ µ f ( x) dx = 0. 5 What is the median of a Normal Distribution? If a continuous distribution is perfectly symmetric, mean = median. No median for discrete distributions.
6 2.2 Measures of Variability (Distributions) Variance for continuous distributions Let f(x) be the density function for a continuous random variable X, then the variance of X is: σ ( ) 2 2 X x µ X f ( x) = dx Variance for discrete distributions Let p(x) be the mass function for a continuous random variable X, then the variance of X is: σ X ( x ) 2 σ X = µ p( x) - Standard deviation of X, is square root of the 2 variance σ X X 2
7 Examples Variances Continuous distributions Normal (µ,σ) σ 2 Exponential (λ) 1/ λ 2 Uniform (a, b) (b a) 2 /12 Discrete distributions Binomial (n, π) nπ(1 π) Poisson (λ) λ Self-reading: empirical rule ( rule) in the middle of Pg 76, unbiasedness on top of Pg 77
8 Example 2 What s the standard deviation of X from Example 1?
9 2.3 Other measures Quartiles The median is the midpoint of the data (Sample) Quartiles break the data into quarters 1 st Quartile (Q1) = lower quartile = 25 th percentile 2 nd Quartile = median = 50 th percentile 3 rd Quartile (Q3) = upper quartile = 75 th percentile How to find the quartiles? They are just medians of the two halves of the data Interquartile Range (or IQR) = Q3 Q1 Self reading: Percentiles, Pg 85
10 Example Scores for 10 students are: Find the median and quartiles: 1. Median= Q2 = M = (82+83)/2 = Q1 = Median of the lower half, i.e , = Q3 = Median of the upper half, i.e , = 85 Therefore, IQR = Q3 Q1 = = 5 Additionally, find Min and Max Min = 78, and Max = 87 We get a five-number summary! Min Q1 Median Q3 Max
11 Boxplots; Modified Version Visual representation of the five-number summary Central box: Q1 to Q3 Line inside box: Median Extended straight lines: from each end of the box to lowest and highest observation. Modified Boxplots: only extend the lines to the smallest and largest observations that are not outliers. Each mild outlier* is represented by a closed circle and each extreme outlier** by an open circle. *Any observation farther than 1.5 IQR from the closest quartile is an outlier. **An outlier is extreme if more than 3 IQR from the nearest quartile, and is mild otherwise.
12 Example Five-number summary is: Min: 78 Q1: 80 Median: 82.5 Q3: 85 Max: 87 Draw a boxplot:
13 More on Boxplots Much more compact than histograms Quick and Dirty visual picture Gives rough idea on how data is distributed Shows center/typical value (the median); Position of median line indicates symmetric/not symmetric, positively/negatively skewed. IQR gives the middle 50% Min to Max gives the entire range Side-by-side boxplots very useful for comparisons See from slide 10
14 Describe a Boxplot Symmetric? if not, positively or negatively skewed (based on median line) Outliers? Based on 1.5IQR rule (and 3IQR rule for extreme outliers) Overall range : = Max - Min; IQR : = Central box s range; Similar procedure for side-by-side comparison
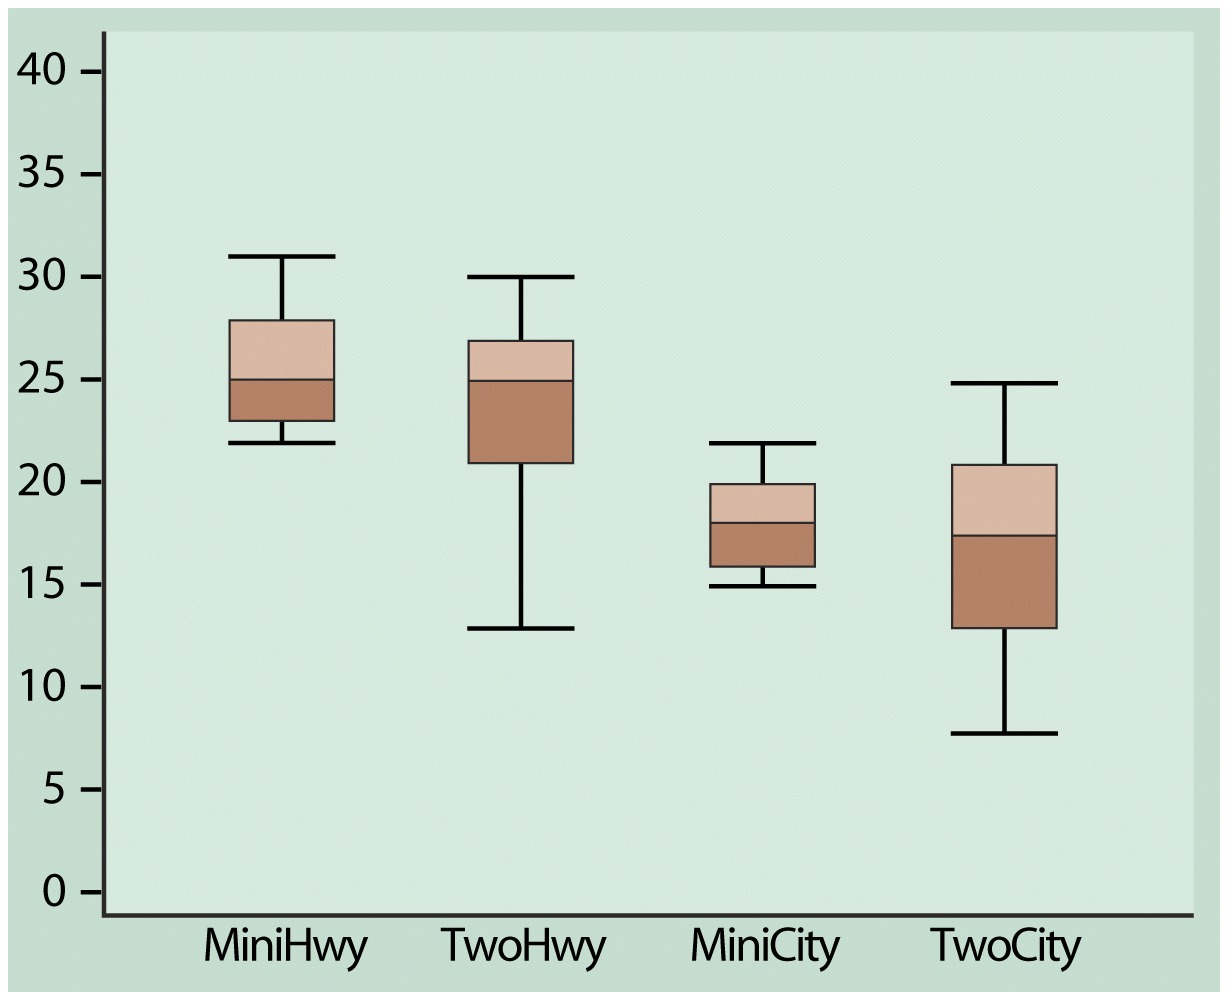
15 Examples--MPG
16 After Class Review sections 2.1 and 2.2, especially Pg 63 68, Review section 2.3, self-reading Pg95 Read section 2.4 and 5.1 Hw#2, due by 5pm, next Monday Start Lab#2 now, you don t want to wait till the last minute of next Thursday pm
BNG 202 Biomechanics Lab. Descriptive statistics and probability distributions I
 BNG 202 Biomechanics Lab Descriptive statistics and probability distributions I Overview The overall goal of this short course in statistics is to provide an introduction to descriptive and inferential
1.3 Measuring Center & Spread, The Five Number Summary & Boxplots. Describing Quantitative Data with Numbers
 1.3 Measuring Center & Spread, The Five Number Summary & Boxplots Describing Quantitative Data with Numbers 1.3 I can n Calculate and interpret measures of center (mean, median) in context. n Calculate
Center: Finding the Median. Median. Spread: Home on the Range. Center: Finding the Median (cont.)
") Center: Finding the Median When we think of a typical value, we usually look for the center of the distribution. For a unimodal, symmetric distribution, it s easy to find the center it s just the center
Center: Finding the Median When we think of a typical value, we usually look for the center of the distribution. For a unimodal, symmetric distribution, it s easy to find the center it s just the center
Lecture 1: Review and Exploratory Data Analysis (EDA)
") Lecture 1: Review and Exploratory Data Analysis (EDA) Sandy Eckel seckel@jhsph.edu Department of Biostatistics, The Johns Hopkins University, Baltimore USA 21 April 2008 1 / 40 Course Information I Course
Lecture 1: Review and Exploratory Data Analysis (EDA) Sandy Eckel seckel@jhsph.edu Department of Biostatistics, The Johns Hopkins University, Baltimore USA 21 April 2008 1 / 40 Course Information I Course
Lecture 2: Descriptive Statistics and Exploratory Data Analysis
 Lecture 2: Descriptive Statistics and Exploratory Data Analysis Further Thoughts on Experimental Design 16 Individuals (8 each from two populations) with replicates Pop 1 Pop 2 Randomly sample 4 individuals
Exploratory Data Analysis
 Exploratory Data Analysis Johannes Schauer johannes.schauer@tugraz.at Institute of Statistics Graz University of Technology Steyrergasse 17/IV, 8010 Graz www.statistics.tugraz.at February 12, 2008 Introduction
Exploratory data analysis (Chapter 2) Fall 2011
 Fall 2011") Exploratory data analysis (Chapter 2) Fall 2011 Data Examples Example 1: Survey Data 1 Data collected from a Stat 371 class in Fall 2005 2 They answered questions about their: gender, major, year in school,
Exploratory data analysis (Chapter 2) Fall 2011 Data Examples Example 1: Survey Data 1 Data collected from a Stat 371 class in Fall 2005 2 They answered questions about their: gender, major, year in school,
a. mean b. interquartile range c. range d. median
 3. Since 4. The HOMEWORK 3 Due: Feb.3 1. A set of data are put in numerical order, and a statistic is calculated that divides the data set into two equal parts with one part below it and the other part
STATS8: Introduction to Biostatistics. Data Exploration. Babak Shahbaba Department of Statistics, UCI
 STATS8: Introduction to Biostatistics Data Exploration Babak Shahbaba Department of Statistics, UCI Introduction After clearly defining the scientific problem, selecting a set of representative members
3: Summary Statistics
 3: Summary Statistics Notation Let s start by introducing some notation. Consider the following small data set: 4 5 30 50 8 7 4 5 The symbol n represents the sample size (n = 0). The capital letter X denotes
Variables. Exploratory Data Analysis
 Exploratory Data Analysis Exploratory Data Analysis involves both graphical displays of data and numerical summaries of data. A common situation is for a data set to be represented as a matrix. There is
EXAM #1 (Example) Instructor: Ela Jackiewicz. Relax and good luck!
 Instructor: Ela Jackiewicz. Relax and good luck!") STP 231 EXAM #1 (Example) Instructor: Ela Jackiewicz Honor Statement: I have neither given nor received information regarding this exam, and I will not do so until all exams have been graded and returned.
STP 231 EXAM #1 (Example) Instructor: Ela Jackiewicz Honor Statement: I have neither given nor received information regarding this exam, and I will not do so until all exams have been graded and returned.
Biostatistics: DESCRIPTIVE STATISTICS: 2, VARIABILITY
 Biostatistics: DESCRIPTIVE STATISTICS: 2, VARIABILITY 1. Introduction Besides arriving at an appropriate expression of an average or consensus value for observations of a population, it is important to
Geostatistics Exploratory Analysis
 Instituto Superior de Estatística e Gestão de Informação Universidade Nova de Lisboa Master of Science in Geospatial Technologies Geostatistics Exploratory Analysis Carlos Alberto Felgueiras cfelgueiras@isegi.unl.pt
consider the number of math classes taken by math 150 students. how can we represent the results in one number?
 ch 3: numerically summarizing data - center, spread, shape 3.1 measure of central tendency or, give me one number that represents all the data consider the number of math classes taken by math 150 students.
Mean = (sum of the values / the number of the value) if probabilities are equal
 if probabilities are equal") Population Mean Mean = (sum of the values / the number of the value) if probabilities are equal Compute the population mean Population/Sample mean: 1. Collect the data 2. sum all the values in the population/sample.
Population Mean Mean = (sum of the values / the number of the value) if probabilities are equal Compute the population mean Population/Sample mean: 1. Collect the data 2. sum all the values in the population/sample.
Introduction to Statistics for Psychology. Quantitative Methods for Human Sciences
 Introduction to Statistics for Psychology and Quantitative Methods for Human Sciences Jonathan Marchini Course Information There is website devoted to the course at http://www.stats.ox.ac.uk/ marchini/phs.html
BASIC STATISTICAL METHODS FOR GENOMIC DATA ANALYSIS
 BASIC STATISTICAL METHODS FOR GENOMIC DATA ANALYSIS SEEMA JAGGI Indian Agricultural Statistics Research Institute Library Avenue, New Delhi-110 012 seema@iasri.res.in Genomics A genome is an organism s
Chapter 1: Looking at Data Section 1.1: Displaying Distributions with Graphs
 Types of Variables Chapter 1: Looking at Data Section 1.1: Displaying Distributions with Graphs Quantitative (numerical)variables: take numerical values for which arithmetic operations make sense (addition/averaging)
First Midterm Exam (MATH1070 Spring 2012)
") First Midterm Exam (MATH1070 Spring 2012) Instructions: This is a one hour exam. You can use a notecard. Calculators are allowed, but other electronics are prohibited. 1. [40pts] Multiple Choice Problems
First Midterm Exam (MATH1070 Spring 2012) Instructions: This is a one hour exam. You can use a notecard. Calculators are allowed, but other electronics are prohibited. 1. [40pts] Multiple Choice Problems
Descriptive statistics Statistical inference statistical inference, statistical induction and inferential statistics
 Descriptive statistics is the discipline of quantitatively describing the main features of a collection of data. Descriptive statistics are distinguished from inferential statistics (or inductive statistics),
Descriptive Statistics. Purpose of descriptive statistics Frequency distributions Measures of central tendency Measures of dispersion
 Descriptive Statistics Purpose of descriptive statistics Frequency distributions Measures of central tendency Measures of dispersion Statistics as a Tool for LIS Research Importance of statistics in research
Final Exam Practice Problem Answers
 Final Exam Practice Problem Answers The following data set consists of data gathered from 77 popular breakfast cereals. The variables in the data set are as follows: Brand: The brand name of the cereal
Exercise 1.12 (Pg. 22-23)
") Individuals: The objects that are described by a set of data. They may be people, animals, things, etc. (Also referred to as Cases or Records) Variables: The characteristics recorded about each individual.
Individuals: The objects that are described by a set of data. They may be people, animals, things, etc. (Also referred to as Cases or Records) Variables: The characteristics recorded about each individual.
Data Exploration Data Visualization
 Data Exploration Data Visualization What is data exploration? A preliminary exploration of the data to better understand its characteristics. Key motivations of data exploration include Helping to select
Module 4: Data Exploration
 Module 4: Data Exploration Now that you have your data downloaded from the Streams Project database, the detective work can begin! Before computing any advanced statistics, we will first use descriptive
Section 1.3 Exercises (Solutions)
") Section 1.3 Exercises (s) 1.109, 1.110, 1.111, 1.114*, 1.115, 1.119*, 1.122, 1.125, 1.127*, 1.128*, 1.131*, 1.133*, 1.135*, 1.137*, 1.139*, 1.145*, 1.146-148. 1.109 Sketch some normal curves. (a) Sketch
Section 1.3 Exercises (s) 1.109, 1.110, 1.111, 1.114*, 1.115, 1.119*, 1.122, 1.125, 1.127*, 1.128*, 1.131*, 1.133*, 1.135*, 1.137*, 1.139*, 1.145*, 1.146-148. 1.109 Sketch some normal curves. (a) Sketch
Bellwork Students will review their study guide for their test. Box-and-Whisker Plots will be discussed after the test.
 Course: 7 th Grade Math Student Objective (Obj. 5c) TSW graph and interpret data in a box-and-whisker plot. DETAIL LESSON PLAN Friday, March 23 / Monday, March 26 Lesson 1-10 Box-and-Whisker Plot (Textbook
Lecture 2. Summarizing the Sample
 Lecture 2 Summarizing the Sample WARNING: Today s lecture may bore some of you It s (sort of) not my fault I m required to teach you about what we re going to cover today. I ll try to make it as exciting
Notes on Continuous Random Variables
 Notes on Continuous Random Variables Continuous random variables are random quantities that are measured on a continuous scale. They can usually take on any value over some interval, which distinguishes
Lecture 2: Discrete Distributions, Normal Distributions. Chapter 1
 Lecture 2: Discrete Distributions, Normal Distributions Chapter 1 Reminders Course website: www. stat.purdue.edu/~xuanyaoh/stat350 Office Hour: Mon 3:30-4:30, Wed 4-5 Bring a calculator, and copy Tables
UNIVERSITY OF TORONTO SCARBOROUGH Department of Computer and Mathematical Sciences Midterm Test March 2014
 UNIVERSITY OF TORONTO SCARBOROUGH Department of Computer and Mathematical Sciences Midterm Test March 2014 STAB22H3 Statistics I Duration: 1 hour and 45 minutes Last Name: First Name: Student number: Aids
Topic 9 ~ Measures of Spread
 AP Statistics Topic 9 ~ Measures of Spread Activity 9 : Baseball Lineups The table to the right contains data on the ages of the two teams involved in game of the 200 National League Division Series. Is
WEEK #22: PDFs and CDFs, Measures of Center and Spread
 WEEK #22: PDFs and CDFs, Measures of Center and Spread Goals: Explore the effect of independent events in probability calculations. Present a number of ways to represent probability distributions. Textbook
Probability and Statistics Prof. Dr. Somesh Kumar Department of Mathematics Indian Institute of Technology, Kharagpur
 Probability and Statistics Prof. Dr. Somesh Kumar Department of Mathematics Indian Institute of Technology, Kharagpur Module No. #01 Lecture No. #15 Special Distributions-VI Today, I am going to introduce
The right edge of the box is the third quartile, Q 3, which is the median of the data values above the median. Maximum Median
 CONDENSED LESSON 2.1 Box Plots In this lesson you will create and interpret box plots for sets of data use the interquartile range (IQR) to identify potential outliers and graph them on a modified box
Why Taking This Course? Course Introduction, Descriptive Statistics and Data Visualization. Learning Goals. GENOME 560, Spring 2012
 Why Taking This Course? Course Introduction, Descriptive Statistics and Data Visualization GENOME 560, Spring 2012 Data are interesting because they help us understand the world Genomics: Massive Amounts
Chapter 1: Exploring Data
 Chapter 1: Exploring Data Chapter 1 Review 1. As part of survey of college students a researcher is interested in the variable class standing. She records a 1 if the student is a freshman, a 2 if the student
Business Statistics. Successful completion of Introductory and/or Intermediate Algebra courses is recommended before taking Business Statistics.
 Business Course Text Bowerman, Bruce L., Richard T. O'Connell, J. B. Orris, and Dawn C. Porter. Essentials of Business, 2nd edition, McGraw-Hill/Irwin, 2008, ISBN: 978-0-07-331988-9. Required Computing
A Correlation of. to the. South Carolina Data Analysis and Probability Standards
 A Correlation of to the South Carolina Data Analysis and Probability Standards INTRODUCTION This document demonstrates how Stats in Your World 2012 meets the indicators of the South Carolina Academic Standards
9.1 Measures of Center and Spread
 Name Class Date 9.1 Measures of Center and Spread Essential Question: How can you describe and compare data sets? Explore Exploring Data Resource Locker Caleb and Kim have bowled three games. Their scores
Introduction to Environmental Statistics. The Big Picture. Populations and Samples. Sample Data. Examples of sample data
 A Few Sources for Data Examples Used Introduction to Environmental Statistics Professor Jessica Utts University of California, Irvine jutts@uci.edu 1. Statistical Methods in Water Resources by D.R. Helsel
7 CONTINUOUS PROBABILITY DISTRIBUTIONS
 7 CONTINUOUS PROBABILITY DISTRIBUTIONS Chapter 7 Continuous Probability Distributions Objectives After studying this chapter you should understand the use of continuous probability distributions and the
5/31/2013. 6.1 Normal Distributions. Normal Distributions. Chapter 6. Distribution. The Normal Distribution. Outline. Objectives.
 The Normal Distribution C H 6A P T E R The Normal Distribution Outline 6 1 6 2 Applications of the Normal Distribution 6 3 The Central Limit Theorem 6 4 The Normal Approximation to the Binomial Distribution
2. Filling Data Gaps, Data validation & Descriptive Statistics
 2. Filling Data Gaps, Data validation & Descriptive Statistics Dr. Prasad Modak Background Data collected from field may suffer from these problems Data may contain gaps ( = no readings during this period)
Descriptive Statistics
 Y520 Robert S Michael Goal: Learn to calculate indicators and construct graphs that summarize and describe a large quantity of values. Using the textbook readings and other resources listed on the web
Descriptive Statistics: Summary Statistics
 Tutorial for the integration of the software R with introductory statistics Copyright Grethe Hystad Chapter 2 Descriptive Statistics: Summary Statistics In this chapter we will discuss the following topics:
STT315 Chapter 4 Random Variables & Probability Distributions KM. Chapter 4.5, 6, 8 Probability Distributions for Continuous Random Variables
 Chapter 4.5, 6, 8 Probability Distributions for Continuous Random Variables Discrete vs. continuous random variables Examples of continuous distributions o Uniform o Exponential o Normal Recall: A random
Continuous Random Variables
 Chapter 5 Continuous Random Variables 5.1 Continuous Random Variables 1 5.1.1 Student Learning Objectives By the end of this chapter, the student should be able to: Recognize and understand continuous
Foundation of Quantitative Data Analysis
 Foundation of Quantitative Data Analysis Part 1: Data manipulation and descriptive statistics with SPSS/Excel HSRS #10 - October 17, 2013 Reference : A. Aczel, Complete Business Statistics. Chapters 1
Institute of Actuaries of India Subject CT3 Probability and Mathematical Statistics
 Institute of Actuaries of India Subject CT3 Probability and Mathematical Statistics For 2015 Examinations Aim The aim of the Probability and Mathematical Statistics subject is to provide a grounding in
HISTOGRAMS, CUMULATIVE FREQUENCY AND BOX PLOTS
 Mathematics Revision Guides Histograms, Cumulative Frequency and Box Plots Page 1 of 25 M.K. HOME TUITION Mathematics Revision Guides Level: GCSE Higher Tier HISTOGRAMS, CUMULATIVE FREQUENCY AND BOX PLOTS
Summary of Formulas and Concepts. Descriptive Statistics (Ch. 1-4)
") Summary of Formulas and Concepts Descriptive Statistics (Ch. 1-4) Definitions Population: The complete set of numerical information on a particular quantity in which an investigator is interested. We assume
Summary of Formulas and Concepts Descriptive Statistics (Ch. 1-4) Definitions Population: The complete set of numerical information on a particular quantity in which an investigator is interested. We assume
2. Here is a small part of a data set that describes the fuel economy (in miles per gallon) of 2006 model motor vehicles.
 of 2006 model motor vehicles.") Math 1530-017 Exam 1 February 19, 2009 Name Student Number E There are five possible responses to each of the following multiple choice questions. There is only on BEST answer. Be sure to read all possible
Math 1530-017 Exam 1 February 19, 2009 Name Student Number E There are five possible responses to each of the following multiple choice questions. There is only on BEST answer. Be sure to read all possible
Exploratory Data Analysis. Psychology 3256
 Exploratory Data Analysis Psychology 3256 1 Introduction If you are going to find out anything about a data set you must first understand the data Basically getting a feel for you numbers Easier to find
Math 425 (Fall 08) Solutions Midterm 2 November 6, 2008
 Solutions Midterm 2 November 6, 2008") Math 425 (Fall 8) Solutions Midterm 2 November 6, 28 (5 pts) Compute E[X] and Var[X] for i) X a random variable that takes the values, 2, 3 with probabilities.2,.5,.3; ii) X a random variable with the
Math 425 (Fall 8) Solutions Midterm 2 November 6, 28 (5 pts) Compute E[X] and Var[X] for i) X a random variable that takes the values, 2, 3 with probabilities.2,.5,.3; ii) X a random variable with the
Statistics I for QBIC. Contents and Objectives. Chapters 1 7. Revised: August 2013
 Statistics I for QBIC Text Book: Biostatistics, 10 th edition, by Daniel & Cross Contents and Objectives Chapters 1 7 Revised: August 2013 Chapter 1: Nature of Statistics (sections 1.1-1.6) Objectives
AP Statistics Solutions to Packet 2
 AP Statistics Solutions to Packet 2 The Normal Distributions Density Curves and the Normal Distribution Standard Normal Calculations HW #9 1, 2, 4, 6-8 2.1 DENSITY CURVES (a) Sketch a density curve that
THE BINOMIAL DISTRIBUTION & PROBABILITY
 REVISION SHEET STATISTICS 1 (MEI) THE BINOMIAL DISTRIBUTION & PROBABILITY The main ideas in this chapter are Probabilities based on selecting or arranging objects Probabilities based on the binomial distribution
Density Curve. A density curve is the graph of a continuous probability distribution. It must satisfy the following properties:
 Density Curve A density curve is the graph of a continuous probability distribution. It must satisfy the following properties: 1. The total area under the curve must equal 1. 2. Every point on the curve
STAT355 - Probability & Statistics
 STAT355 - Probability & Statistics Instructor: Kofi Placid Adragni Fall 2011 Chap 1 - Overview and Descriptive Statistics 1.1 Populations, Samples, and Processes 1.2 Pictorial and Tabular Methods in Descriptive
DESCRIPTIVE STATISTICS. The purpose of statistics is to condense raw data to make it easier to answer specific questions; test hypotheses.
 DESCRIPTIVE STATISTICS The purpose of statistics is to condense raw data to make it easier to answer specific questions; test hypotheses. DESCRIPTIVE VS. INFERENTIAL STATISTICS Descriptive To organize,
International College of Economics and Finance Syllabus Probability Theory and Introductory Statistics
 International College of Economics and Finance Syllabus Probability Theory and Introductory Statistics Lecturer: Mikhail Zhitlukhin. 1. Course description Probability Theory and Introductory Statistics
CA200 Quantitative Analysis for Business Decisions. File name: CA200_Section_04A_StatisticsIntroduction
 CA200 Quantitative Analysis for Business Decisions File name: CA200_Section_04A_StatisticsIntroduction Table of Contents 4. Introduction to Statistics... 1 4.1 Overview... 3 4.2 Discrete or continuous
Name: Date: Use the following to answer questions 2-3:
 Name: Date: 1. A study is conducted on students taking a statistics class. Several variables are recorded in the survey. Identify each variable as categorical or quantitative. A) Type of car the student
Dongfeng Li. Autumn 2010
 Autumn 2010 Chapter Contents Some statistics background; ; Comparing means and proportions; variance. Students should master the basic concepts, descriptive statistics measures and graphs, basic hypothesis
Course Text. Required Computing Software. Course Description. Course Objectives. StraighterLine. Business Statistics
 Course Text Business Statistics Lind, Douglas A., Marchal, William A. and Samuel A. Wathen. Basic Statistics for Business and Economics, 7th edition, McGraw-Hill/Irwin, 2010, ISBN: 9780077384470 [This
Week 1. Exploratory Data Analysis
 Week 1 Exploratory Data Analysis Practicalities This course ST903 has students from both the MSc in Financial Mathematics and the MSc in Statistics. Two lectures and one seminar/tutorial per week. Exam
List of Examples. Examples 319
 Examples 319 List of Examples DiMaggio and Mantle. 6 Weed seeds. 6, 23, 37, 38 Vole reproduction. 7, 24, 37 Wooly bear caterpillar cocoons. 7 Homophone confusion and Alzheimer s disease. 8 Gear tooth strength.
Definition: Suppose that two random variables, either continuous or discrete, X and Y have joint density
 HW MATH 461/561 Lecture Notes 15 1 Definition: Suppose that two random variables, either continuous or discrete, X and Y have joint density and marginal densities f(x, y), (x, y) Λ X,Y f X (x), x Λ X,
Important Probability Distributions OPRE 6301
 Important Probability Distributions OPRE 6301 Important Distributions... Certain probability distributions occur with such regularity in real-life applications that they have been given their own names.
+ Chapter 1 Exploring Data
 Chapter 1 Exploring Data Introduction: Data Analysis: Making Sense of Data 1.1 Analyzing Categorical Data 1.2 Displaying Quantitative Data with Graphs 1.3 Describing Quantitative Data with Numbers Introduction
Lecture 7: Continuous Random Variables
 Lecture 7: Continuous Random Variables 21 September 2005 1 Our First Continuous Random Variable The back of the lecture hall is roughly 10 meters across. Suppose it were exactly 10 meters, and consider
AP * Statistics Review. Descriptive Statistics
 AP * Statistics Review Descriptive Statistics Teacher Packet Advanced Placement and AP are registered trademark of the College Entrance Examination Board. The College Board was not involved in the production
Data Modeling & Analysis Techniques. Probability & Statistics. Manfred Huber 2011 1
 Data Modeling & Analysis Techniques Probability & Statistics Manfred Huber 2011 1 Probability and Statistics Probability and statistics are often used interchangeably but are different, related fields
UNIT I: RANDOM VARIABLES PART- A -TWO MARKS
 UNIT I: RANDOM VARIABLES PART- A -TWO MARKS 1. Given the probability density function of a continuous random variable X as follows f(x) = 6x (1-x) 0
Random Variables. Chapter 2. Random Variables 1
 Random Variables Chapter 2 Random Variables 1 Roulette and Random Variables A Roulette wheel has 38 pockets. 18 of them are red and 18 are black; these are numbered from 1 to 36. The two remaining pockets
VISUALIZATION OF DENSITY FUNCTIONS WITH GEOGEBRA
 VISUALIZATION OF DENSITY FUNCTIONS WITH GEOGEBRA Csilla Csendes University of Miskolc, Hungary Department of Applied Mathematics ICAM 2010 Probability density functions A random variable X has density
Probability and Statistics Vocabulary List (Definitions for Middle School Teachers)
") Probability and Statistics Vocabulary List (Definitions for Middle School Teachers) B Bar graph a diagram representing the frequency distribution for nominal or discrete data. It consists of a sequence
Probability and Statistics Vocabulary List (Definitions for Middle School Teachers) B Bar graph a diagram representing the frequency distribution for nominal or discrete data. It consists of a sequence
1.5 Oneway Analysis of Variance
 Statistics: Rosie Cornish. 200. 1.5 Oneway Analysis of Variance 1 Introduction Oneway analysis of variance (ANOVA) is used to compare several means. This method is often used in scientific or medical experiments
How To Write A Data Analysis
 Mathematics Probability and Statistics Curriculum Guide Revised 2010 This page is intentionally left blank. Introduction The Mathematics Curriculum Guide serves as a guide for teachers when planning instruction
Chapter 5 Discrete Probability Distribution. Learning objectives
 Chapter 5 Discrete Probability Distribution Slide 1 Learning objectives 1. Understand random variables and probability distributions. 1.1. Distinguish discrete and continuous random variables. 2. Able
CHAPTER 6: Continuous Uniform Distribution: 6.1. Definition: The density function of the continuous random variable X on the interval [A, B] is.
![CHAPTER 6: Continuous Uniform Distribution: 6.1. Definition: The density function of the continuous random variable X on the interval [A, B] is.](/thumbs/40/21160284.jpg "CHAPTER 6: Continuous Uniform Distribution: 6.1. Definition: The density function of the continuous random variable X on the interval [A, B] is.") Some Continuous Probability Distributions CHAPTER 6: Continuous Uniform Distribution: 6. Definition: The density function of the continuous random variable X on the interval [A, B] is B A A x B f(x; A,
Some Continuous Probability Distributions CHAPTER 6: Continuous Uniform Distribution: 6. Definition: The density function of the continuous random variable X on the interval [A, B] is B A A x B f(x; A,
Shape of Data Distributions
 Lesson 13 Main Idea Describe a data distribution by its center, spread, and overall shape. Relate the choice of center and spread to the shape of the distribution. New Vocabulary distribution symmetric
How Far is too Far? Statistical Outlier Detection
 How Far is too Far? Statistical Outlier Detection Steven Walfish President, Statistical Outsourcing Services steven@statisticaloutsourcingservices.com 30-325-329 Outline What is an Outlier, and Why are
Sampling and Descriptive Statistics
 Sampling and Descriptive Statistics Berlin Chen Department of Computer Science & Information Engineering National Taiwan Normal University Reference: 1. W. Navidi. Statistics for Engineering and Scientists.
Ch. 3.1 # 3, 4, 7, 30, 31, 32
 Math Elementary Statistics: A Brief Version, 5/e Bluman Ch. 3. # 3, 4,, 30, 3, 3 Find (a) the mean, (b) the median, (c) the mode, and (d) the midrange. 3) High Temperatures The reported high temperatures
Algebra I Vocabulary Cards
 Algebra I Vocabulary Cards Table of Contents Expressions and Operations Natural Numbers Whole Numbers Integers Rational Numbers Irrational Numbers Real Numbers Absolute Value Order of Operations Expression
Week 3&4: Z tables and the Sampling Distribution of X
 Week 3&4: Z tables and the Sampling Distribution of X 2 / 36 The Standard Normal Distribution, or Z Distribution, is the distribution of a random variable, Z N(0, 1 2 ). The distribution of any other normal
Lecture 6: Discrete & Continuous Probability and Random Variables
 Lecture 6: Discrete & Continuous Probability and Random Variables D. Alex Hughes Math Camp September 17, 2015 D. Alex Hughes (Math Camp) Lecture 6: Discrete & Continuous Probability and Random September
16. THE NORMAL APPROXIMATION TO THE BINOMIAL DISTRIBUTION
 6. THE NORMAL APPROXIMATION TO THE BINOMIAL DISTRIBUTION It is sometimes difficult to directly compute probabilities for a binomial (n, p) random variable, X. We need a different table for each value of
Understanding, Identifying & Analyzing Box & Whisker Plots
 Understanding, Identifying & Analyzing Box & Whisker Plots CCSS: 6.SP.4, 8.SP.1 VA SOLs: A.10 Box and Whisker Plots Lower Extreme Lower Quartile Median Upper Quartile Upper Extreme The inter quartile range
Classify the data as either discrete or continuous. 2) An athlete runs 100 meters in 10.5 seconds. 2) A) Discrete B) Continuous
 An athlete runs 100 meters in 10.5 seconds. 2) A) Discrete B) Continuous") Chapter 2 Overview Name MULTIPLE CHOICE. Choose the one alternative that best completes the statement or answers the question. Classify as categorical or qualitative data. 1) A survey of autos parked in
Chapter 2 Overview Name MULTIPLE CHOICE. Choose the one alternative that best completes the statement or answers the question. Classify as categorical or qualitative data. 1) A survey of autos parked in
CALCULATIONS & STATISTICS
 CALCULATIONS & STATISTICS CALCULATION OF SCORES Conversion of 1-5 scale to 0-100 scores When you look at your report, you will notice that the scores are reported on a 0-100 scale, even though respondents
1 Descriptive statistics: mode, mean and median
 1 Descriptive statistics: mode, mean and median Statistics and Linguistic Applications Hale February 5, 2008 It s hard to understand data if you have to look at it all. Descriptive statistics are things
Data Mining: Exploring Data. Lecture Notes for Chapter 3. Slides by Tan, Steinbach, Kumar adapted by Michael Hahsler
 Data Mining: Exploring Data Lecture Notes for Chapter 3 Slides by Tan, Steinbach, Kumar adapted by Michael Hahsler Topics Exploratory Data Analysis Summary Statistics Visualization What is data exploration?
MBA 611 STATISTICS AND QUANTITATIVE METHODS
 MBA 611 STATISTICS AND QUANTITATIVE METHODS Part I. Review of Basic Statistics (Chapters 1-11) A. Introduction (Chapter 1) Uncertainty: Decisions are often based on incomplete information from uncertain
STAT 350 Practice Final Exam Solution (Spring 2015)
") PART 1: Multiple Choice Questions: 1) A study was conducted to compare five different training programs for improving endurance. Forty subjects were randomly divided into five groups of eight subjects
PART 1: Multiple Choice Questions: 1) A study was conducted to compare five different training programs for improving endurance. Forty subjects were randomly divided into five groups of eight subjects
Mind on Statistics. Chapter 2
 Mind on Statistics Chapter 2 Sections 2.1 2.3 1. Tallies and cross-tabulations are used to summarize which of these variable types? A. Quantitative B. Mathematical C. Continuous D. Categorical 2. The table
2WB05 Simulation Lecture 8: Generating random variables
 2WB05 Simulation Lecture 8: Generating random variables Marko Boon http://www.win.tue.nl/courses/2wb05 January 7, 2013 Outline 2/36 1. How do we generate random variables? 2. Fitting distributions Generating