Who s Who in Index 2?
|
|
|
- Augustus Lane
- 9 years ago
- Views:
Transcription
1
2 Who s Who in Index 2? To receive a progress measure in Index 2 a student must meet ALL of the following criteria within the same content area: Have a valid score from the prior year and current year. Have tested in successive grade levels or EOC tests in prior year and current year. Have taken the same version/type of test in the prior year and current year. Have taken tests in the same language in the prior year and current year.

3 Who s Who? Ten Student Groups: All Students Students served by Special Education ELL Seven Racial/Ethnic Groups: African American American Indian Asian Hispanic Pacific Islander White Two or More Races

4 Who s Not Included? LEP students that tested English test versions. (ELL Progress Measure coming for 2014) Asylees/refugees excluded ELL tested on Spanish test versions Year 1 through Year 3 Asylees/refugees Year 1 through Year 5 3rd grade students Any student that does not meet one or more of the criteria. A student could meet the criteria in one content area but not another.

5 What Subjects? Reading/ELA Mathematics Writing (English II) Evaluated Separately
")
6 Minimum Size? All Students: at least 10 test results. Student Groups: at least for the group. 25 test results

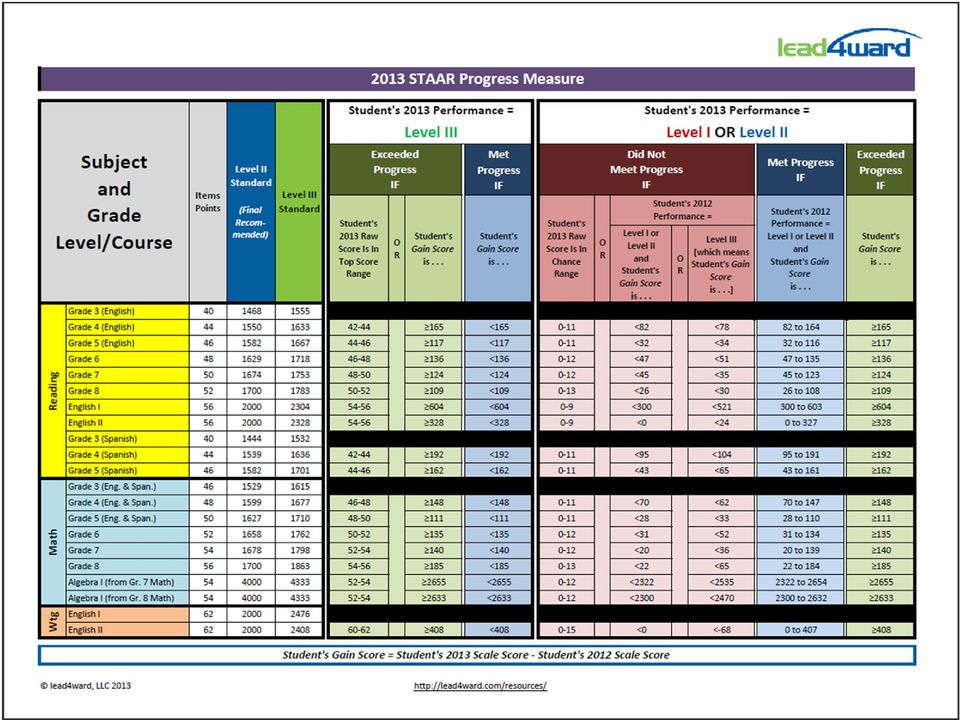
7 Met Progress: Performance Level I OR Level II The distance between the final recommended performance standards from the prior year and the current year in the same content area. Goal students in Level II will maintain at least Level II Example: Final Level II 4th grade math = 1599 Final Level II 5th grade math = = 28 point gain to receive Met OR Level III Advanced = distance between Level III standards = Met (Applies to students if their performance on 2012 = Level III Advanced and then their performance in 2013 was Level III Standard 4th grade math = 1677 Level III Standard 5th grade math = = 33 point gain to receive Met Level III performance to Level II performance between years will most likely result in a Not Met Note Grades 3-8 are built on a vertical scale; EOCs are built on a horizontal scale which could result in progress targets being a zero or negative.

8 For each % of tests at the Met Growth Expectation Level

9 Exceeded Progress: Performance Level I or II Demonstrated significant growth: beyond that of the Met target. Defined as: distance between Level II standard in the prior year and Level III standard in the current year Example: Final Level II 4th grade math = 1599 Level III Advanced 5th grade math = = 111 points Students at performance levels I or II would need to show 111 points in order to receive an Exceeded Progress.

10 1 Point for Met + 1 Point for Exceeded = 2 points for each % at the Exceeded Growth Expectation Level

11 Student Performance = Level I OR Level II Final Level II 4 th grade math = 1599 Final Level II 5 th grade math = = 28 point gain Final Level II 4 th grade math = 1599 Level III Advanced 5 th grade math = = 111 points Students at performance levels I or II would need to show 111 points in order to receive an Exceeded Progress.

12 Exceptions All students scoring at the three highest raw scores in the current year will be classified as Exceeded. Students who maintained Level III Advanced performance from the prior year to the current year will be classified as Met or Exceeded. Students scoring below chance in the current year will be classified as Did Not Meet.

13
14 How is the progress measure useful to teachers and administrators? Provides additional information by communicating how much the student has improved from the prior year to the current year. Provides a more complete picture of the student s achievement. Allows campuses and districts to receive credit within Index 2, for students who have yet to achieve Level II Performance and pass the test.

15 STAAR Progress Measures Index 2 Accountability O 6 Scenarios 1. Passed the test Met Growth 2. Passed the test Exceeded Growth 3. Passed the test Did Not Meet Growth 4. Failed the test Met Growth 5. Failed the test Exceeded Growth 6. Failed the test Did Not Meet Growth

16 STAAR Progress Measures Index 2 Accountability O 6 Scenarios 1. Passed the test Met Growth 2. Passed the test Exceeded Growth 3. Passed the test Did Not Meet Growth 4. Failed the test Met Growth 5. Failed the test Exceeded Growth 6. Failed the test Did Not Meet Growth

17
18 Step 1: Progress toward Satisfactory Performance How are students and student groups making progress and gains toward Satisfactory Performance from one year to the next? Consider the following: Review minimum size requirements for each student group. (All students 10 tests; Student Groups 25 tests). You have to know which students you are targeting. Analyze students meeting and not meeting Satisfactory Performance Level. Evaluate student groups by core academic subjects: reading, math, and writing (English I English II). Analyze Index 1 data, trends, and patterns to identify barriers.

19 Step 2: Possible Data Sources All STAAR tests prior and current year scale scores by core academic subject.

20 Possible Data Sources Did Not Meet Expected Growth, Met or Exceeded Expected Growth student groups. 200 possible points 200 possible points 400 max points

21 Possible Data Sources
22 Possible Data Sources Elementary Target = 30 Middle School Target = 29 High School = 17
23 Possible Data Sources Programs and Services for students who did not meet, met, exceeded growth/progress. Reporting categories and student expectations by core academic subject Item analysis and curriculum review
24 Groups to Consider O 6 Scenarios 1. Passed the test Met Growth 2. Passed the test Exceeded Growth 3. Passed the test Did Not Meet Growth 4. Failed the test Met Growth 5. Failed the test Exceeded Growth 6. Failed the test Did Not Meet Growth
25 Questions to consider: Which students and student groups: 1. Did Not Meet growth expectations? Why? 2. Met growth expectations? Why? 3. Exceeded growth expectations? Why?
26 Questions to Consider What does the data reveal about the students in each of the growth categories? What does the data indicate when compared within and across the core academic subjects? What do teacher, grade level, department, subject, and campus data indicate? What is the scale score growth? (Vertical scale grades 3-8) For students and student groups that did not meet growth expectation, what do the reporting categories and student expectations indicate? Where are the strengths and weaknesses?
27
28
29 The search feature will allow you to answer: 1. Which students and student groups did not meet, met, or exceeded growth expectations?
30 These tabs unfold like blinds. Click on the ones you want to select information from and then click search.
31 Current Campus: Those students CURRENTLY on your campus. Some of these students MAY NOT have counted in your accountability subsets.
32 Administration Campus: Those students who took a test on your campus. Some of these students MAY NOT have counted in your accountability subsets.
33 Accountability Those students who were Snapshot students. Present on your campus on snapshot day, present on the day of testing.
34 Accountability Choose one Campus: Current, Administration, or Fall You can do a search for each scenario: 1. Did Not Pass - Met Growth 2. Did Not Pass - Exceeded Growth 3. Did Not Pass - Did Not Meet Growth 4. Passed - Met Growth 5. Passed Exceeded Growth 6. Passed - Did Not Meet Growth
35 Accountability Choose one Campus: Current, Administration, or Fall You can do a search for each scenario: 1. Did Not Pass - Met Growth 2. Did Not Pass - Exceeded Growth 3. Did Not Pass - Did Not Meet Growth 4. Passed - Met Growth 5. Passed Exceeded Growth 6. Passed - Did Not Meet Growth
36
37 1. Delete unneeded columns. 2. Click on arrow box above row 1 to the left of column A. 3. Then click on Sort and Filter 4. Custom Sort This spreadsheet shows: Passers Did Not Meet Growth 5. Choose the column to sort 6. Sort by values, order: largest to smallest. 7. Then the spreadsheet can be color coded. 8. Guiding Question: Would these students show up on your intervention list?
38 This spreadsheet shows: Passers Did Not Meet Growth 1. Delete unneeded columns. You can answer: What is the scale score growth? Use lead4ward s chart to help you know how close the student was to meeting growth. 2. Click on arrow box above row 1 to the left of column A. 3. Then click on Sort and Filter 4. Custom Sort 5. Choose the column to sort 6. Sort by values, order: largest to smallest. 7. Then the spreadsheet can be color coded. 8. Guiding Question: Would these students show up on your intervention list?
39
40 1. Delete unneeded columns. 2. Click on arrow box above row 1 to the left of column A. 3. Then click on Sort and Filter 4. Custom Sort This spreadsheet shows: Passers Did Not Meet Growth 5. Choose the column to sort 6. Sort by values, order: largest to smallest. 7. Then the spreadsheet can be color coded. 8. Guiding Question: Would these students show up on your intervention list? Next step: run a search on Did Not Pass Did Not Meet Growth and generate a new spreadsheet.
41 For students that Did Not Meet growth, what do the reporting categories and student expectations indicate? For each scenario of Not Met (Passed and Did Not Pass): Using the same search criteria, click on Reports then Instructional Click on the search file tab in Instructional Reports Select the Year, Subject, Curriculum, and Test. You will see your search criteria from the previous screen has been imported into this current search. The file box with student names will only be those students that Passed the test Did Not Meet Growth or Did Not Pass Did Not Meet Growth (depending on your search query) Check the All Students box. Run the SE Tutorial Report. This report will tell you exactly which students are weak in which SEs. TEKS Scaffolding documents from lead4ward can be used for interventions with these students to close gaps and help support the TEK in the current grade level.
42 This is based on your search criteria The SE Tutorial report allows you to answer: What do the student expectations indicate? Where are the strengths and weaknesses?
43 Student names will appear here.
44
45 Allows teachers to see each item on the test and the corresponding Reporting Category/Student Expectation. This report can be useful now that we have the released tests available. This report gives what percent of students chose each answer choice. Teachers can see hot spots on the heat map. Those items in red are the highest level of concern. Teachers can look at the item on the released test, and then determine: If a large percentage of students are choosing the wrong answer, are they choosing the distractor choice? Teachers can use these reports to dig deeper into why students are missing the items that are hot spots on the heat map.
46 STAAR Progress Measures Index 2 Accountability O 6 Scenarios 1. Passed the test Met Growth 2. Passed the test Exceeded Growth 3. Passed the test Did Not Meet Growth 4. Failed the test Met Growth 5. Failed the test Exceeded Growth 6. Failed the test Did Not Meet Growth
47 Accountability After searching for those that met, run a different search on those that exceeded. This search can help you answer: What does the data reveal about the students that failed the test, but Met or Exceeded Growth? What interventions are taking place for these students that are working?
48 STAAR Progress Measures Index 2 Accountability O 6 Scenarios 1. Passed the test Met Growth 2. Passed the test Exceeded Growth 3. Passed the test Did Not Meet Growth 4. Failed the test Met Growth 5. Failed the test Exceeded Growth 6. Failed the test Did Not Meet Growth
49 What about progress toward Level III?
50 Accountability Identify the students that were Level II Performance that either met growth or exceeded growth. For these students/student groups, what do the reporting categories and student expectations indicate? Where are there strengths and weaknesses? The goal for these students should be to help them work towards achieving Level III Academic Performance. The more students you have at Level III, the more students you have receiving a Met or Exceeded Growth measure.
51 What about maintaining Level III?
52 Accountability Identify the students that were Level III Advanced Performance that either met growth or exceeded growth. For these students/student groups, what do the reporting categories and student expectations indicate? Where are there strengths and weaknesses? The goal for these students should be to maintain Level III Advanced Performance. Also run at Exceeded
53
54 Level II Satisfactory Performance/ Exceeded Growth: Goal: How can we push these students to Level III Advanced Performance? Level III Advanced Students: Goal: Maintain Level III Advanced Performance Passers that exceed the growth measure will have some SEs that may need attention. What gaps may occur in the current curriculum that may prevent them from continuing to be successful?
55 Skills Content SE Issues Procedural Conceptual Can t Read Processes Diagnostic Tools to know what skills in which they are deficient Test taking skills such as rushing; not completing the entire problem; choosing distractor choices
56
57
58
59 Shirley Clark Jennifer Nall
Texas Education Agency 2014 15 Federal Report Card for Texas Public Schools
 Part I: Student Achievement by Proficiency Level Texas Education Agency 2014 15 Federal Report Card for Texas Public Schools Campus Name: AIKIN EL Campus ID: 057916135 District Name: RICHARDSON ISD This
Texas Academic Performance Report (TAPR) 2013-14 Roosevelt ISD
 2013-14 Roosevelt ISD") Texas Academic Performance Report (TAPR) 213-14 Roosevelt ISD Presented to Board of Trustees on January 12, 215 District Responsibilities for TAPR in Statute Hearing for Public Discussion Must be held
Texas Academic Performance Report (TAPR) 213-14 Roosevelt ISD Presented to Board of Trustees on January 12, 215 District Responsibilities for TAPR in Statute Hearing for Public Discussion Must be held
Educator s Guide to Excel Graphing
 Educator s Guide to Excel Graphing Overview: Students will use Excel to enter data into a spreadsheet and make a graph. Grades and Subject Areas: Grade 3-6 Subject Math Objectives: Students will: make
Allen Elementary School
 Allen Elementary School April 4, 216 Dear Parents and Community Members: We are pleased to present you with the (AER), which provides key information on the 214-15 educational progress for the. The AER
District % of Students Met Standard (Proficient) and Commended (Advanced) State % of Students Met Standard (Proficient) and Commended (Advanced)
 and Commended (Advanced) State % of Students Met Standard (Proficient) and Commended (Advanced)") Texas 2012 NCLB Report Card Part I Preview C O N F I D E N T I A L 14 Part I - Campus Level: Student Performance for Each District Campus Compared to the State, Percent of, Student Achievement by Proficiency
Texas 2012 NCLB Report Card Part I Preview C O N F I D E N T I A L 14 Part I - Campus Level: Student Performance for Each District Campus Compared to the State, Percent of, Student Achievement by Proficiency
New York State Profile
 New York State Profile Jennifer Guinn EDUC 547 FALL 2008 According to 2006 U.S. Census estimates, with a total population of over 19 million people, 20 percent of New York State s population were foreign-born
Texas Education Agency 2013-14 Federal Report Card for Texas Public Schools State
 Texas Education Agency 2013-14 Federal Report Card for Texas Public Schools State Part I: Percent Tested and Student Achievement by Proficiency Level This section provides the State of Texas Assessments
ILLINOIS SCHOOL REPORT CARD
 17-2-15-2-24 Lincoln Elem Clinton CUSD 15 Clinton, ILLINOIS GRADES : 2 3 2 1 3 Lincoln Elem 1 ILLINOIS SCHOOL REPORT CARD and federal laws require public school districts to release report cards to the
How to Make the Most of Excel Spreadsheets
 How to Make the Most of Excel Spreadsheets Analyzing data is often easier when it s in an Excel spreadsheet rather than a PDF for example, you can filter to view just a particular grade, sort to view which
ARMT Longitudinal Data Analysis
 ARMT Use with Excel 2007 2011 ARMT Longitudinal Data Analysis School Improvement Team Alabama Department of Education Purpose: Why should we use longitudinal data? One year s data cannot pinpoint trends.
Brazos School for Inquiry and Creativity
 English as a Second Language (ESL) January 2013 It is the policy of the Brazos School for Inquiry and Creativity not to discriminate on the basis of race, color, national origin, sex or handicap in its
Tutorial 3. Maintaining and Querying a Database
 Tutorial 3 Maintaining and Querying a Database Microsoft Access 2010 Objectives Find, modify, and delete records in a table Learn how to use the Query window in Design view Create, run, and save queries
Microsoft Office 2010
 Access Tutorial 3 Maintaining and Querying a Database Microsoft Office 2010 Objectives Find, modify, and delete records in a table Learn how to use the Query window in Design view Create, run, and save
Staar 2014 Passing Scores Lead4ward
 Staar 2014 Passing Scores Free PDF ebook Download: Staar 2014 Passing Scores Download or Read Online ebook staar 2014 passing scores lead4ward in PDF Format From The Best User Guide Database Nov 18, 2013
Name: Phone Number: To be eligible for state funding, a student in the bilingual or ESL education program must meet the following requirements:
 Section 6 Bilingual/ as a Second Language (ESL) This section addresses unique provisions for bilingual and ESL education programs. These provisions must be applied in conjunction with the general rules
Comal ISD 2013-2014 Bilingual & ESL Program Evaluation. Where Excellence is an Attitude!
 Comal ISD 2013-2014 Bilingual & ESL Program Evaluation Texas Administrative Code Chapter 89. Adaptations for Special Populations Subchapter BB. Commissioner's Rules Concerning State Plan for Educating
Lead4ward 4th Grade Staar Scale Scores 2014
 4th Grade Staar Scale Scores 2014 Free PDF ebook Download: 4th Grade Staar Scale Scores 2014 Download or Read Online ebook lead4ward 4th grade staar scale scores 2014 in PDF Format From The Best User Guide
2013-14 Texas Academic Performance Report (TAPR) Greenville ISD. Danna Myers Chief Academic Officer January 2015
 Greenville ISD. Danna Myers Chief Academic Officer January 2015") 213-14 Texas Academic Performance Report (TAPR) Greenville ISD Danna Myers Chief Academic Officer January 215 1 214 TAPR Content District/Campus Performance STAAR Performance at Phase-in Satisfactory Standard
213-14 Texas Academic Performance Report (TAPR) Greenville ISD Danna Myers Chief Academic Officer January 215 1 214 TAPR Content District/Campus Performance STAAR Performance at Phase-in Satisfactory Standard
2014-15 Texas Academic Performance Report (TAPR) Ennis ISD
 Ennis ISD") 2014-15 Texas Academic Performance Report (TAPR) Ennis ISD Changes to this Year s Report STAAR Grades 3 8 Mathematics, STAAR A, and STAAR Alternate 2 (all grades and subjects) These results are excluded
2014-15 Texas Academic Performance Report (TAPR) Ennis ISD Changes to this Year s Report STAAR Grades 3 8 Mathematics, STAAR A, and STAAR Alternate 2 (all grades and subjects) These results are excluded
Teacher Dashboard User Guide. Instructional Support Systems
 Instructional Support Systems Teacher Dashboard User Guide Instructional Support Systems 1 Table of Contents A STUDENT A DAY... 3 HOW TO ACCESS THE INSTRUCTIONAL SUPPORT SYSTEM... 3 BRIEF HISTORY OF THE
Drawing a histogram using Excel
 Drawing a histogram using Excel STEP 1: Examine the data to decide how many class intervals you need and what the class boundaries should be. (In an assignment you may be told what class boundaries to
2014 Data Summit: Excellence! Its not an option It s the expectation.
 2014 Data Summit: Excellence! Its not an option It s the expectation. 2014 Expectations for Campus Data Rooms and Campus Data Teams Presented by: Theresa Urrabazo Executive Director of Accountability,
Bangor Central Elementary School 2014-2015 Annual Education Report
 Bangor Central Elementary School 24-25 Melissa Vrable; Principal March 23, 26 Dear Parents and Community Members: We are pleased to present you with the (AER) which provides key information on the 24 5
Quick Reference Guide Course Homepage Management (Faculty)
") Quick Reference Guide Course Homepage Management (Faculty) Table of Contents View Faculty Schedule... 3 Print Faculty Schedule... 3 Create Course Homepage... 3 Add a New Activity to the Course Homepage...
Quick Reference Guide Course Homepage Management (Faculty) Table of Contents View Faculty Schedule... 3 Print Faculty Schedule... 3 Create Course Homepage... 3 Add a New Activity to the Course Homepage...
In-Depth Guide Advanced Spreadsheet Techniques
 In-Depth Guide Advanced Spreadsheet Techniques Learning Objectives By reading and completing the activities in this chapter, you will be able to: Create PivotTables using Microsoft Excel Create scenarios
STAAR Assessment Management System User s Guide. STAAR Grades 3 8 and End-of-Course Assessments
 STAAR Assessment Management System User s Guide STAAR Grades 3 8 and End-of-Course Assessments March 2, 2016 Student Assessment Division Texas Education Agency 1701 N. Congress Avenue Austin, TX 78701-1494
BASIC TECHNIQUES IN USING EXCEL TO ANALYZE ASSESSMENT DATA
 1 BASIC TECHNIQUES IN USING EXCEL TO ANALYZE ASSESSMENT DATA University of Hawai i at Mānoa 11/15/12 2 Mission: Improve Student Learning Through Program Assessment 1 3 Workshop outcomes By the end of this
South Dakota DOE 2013-2014 Report Card
 School Classification: Focus Title I Designation: Schoolwide Performance Indicators * No bar will display at the school or district level if the subgroup does not meet minimum size for reporting purposes.
TEA UPDATE ON STAAR MATHEMATICS. Texas Education Agency Student Assessment Division Julie Guthrie July 2014
 TEA UPDATE ON STAAR MATHEMATICS Texas Education Agency Student Assessment Division Julie Guthrie July 2014 New STAAR Mathematics Information Implementation of New STAAR Mathematics General STAAR Updates
Reporting Student Progress and Achievement
 Reporting Student Progress and Achievement CompassLearning Odyssey Manager takes pride in the quality of its product content. However, technical inaccuracies, typographical errors, and editorial omissions
TCRWP AssessmentPro Data Specialist User Manual
 TCRWP AssessmentPro Data Specialist User Manual The Teachers College Reading and Writing Project welcomes you to TCRWP AssessmentPro, the web based data platform that supports our many reading assessments.
A. Grouping to Obtain Counts
 Revised 03/07/2011 Pasco STAR v4 Student Information Area: Working With Data Sets (Grouping, Filtering, and Exporting) Skills Discussed in this Document Are: Grouping, Filtering, and Exporting From Inside
School & District Data: Analysis Spreadsheets
 School & District Data: School & District Data: Hello, Idaho! I m Beth Klineman from Pearson Education. Welcome to Schoolnet s, accessed through the ISEE Portal. School & District Data reports come in
Module 9 Ad Hoc Queries
 Module 9 Ad Hoc Queries Objectives Familiarize the User with basic steps necessary to create ad hoc queries using the Data Browser. Topics Ad Hoc Queries Create a Data Browser query Filter data Save a
Microsoft Excel 2010 Training. Use Excel tables to manage information
 Microsoft Excel 2010 Training Use Excel tables to manage information Overview: Help with data management In this course, you ll learn how to manage information by using tables in Excel. Tables make it
Special Education Reporting November 5, 2015
 File Center link (Black menu bar) Special Education Reporting November 5, 2015 Dashboards The simplest way to view student demographics and special education student counts for fall PEIMS (as of the last
Directions for Using TIES 2.0 One-Clicks and the Grade Level Facilitators Excel Template
 Directions for Using TIES 2.0 One-Clicks and the Grade Level Facilitators Excel Template This set of directions assumes you know how to log in to the TIES website and open Excel. If you need support in
TRIO Wolf Creek distributed the AdvancED survey link to all students and parents in a variety of ways listed below:
 TRIO Wolf Creek Distance Learning Charter School Stakeholder Feedback Data Document TRIO Wolf Creek Distance Learning Charter School ensures that all AdvancED surveys were administered with fidelity using
Excel Database Management
 How to use AutoFill Whether you just want to copy the same value down or need to get a series of numbers or text values, fill handle in Excel is the feature to help. It's an irreplaceable part of the AutoFill
MicroStrategy Desktop
 MicroStrategy Desktop Quick Start Guide MicroStrategy Desktop is designed to enable business professionals like you to explore data, simply and without needing direct support from IT. 1 Import data from
Alaska Data Clean-Up and Validation for 2015-16
 Alaska Data Clean-Up and Validation for 2015-16 In preparation for Spring testing, everyone should take steps to validate and clean up data in Educator Portal. In most cases, the district Data Steward
66.1 59.9. District: LITTLESTOWN AREA SD AUN: 112015203 Test Date: PSSA Spring 2015. English Language Arts. Mathematics 46.8 39.7. Science 75.5 67.
 PENNSYLVANIA System of School Assessment (PSSA) Summary Report Dear Leader: This report provides you with information about your district's performance in English Language Arts, Mathematics, and Science
DATA COACHING WORKSHOP DAY 1 PRESENTED BY SARITA SIQUEIROS THORNBURG, JILL PATNODE & KRISSY SOLTMAN
 DATA COACHING WORKSHOP DAY 1 PRESENTED BY SARITA SIQUEIROS THORNBURG, JILL PATNODE & KRISSY SOLTMAN January 28, 2014 Success for Each Child and Eliminate the Opportunity Gap Welcome and Introductions Overview
Getting Started with Excel 2008. Table of Contents
 Table of Contents Elements of An Excel Document... 2 Resizing and Hiding Columns and Rows... 3 Using Panes to Create Spreadsheet Headers... 3 Using the AutoFill Command... 4 Using AutoFill for Sequences...
For Immediate Release: Thursday, July 19, 2012 Contact: Jim Polites 860.713.6525
 For Immediate Release: Thursday, July 19, 2012 Contact: Jim Polites 860.713.6525 2012 CMT, CAPT RESULTS SHOW SOME INCREASES, WHILE GAPS IN ACHIEVEMENT PERSIST The Connecticut State Department of Education
Tutorial 5: Summarizing Tabular Data Florida Case Study
 Tutorial 5: Summarizing Tabular Data Florida Case Study This tutorial will introduce you to the following: Identifying Attribute Data Sources for Health Data Converting Tabular Data into Usable Databases
Transcript: What Is Progress Monitoring?
 Transcript: What Is Progress Monitoring? Slide 1: Welcome to the webinar, What Is Progress Monitoring? This is one of 11 webinars developed by the National Center on Response to Intervention (NCRTI). This
Microsoft Excel 2010 Part 3: Advanced Excel
 CALIFORNIA STATE UNIVERSITY, LOS ANGELES INFORMATION TECHNOLOGY SERVICES Microsoft Excel 2010 Part 3: Advanced Excel Winter 2015, Version 1.0 Table of Contents Introduction...2 Sorting Data...2 Sorting
Middle Grades Action Kit How To Use the Survey Tools!
 How To Use the Survey Tools Get the most out of the surveys We have prepared two surveys one for principals and one for teachers that can support your district- or school-level conversations about improving
State of Texas Assessments of Academic Readiness. Parent & Student Information
 State of Texas Assessments of Academic Readiness Parent & Student Information January 17, 2013 1 Presentation Contents What is STAAR? STAAR vs. TAKS STAAR Assessment Structure Student Success Initiative
Summer 2015 Humble ISD Professional Development Plan Elementary Title Campuses
 In order to provide a comprehensive catalog of offerings to meet the diverse and unique needs of each of our employees, the following courses will be available to all Humble ISD employees this summer.
Data Dashboards Using Excel and MS Word. Dr. Rosemarie O Conner Gabriel Hartmann
 Data Dashboards Using Excel and MS Word Dr. Rosemarie O Conner Gabriel Hartmann Agenda Introduction to Dashboards Automation Process Demonstration 4 steps: 1. Design a dashboard 2. Create Word Template
AMERICA S High School Graduates
 U.S. Department of Education NCES 2011-462 AMERICA S High School Graduates results of the 2009 naep high school transcript study What is the High School Transcript Study? The High School Transcript Study
Microsoft. Access HOW TO GET STARTED WITH
 Microsoft Access HOW TO GET STARTED WITH 2015 The Continuing Education Center, Inc., d/b/a National Seminars Training. All rights reserved, including the right to reproduce this material or any part thereof
Access Tutorial 3 Maintaining and Querying a Database. Microsoft Office 2013 Enhanced
 Access Tutorial 3 Maintaining and Querying a Database Microsoft Office 2013 Enhanced Objectives Session 3.1 Find, modify, and delete records in a table Hide and unhide fields in a datasheet Work in the
Excel Pivot Tables. Blue Pecan Computer Training Ltd - Onsite Training Provider www.bluepecantraining.com :: 0800 6124105 :: [email protected].
 Excel Pivot Tables 1 Table of Contents Pivot Tables... 3 Preparing Data for a Pivot Table... 3 Creating a Dynamic Range for a Pivot Table... 3 Creating a Pivot Table... 4 Removing a Field... 5 Change the
Tutorial 3 Maintaining and Querying a Database
 Tutorial 3 Maintaining and Querying a Database Microsoft Access 2013 Objectives Session 3.1 Find, modify, and delete records in a table Hide and unhide fields in a datasheet Work in the Query window in
ILLINOIS SCHOOL REPORT CARD
 5-8-9-6- MASCOUTAH ELEM SCHOOL MASCOUTAH C U DISTRICT 9 MASCOUTAH, ILLINOIS GRADES : PK K 5 6 MASCOUTAH ELEM SCHOOL ILLINOIS SCHOOL REPORT CARD and federal laws require public school districts to release
Chapter 10 Federal Accountability
 Chapter 10 Federal Accountability Elementary and Secondary Education Act (ESEA) and No Child Left Behind (NCLB) The Elementary and Secondary Education Act (ESEA) was first passed by Congress in 1965 as
Creating a Gradebook in Excel
 Creating a Spreadsheet Gradebook 1 Creating a Gradebook in Excel Spreadsheets are a great tool for creating gradebooks. With a little bit of work, you can create a customized gradebook that will provide
This activity will show you how to draw graphs of algebraic functions in Excel.
 This activity will show you how to draw graphs of algebraic functions in Excel. Open a new Excel workbook. This is Excel in Office 2007. You may not have used this version before but it is very much the
SuccessMaker Learning Management System User s Guide Release 1.0
 SuccessMaker Learning Management System User s Guide Release 1.0 Copyright 2007 2008 Pearson Education, Inc. or its affiliates Copyright 2007 2008 Pearson Education, Inc. or its affiliates. All rights
Setting Up A Gradebook. Skyward Educator Access Plus Gradebook Home Page You can access your Gradebook from any computer with Internet access.
 Setting Up A Gradebook Skyward Educator Access Plus Gradebook Home Page You can access your Gradebook from any computer with Internet access. Do not use the x use the Exit button Always exit from the homepage
Wolf Point Public Schools Southside School Northside School Junior High School High School
 Wolf Point Public Schools Southside School Northside School Junior High School High School Wolf Point, Montana Districts 45 and 45A Report Card 2012-2013 School Year 1 BELIEVE -- ACHIEVE -- SUCCEED Mission
Guidelines for Creating Reports
 Guidelines for Creating Reports Contents Exercise 1: Custom Reporting - Ad hoc Reports... 1 Exercise 2: Custom Reporting - Ad Hoc Queries... 5 Exercise 3: Section Status Report.... 8 Exercise 1: Custom
Top 10 Excel Questions WHY A TECHTORIAL?
 Top 10 Excel Questions By Lorrie Jackson WHY A TECHTORIAL? What will I learn today? You will get answers to the 10 most common questions teachers ask about the spreadsheet program Microsoft Excel. What
TECHNICAL REPORT #33:
 TECHNICAL REPORT #33: Exploring the Use of Early Numeracy Indicators for Progress Monitoring: 2008-2009 Jeannette Olson and Anne Foegen RIPM Year 6: 2008 2009 Dates of Study: September 2008 May 2009 September
WORLD S BEST WORKFORCE PLAN
 WORLD S BEST WORKFORCE PLAN ANNUAL REPORT 2014 2015 School Year South Early Learning Center, North Intermediate, Saint Peter Middle/High School 1 Saint Peter Public Schools World s Best Workforce Report
Intellect Platform - Tables and Templates Basic Document Management System - A101
 Intellect Platform - Tables and Templates Basic Document Management System - A101 Interneer, Inc. 4/12/2010 Created by Erika Keresztyen 2 Tables and Templates - A101 - Basic Document Management System
Click on Faculty & Staff Then Staff Resources. Click on Kiosk
 Click on Faculty & Staff Then Staff Resources Click on Kiosk 1 Login For First Time Users without a password, you will want to click where the arrow is instructing you. When prompted, you must use your
Introduction: Online school report cards are not new in North Carolina. The North Carolina Department of Public Instruction (NCDPI) has been
 has been") Introduction: Online school report cards are not new in North Carolina. The North Carolina Department of Public Instruction (NCDPI) has been reporting ABCs results since 1996-97. In 2001, the state General
Introduction: Online school report cards are not new in North Carolina. The North Carolina Department of Public Instruction (NCDPI) has been reporting ABCs results since 1996-97. In 2001, the state General
Welcome to the topic on creating key performance indicators in SAP Business One, release 9.1 version for SAP HANA.
 Welcome to the topic on creating key performance indicators in SAP Business One, release 9.1 version for SAP HANA. 1 In this topic, you will learn how to: Use Key Performance Indicators (also known as
Completing Your Data File For Direct Online Enrollment
 Completing Your Data File For Direct Online Enrollment To begin using the Pro-Core (PC) assessment system, your students, teachers, and classes must be enrolled into the Pro-Core online system. We will
4 Key Recommendations to Eliminate Remediation:
 State of Delaware College Success Report: Class of 2014 Nearly 60 percent of Delaware high school graduates enroll in college each year. Most of these students attend local public and private institutions
Student Progress Center Instructions. 1. Navigating to the Student Progress Center. 2. Logging in to an Existing Account. 3. Creating a New Account
 Student Progress Center Instructions The Student Progress Center has a new look. Click on the links below for instructions on how to navigate to our website, create an account, and use the Student Progress
LSP 121. LSP 121 Math and Tech Literacy II. Simple Databases. Today s Topics. Database Class Schedule. Simple Databases
 Greg Brewster, DePaul University Page 1 LSP 121 Math and Tech Literacy II Greg Brewster DePaul University Today s Topics Elements of a Database Importing data from a spreadsheet into a database Sorting,
RELATIONSHIP BETWEEN THE PATTERN OF MATHEMATICS AND SCIENCE COURSES TAKEN AND TEST SCORES ON ITED FOR HIGH SCHOOL JUNIORS
 RELATIONSHIP BETWEEN THE PATTERN OF AND COURSES TAKEN AND TEST SCORES ON FOR HIGH SCHOOL JUNIORS Xiaoping Wang, Administrative Consultant Abstract Three years of student-level data were used in this study
40th Anniversary COSA Seaside Conference. June 19, 2014. Shanda Miller, MPA Wendy Kam, MBA Oregon Audits Division
 40th Anniversary COSA Seaside Conference June 19, 2014 Shanda Miller, MPA Wendy Kam, MBA Oregon Audits Division Overview Audit Scope and Methods State Achievement Gap Results School Achievement Gap Results
Ichabod Crane Elementary and Middle School AIS (Academic Intervention Support) Reading and Math Guidelines 2014-2015
 Reading and Math Guidelines 2014-2015") Ichabod Crane Elementary and Middle School AIS (Academic Intervention Support) Reading and Math Guidelines 2014-2015 AIS Reading and Math qualifications by grade level: Students will be recommended into
Ichabod Crane Elementary and Middle School AIS (Academic Intervention Support) Reading and Math Guidelines 2014-2015 AIS Reading and Math qualifications by grade level: Students will be recommended into
Microsoft Access Rollup Procedure for Microsoft Office 2007. 2. Click on Blank Database and name it something appropriate.
 Microsoft Access Rollup Procedure for Microsoft Office 2007 Note: You will need tax form information in an existing Excel spreadsheet prior to beginning this tutorial. 1. Start Microsoft access 2007. 2.
CREATING EXCEL PIVOT TABLES AND PIVOT CHARTS FOR LIBRARY QUESTIONNAIRE RESULTS
 CREATING EXCEL PIVOT TABLES AND PIVOT CHARTS FOR LIBRARY QUESTIONNAIRE RESULTS An Excel Pivot Table is an interactive table that summarizes large amounts of data. It allows the user to view and manipulate
Introduction to Dashboards in Excel 2007. Craig W. Abbey Director of Institutional Analysis Academic Planning and Budget University at Buffalo
 Introduction to Dashboards in Excel 2007 Craig W. Abbey Director of Institutional Analysis Academic Planning and Budget University at Buffalo Course Objectives 1. Learn how to layout various types of dashboards
Beginning Microsoft Access
 Beginning Microsoft Access A database is a collection of information. Common collections of information that can be entered into a database include the library card catalog, a recipe box, or your personal
Next Generation Dashboard Guide
 Next Generation Dashboard Guide For use with READ 180 Next Generation, System 44 Next Generation, FASTT Math Next Generation, iread, MATH 180, and Scholastic Achievement Manager (SAM) version 2.0.2 or
Overview What is a PivotTable? Benefits
 Overview What is a PivotTable? Benefits Create a PivotTable Select Row & Column labels & Values Filtering & Sorting Calculations Data Details Refresh Data Design options Create a PivotChart Slicers Charts