Visualization and descriptive statistics. D.A. Forsyth
|
|
|
- Egbert Francis
- 8 years ago
- Views:
Transcription
1 Visualization and descriptive statistics D.A. Forsyth

2 What s going on here? Most important, most creative scientific question Getting answers Make helpful pictures and look at them Compute numbers in support of making pictures Data has types Continuous Discrete Ordinal (can be ordered) Categorical (no natural order, cat vs hat ) Different plots apply
")
3 Histograms Categorical data Ick!

4 Bar Charts Categorical data - counts in category

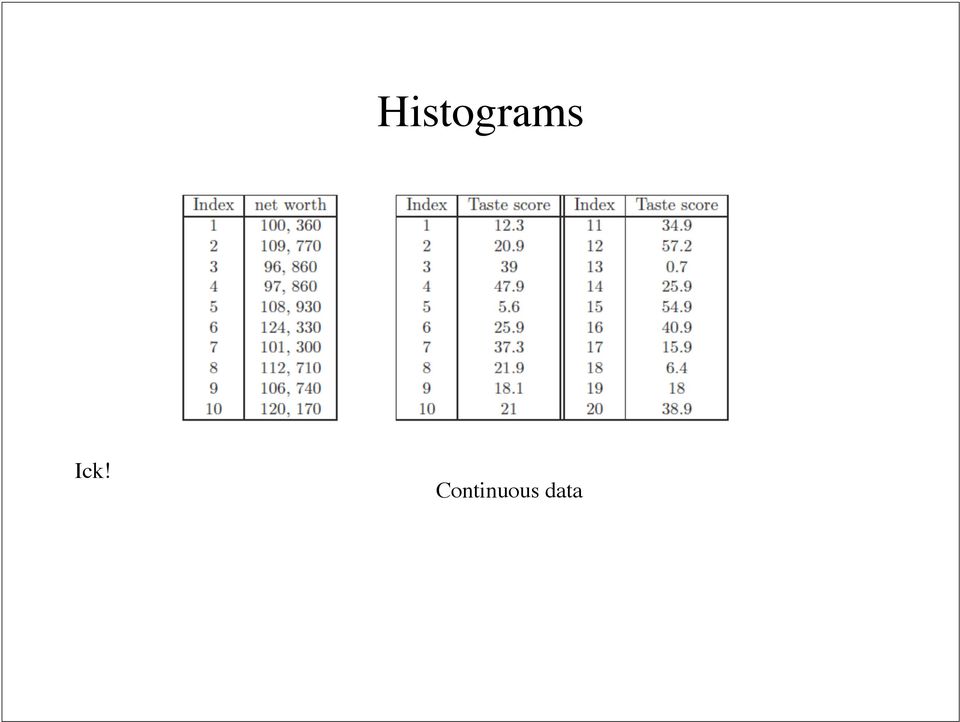
5 Histograms Ick! Continuous data
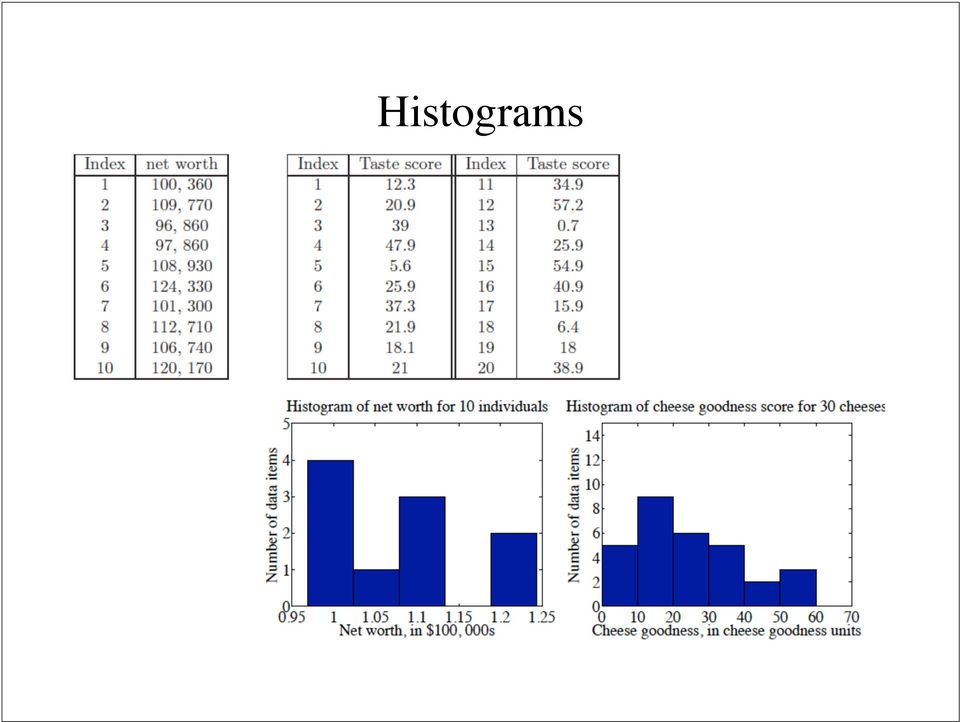
6 Histograms
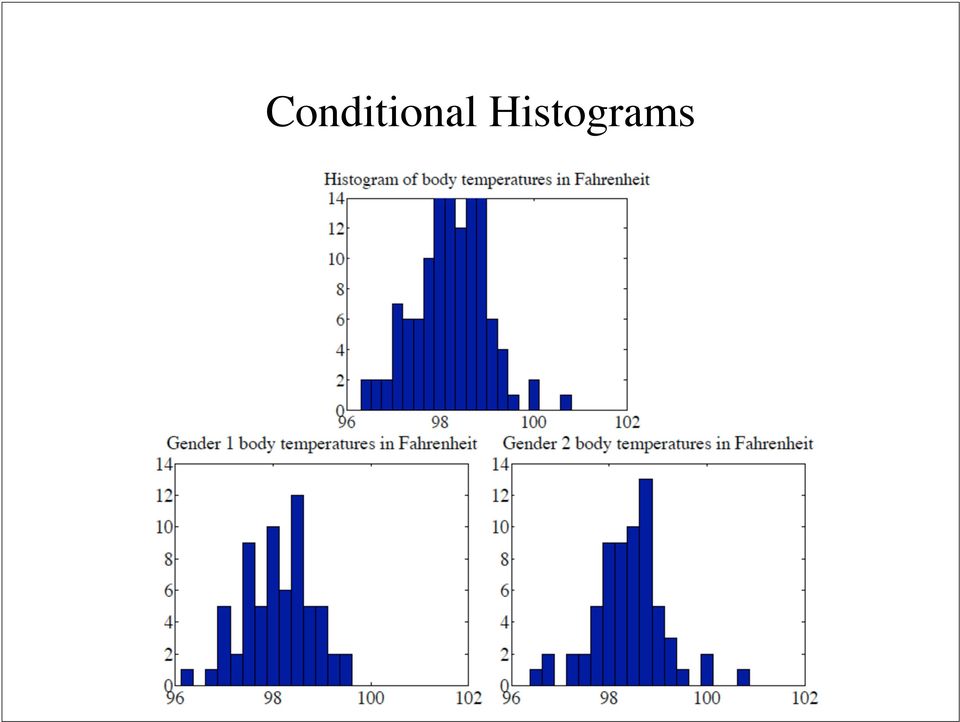
7 Conditional Histograms
8 Data example Clicks, impressions and ages for NYT website Question: Look at data - what s going on? Example R code on webpage

9 Why R? It s free It s easy to get pictures up and going from weirdly formatted datasets Many, many tools most of the code I ll work with is downloaded/copied that s the right strategy work with tools *without* implementing them

10 Some R setwd('/users/daf/current/courses/bigdata/examples') data1<-read.csv('/users/daf/current/courses/bigdata/doing_data_science-master/dds_datasets/dds_ch2_nyt/nyt1.csv') data1$agecat<-cut(data1$age, c(-inf, 0, 18, 24, 34, 44, 54, 64, 74, 84, Inf)) # This breaks the Age column into categories data1$impcat<-cut(data1$impressions, c(-inf, 0, 1, 2, 3, 4, 5, Inf)) # This breaks the impression column into categories summary(data1)
) # This breaks")
11 Age Gender Impressions Clicks Signed_In agecat impcat Min. : 0.00 Min. :0.000 Min. : Min. : Min. : (-Inf,0]: (-Inf,0]: st Qu.: st Qu.: st Qu.: st Qu.: st Qu.: (34,44] : (0,1] : Median : Median :0.000 Median : Median : Median : (44,54] : (1,2] : Mean : Mean :0.367 Mean : Mean : Mean : (24,34] : (2,3] : rd Qu.: rd Qu.: rd Qu.: rd Qu.: rd Qu.: (54,64] : (3,4] : Max. : Max. :1.000 Max. : Max. : Max. : (18,24] : (4,5] : (Other) : (5, Inf]:176558
![0000 (44,54] : 64288 (1,2] : 38433 Mean : 29.48 Mean :0.367 Mean : 5.007 Mean :0.09259 Mean :0.7009 (24,34] : 58174 (2,3] : 64121 3rd Qu.: 48.00 3rd Qu.:1.000 3rd Qu.: 6.000 3rd Qu.:0.00000 3rd Qu.](/docs-images/43/13242595/images/page_11.jpg ":1.0000 (54,64] : 44738 (3,4] : 80303 Max. :108.00 Max. :1.000 Max. :20.000 Max. :4.00000 Max. :1.0000 (18,24] : 35270 (4,5] : 80477 (Other) : 48005 (5, Inf]:176558")
12 Users by age

13 Impression histogram, faceted by age

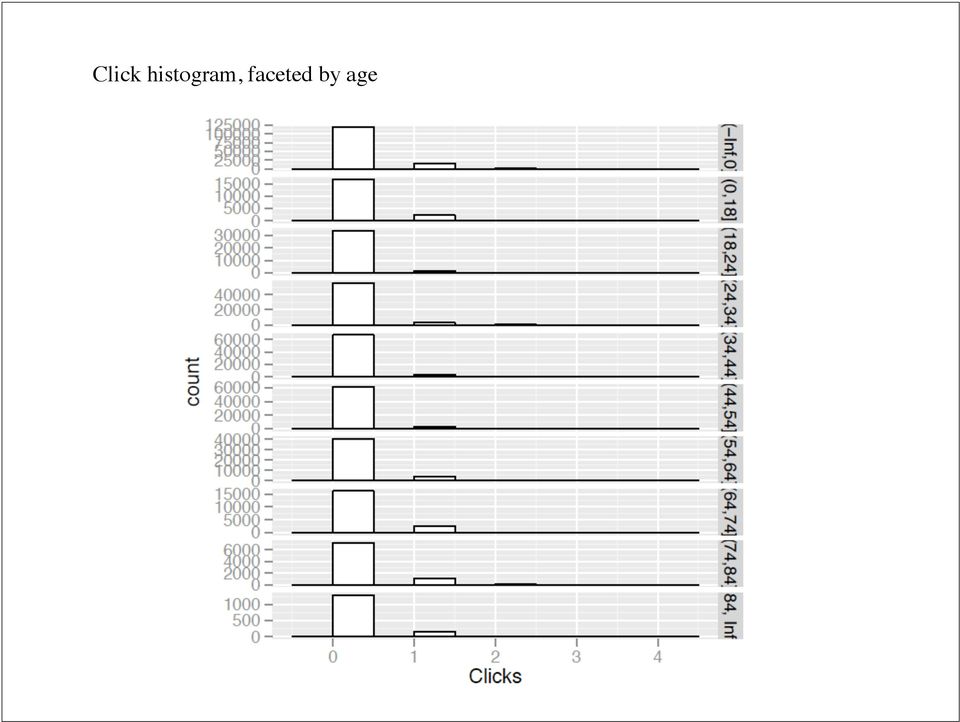
14 Click histogram, faceted by age
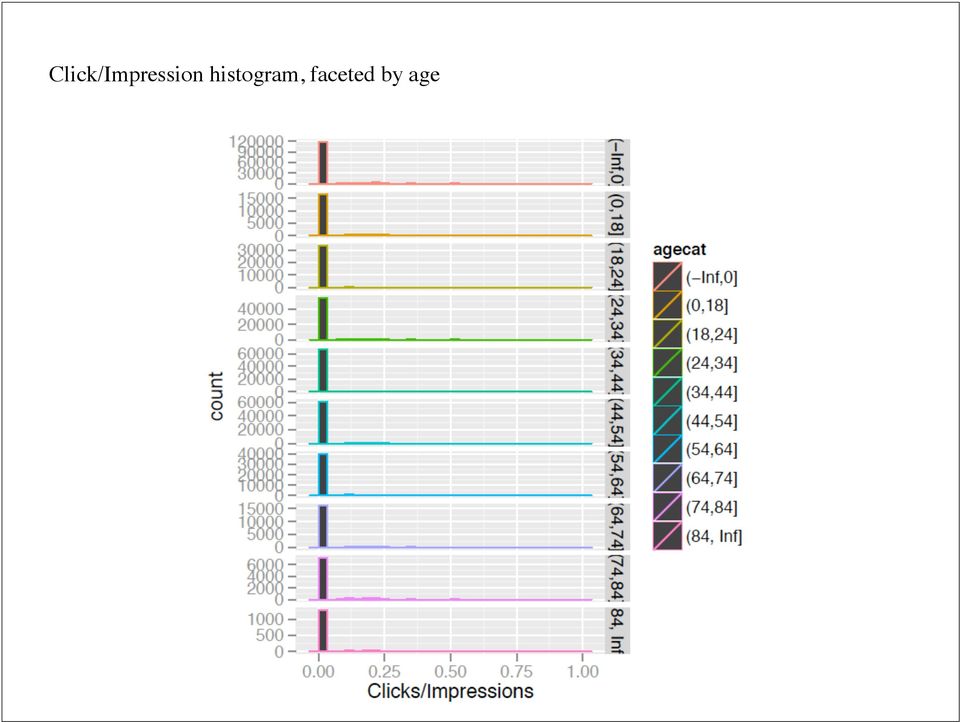
15 Click/Impression histogram, faceted by age
16 2D Data
17 Categorical data Pie charts are deprecated - it s hard to judge area by eye accurately

18 Mosaic Plots

19 The UFO data set UFO sighting data date of sighting; date of report; location; description; some free text rather messy data about 15 years of sightings ( with some others) broke into 1000 day blocks looked at most common shape descriptors (' disk', ' light', ' circle', ' triangle', ' sphere', ' oval', ' other', ' unknown') great example of categorical data R-code on website not great code, but informative building a map, merging datasets, reading datasets, mosaic plots you should look at this
 great example of categorical data R-code on")
20 Conclusion: UFO shapes haven t changed over time

21 Ordinal data
22 Ordinal data
23 Series
24 Scatter plots Plot a marker at a location where there is a datapoint Simplest case - geographic
25
26
27 Arsenic in well water
28 UFO sightings by state
29 UFO s by interval
30 UFO s by interval
31 UFO s by interval
32 UFO s by interval
33 UFO s by interval
34 UFO s by interval
35 Interesting analogy Blackett s reasoning about submarine sightings in WWII can estimate probability of sightings lead to significantly improved sighting rates, aircraft painting and lighting strategies (see Korner, The pleasures of counting or good histories)
36 NYT data - remarks Many data points lying on top of each other scatter plot can be deceptive jitter the points (move by a small random amount)
37
38 Age Gender Impressions Clicks Signed_In agecat impcat Min. : 0.00 Min. :0.000 Min. : Min. : Min. : (-Inf,0]: (-Inf,0]: st Qu.: st Qu.: st Qu.: st Qu.: st Qu.: (34,44] : (0,1] : Median : Median :0.000 Median : Median : Median : (44,54] : (1,2] : Mean : Mean :0.367 Mean : Mean : Mean : (24,34] : (2,3] : rd Qu.: rd Qu.: rd Qu.: rd Qu.: rd Qu.: (54,64] : (3,4] : Max. : Max. :1.000 Max. : Max. : Max. : (18,24] : (4,5] : (Other) : (5, Inf]:176558
39
40
41 NYT scatters
42 Scale is an issue
43 Outliers can set scale
44 But scale is really a problem
45 Lynx pelts
46 Data example Housing sales in NYC boroughs Question: Look at real estate sales - what s going on?
47 Summary Statistics - mean The average The best estimate of the value of a new datapoint in the absence of any other information about it
48 Summary statistics - Standard deviation Think of this as a scale Average distance from mean Important math properties in notes
49 Standard deviation = there are not many points many standard deviations away from the mean = there is at least one point at least one standard deviation away from the mean
50 Standard coordinates
51 Suppressing scale effects Do scatter plots in standard coordinates for x, y
52
53 Lynx, normalized
54 x, y don t really matter
55
56 Positive Correlation
57 Zero Correlation
58 Negative correlation
59 The Correlation Coefficient
60
61 Correlation isn t causality and foot size is positively correlated with reading ability, etc.
62 but can be used to predict
63 What s going wrong here? NYT normalized
64
65 A Mosaic Plot
66
STATS8: Introduction to Biostatistics. Data Exploration. Babak Shahbaba Department of Statistics, UCI
 STATS8: Introduction to Biostatistics Data Exploration Babak Shahbaba Department of Statistics, UCI Introduction After clearly defining the scientific problem, selecting a set of representative members
Diagrams and Graphs of Statistical Data
 Diagrams and Graphs of Statistical Data One of the most effective and interesting alternative way in which a statistical data may be presented is through diagrams and graphs. There are several ways in
AMS 7L LAB #2 Spring, 2009. Exploratory Data Analysis
 AMS 7L LAB #2 Spring, 2009 Exploratory Data Analysis Name: Lab Section: Instructions: The TAs/lab assistants are available to help you if you have any questions about this lab exercise. If you have any
Introduction to Data Visualization
 Introduction to Data Visualization STAT 133 Gaston Sanchez Department of Statistics, UC Berkeley gastonsanchez.com github.com/gastonstat/stat133 Course web: gastonsanchez.com/teaching/stat133 Graphics
The Big Picture. Describing Data: Categorical and Quantitative Variables Population. Descriptive Statistics. Community Coalitions (n = 175)
") Describing Data: Categorical and Quantitative Variables Population The Big Picture Sampling Statistical Inference Sample Exploratory Data Analysis Descriptive Statistics In order to make sense of data,
Describing Data: Categorical and Quantitative Variables Population The Big Picture Sampling Statistical Inference Sample Exploratory Data Analysis Descriptive Statistics In order to make sense of data,
Summarizing and Displaying Categorical Data
 Summarizing and Displaying Categorical Data Categorical data can be summarized in a frequency distribution which counts the number of cases, or frequency, that fall into each category, or a relative frequency
Descriptive statistics parameters: Measures of centrality
 Descriptive statistics parameters: Measures of centrality Contents Definitions... 3 Classification of descriptive statistics parameters... 4 More about central tendency estimators... 5 Relationship between
Introduction to Statistics for Psychology. Quantitative Methods for Human Sciences
 Introduction to Statistics for Psychology and Quantitative Methods for Human Sciences Jonathan Marchini Course Information There is website devoted to the course at http://www.stats.ox.ac.uk/ marchini/phs.html
 T O P I C 1 2 Techniques and tools for data analysis Preview Introduction In chapter 3 of Statistics In A Day different combinations of numbers and types of variables are presented. We go through these
Exercise 1.12 (Pg. 22-23)
") Individuals: The objects that are described by a set of data. They may be people, animals, things, etc. (Also referred to as Cases or Records) Variables: The characteristics recorded about each individual.
Individuals: The objects that are described by a set of data. They may be people, animals, things, etc. (Also referred to as Cases or Records) Variables: The characteristics recorded about each individual.
2013 MBA Jump Start Program. Statistics Module Part 3
 2013 MBA Jump Start Program Module 1: Statistics Thomas Gilbert Part 3 Statistics Module Part 3 Hypothesis Testing (Inference) Regressions 2 1 Making an Investment Decision A researcher in your firm just
Foundation of Quantitative Data Analysis
 Foundation of Quantitative Data Analysis Part 1: Data manipulation and descriptive statistics with SPSS/Excel HSRS #10 - October 17, 2013 Reference : A. Aczel, Complete Business Statistics. Chapters 1
Exploratory data analysis (Chapter 2) Fall 2011
 Fall 2011") Exploratory data analysis (Chapter 2) Fall 2011 Data Examples Example 1: Survey Data 1 Data collected from a Stat 371 class in Fall 2005 2 They answered questions about their: gender, major, year in school,
Exploratory data analysis (Chapter 2) Fall 2011 Data Examples Example 1: Survey Data 1 Data collected from a Stat 371 class in Fall 2005 2 They answered questions about their: gender, major, year in school,
Northumberland Knowledge
 Northumberland Knowledge Know Guide How to Analyse Data - November 2012 - This page has been left blank 2 About this guide The Know Guides are a suite of documents that provide useful information about
Descriptive statistics Statistical inference statistical inference, statistical induction and inferential statistics
 Descriptive statistics is the discipline of quantitatively describing the main features of a collection of data. Descriptive statistics are distinguished from inferential statistics (or inductive statistics),
Iris Sample Data Set. Basic Visualization Techniques: Charts, Graphs and Maps. Summary Statistics. Frequency and Mode
 Iris Sample Data Set Basic Visualization Techniques: Charts, Graphs and Maps CS598 Information Visualization Spring 2010 Many of the exploratory data techniques are illustrated with the Iris Plant data
MTH 140 Statistics Videos
 MTH 140 Statistics Videos Chapter 1 Picturing Distributions with Graphs Individuals and Variables Categorical Variables: Pie Charts and Bar Graphs Categorical Variables: Pie Charts and Bar Graphs Quantitative
Introduction to Regression and Data Analysis
 Statlab Workshop Introduction to Regression and Data Analysis with Dan Campbell and Sherlock Campbell October 28, 2008 I. The basics A. Types of variables Your variables may take several forms, and it
Visualization Quick Guide
 Visualization Quick Guide A best practice guide to help you find the right visualization for your data WHAT IS DOMO? Domo is a new form of business intelligence (BI) unlike anything before an executive
A Correlation of. to the. South Carolina Data Analysis and Probability Standards
 A Correlation of to the South Carolina Data Analysis and Probability Standards INTRODUCTION This document demonstrates how Stats in Your World 2012 meets the indicators of the South Carolina Academic Standards
Data Exploration Data Visualization
 Data Exploration Data Visualization What is data exploration? A preliminary exploration of the data to better understand its characteristics. Key motivations of data exploration include Helping to select
TIBCO Spotfire Business Author Essentials Quick Reference Guide. Table of contents:
 Table of contents: Access Data for Analysis Data file types Format assumptions Data from Excel Information links Add multiple data tables Create & Interpret Visualizations Table Pie Chart Cross Table Treemap
DESCRIPTIVE STATISTICS. The purpose of statistics is to condense raw data to make it easier to answer specific questions; test hypotheses.
 DESCRIPTIVE STATISTICS The purpose of statistics is to condense raw data to make it easier to answer specific questions; test hypotheses. DESCRIPTIVE VS. INFERENTIAL STATISTICS Descriptive To organize,
Lecture 2: Descriptive Statistics and Exploratory Data Analysis
 Lecture 2: Descriptive Statistics and Exploratory Data Analysis Further Thoughts on Experimental Design 16 Individuals (8 each from two populations) with replicates Pop 1 Pop 2 Randomly sample 4 individuals
Using SPSS, Chapter 2: Descriptive Statistics
 1 Using SPSS, Chapter 2: Descriptive Statistics Chapters 2.1 & 2.2 Descriptive Statistics 2 Mean, Standard Deviation, Variance, Range, Minimum, Maximum 2 Mean, Median, Mode, Standard Deviation, Variance,
Data Visualization Handbook
 SAP Lumira Data Visualization Handbook www.saplumira.com 1 Table of Content 3 Introduction 20 Ranking 4 Know Your Purpose 23 Part-to-Whole 5 Know Your Data 25 Distribution 9 Crafting Your Message 29 Correlation
CRLS Mathematics Department Algebra I Curriculum Map/Pacing Guide
 Curriculum Map/Pacing Guide page 1 of 14 Quarter I start (CP & HN) 170 96 Unit 1: Number Sense and Operations 24 11 Totals Always Include 2 blocks for Review & Test Operating with Real Numbers: How are
Tutorial 3: Graphics and Exploratory Data Analysis in R Jason Pienaar and Tom Miller
 Tutorial 3: Graphics and Exploratory Data Analysis in R Jason Pienaar and Tom Miller Getting to know the data An important first step before performing any kind of statistical analysis is to familiarize
Data exploration with Microsoft Excel: analysing more than one variable
 Data exploration with Microsoft Excel: analysing more than one variable Contents 1 Introduction... 1 2 Comparing different groups or different variables... 2 3 Exploring the association between categorical
430 Statistics and Financial Mathematics for Business
 Prescription: 430 Statistics and Financial Mathematics for Business Elective prescription Level 4 Credit 20 Version 2 Aim Students will be able to summarise, analyse, interpret and present data, make predictions
Visualizations. Cyclical data. Comparison. What would you like to show? Composition. Simple share of total. Relative and absolute differences matter
 Visualizations Variable width chart Table or tables with embedded charts Bar chart horizontal Circular area chart per item Many categories Cyclical data Non-cyclical data Single or few categories Many
GeoGebra Statistics and Probability
 GeoGebra Statistics and Probability Project Maths Development Team 2013 www.projectmaths.ie Page 1 of 24 Index Activity Topic Page 1 Introduction GeoGebra Statistics 3 2 To calculate the Sum, Mean, Count,
Center: Finding the Median. Median. Spread: Home on the Range. Center: Finding the Median (cont.)
") Center: Finding the Median When we think of a typical value, we usually look for the center of the distribution. For a unimodal, symmetric distribution, it s easy to find the center it s just the center
Center: Finding the Median When we think of a typical value, we usually look for the center of the distribution. For a unimodal, symmetric distribution, it s easy to find the center it s just the center
Using Excel for descriptive statistics
 FACT SHEET Using Excel for descriptive statistics Introduction Biologists no longer routinely plot graphs by hand or rely on calculators to carry out difficult and tedious statistical calculations. These
Data Visualization Techniques
 Data Visualization Techniques From Basics to Big Data with SAS Visual Analytics WHITE PAPER SAS White Paper Table of Contents Introduction.... 1 Generating the Best Visualizations for Your Data... 2 The
Data Mining: Exploring Data. Lecture Notes for Chapter 3. Slides by Tan, Steinbach, Kumar adapted by Michael Hahsler
 Data Mining: Exploring Data Lecture Notes for Chapter 3 Slides by Tan, Steinbach, Kumar adapted by Michael Hahsler Topics Exploratory Data Analysis Summary Statistics Visualization What is data exploration?
Introduction Course in SPSS - Evening 1
 ETH Zürich Seminar für Statistik Introduction Course in SPSS - Evening 1 Seminar für Statistik, ETH Zürich All data used during the course can be downloaded from the following ftp server: ftp://stat.ethz.ch/u/sfs/spsskurs/
Data Mining: Exploring Data. Lecture Notes for Chapter 3. Introduction to Data Mining
 Data Mining: Exploring Data Lecture Notes for Chapter 3 Introduction to Data Mining by Tan, Steinbach, Kumar What is data exploration? A preliminary exploration of the data to better understand its characteristics.
Why Taking This Course? Course Introduction, Descriptive Statistics and Data Visualization. Learning Goals. GENOME 560, Spring 2012
 Why Taking This Course? Course Introduction, Descriptive Statistics and Data Visualization GENOME 560, Spring 2012 Data are interesting because they help us understand the world Genomics: Massive Amounts
Intro to Statistics 8 Curriculum
 Intro to Statistics 8 Curriculum Unit 1 Bar, Line and Circle Graphs Estimated time frame for unit Big Ideas 8 Days... Essential Question Concepts Competencies Lesson Plans and Suggested Resources Bar graphs
Module 2: Introduction to Quantitative Data Analysis
 Module 2: Introduction to Quantitative Data Analysis Contents Antony Fielding 1 University of Birmingham & Centre for Multilevel Modelling Rebecca Pillinger Centre for Multilevel Modelling Introduction...
Visualizing Data. Contents. 1 Visualizing Data. Anthony Tanbakuchi Department of Mathematics Pima Community College. Introductory Statistics Lectures
 Introductory Statistics Lectures Visualizing Data Descriptive Statistics I Department of Mathematics Pima Community College Redistribution of this material is prohibited without written permission of the
Describing, Exploring, and Comparing Data
 24 Chapter 2. Describing, Exploring, and Comparing Data Chapter 2. Describing, Exploring, and Comparing Data There are many tools used in Statistics to visualize, summarize, and describe data. This chapter
Experience, Not Metrics
 Part 7: Consolidating Test Results User Experience, Not Metrics by: R. Scott Barber You ve been running this test for weeks and sending me charts almost every day, but what does it all mean?!? If your
Data Visualization. BUS 230: Business and Economic Research and Communication
 Data Visualization BUS 230: Business and Economic Research and Communication Data Visualization 1/ 16 Purpose of graphs and charts is to show a picture that can enhance a message, or quickly communicate
Simple Predictive Analytics Curtis Seare
 Using Excel to Solve Business Problems: Simple Predictive Analytics Curtis Seare Copyright: Vault Analytics July 2010 Contents Section I: Background Information Why use Predictive Analytics? How to use
R Graphics Cookbook. Chang O'REILLY. Winston. Tokyo. Beijing Cambridge. Farnham Koln Sebastopol
 R Graphics Cookbook Winston Chang Beijing Cambridge Farnham Koln Sebastopol O'REILLY Tokyo Table of Contents Preface ix 1. R Basics 1 1.1. Installing a Package 1 1.2. Loading a Package 2 1.3. Loading a
UNIT 1: COLLECTING DATA
 Core Probability and Statistics Probability and Statistics provides a curriculum focused on understanding key data analysis and probabilistic concepts, calculations, and relevance to real-world applications.
Mathematics (Project Maths)
") Pre-Leaving Certificate Examination Mathematics (Project Maths) Paper 2 Higher Level February 2010 2½ hours 300 marks Running total Examination number Centre stamp For examiner Question Mark 1 2 3 4 5
Pre-Leaving Certificate Examination Mathematics (Project Maths) Paper 2 Higher Level February 2010 2½ hours 300 marks Running total Examination number Centre stamp For examiner Question Mark 1 2 3 4 5
COM CO P 5318 Da t Da a t Explora Explor t a ion and Analysis y Chapte Chapt r e 3
 COMP 5318 Data Exploration and Analysis Chapter 3 What is data exploration? A preliminary exploration of the data to better understand its characteristics. Key motivations of data exploration include Helping
Bar Charts, Histograms, Line Graphs & Pie Charts
 Bar Charts and Histograms Bar charts and histograms are commonly used to represent data since they allow quick assimilation and immediate comparison of information. Normally the bars are vertical, but
4.1 Exploratory Analysis: Once the data is collected and entered, the first question is: "What do the data look like?"
 Data Analysis Plan The appropriate methods of data analysis are determined by your data types and variables of interest, the actual distribution of the variables, and the number of cases. Different analyses
Lecture 1: Review and Exploratory Data Analysis (EDA)
") Lecture 1: Review and Exploratory Data Analysis (EDA) Sandy Eckel seckel@jhsph.edu Department of Biostatistics, The Johns Hopkins University, Baltimore USA 21 April 2008 1 / 40 Course Information I Course
Lecture 1: Review and Exploratory Data Analysis (EDA) Sandy Eckel seckel@jhsph.edu Department of Biostatistics, The Johns Hopkins University, Baltimore USA 21 April 2008 1 / 40 Course Information I Course
Math 132. Population Growth: the World
 Math 132 Population Growth: the World S. R. Lubkin Application If you think growth in Raleigh is a problem, think a little bigger. The population of the world has been growing spectacularly fast in the
business statistics using Excel OXFORD UNIVERSITY PRESS Glyn Davis & Branko Pecar
 business statistics using Excel Glyn Davis & Branko Pecar OXFORD UNIVERSITY PRESS Detailed contents Introduction to Microsoft Excel 2003 Overview Learning Objectives 1.1 Introduction to Microsoft Excel
Bowerman, O'Connell, Aitken Schermer, & Adcock, Business Statistics in Practice, Canadian edition
 Bowerman, O'Connell, Aitken Schermer, & Adcock, Business Statistics in Practice, Canadian edition Online Learning Centre Technology Step-by-Step - Excel Microsoft Excel is a spreadsheet software application
Part 2: Data Visualization How to communicate complex ideas with simple, efficient and accurate data graphics
 Part 2: Data Visualization How to communicate complex ideas with simple, efficient and accurate data graphics Why visualize data? The human eye is extremely sensitive to differences in: Pattern Colors
Creating an Excel XY (Scatter) Plot
 Plot") Creating an Excel XY (Scatter) Plot EXCEL REVIEW 21-22 1 What is an XY or Scatter Plot? An XY or scatter plot either shows the relationships among the numeric values in several data series or plots two
Creating an Excel XY (Scatter) Plot EXCEL REVIEW 21-22 1 What is an XY or Scatter Plot? An XY or scatter plot either shows the relationships among the numeric values in several data series or plots two
Introduction to Dashboards in Excel 2007. Craig W. Abbey Director of Institutional Analysis Academic Planning and Budget University at Buffalo
 Introduction to Dashboards in Excel 2007 Craig W. Abbey Director of Institutional Analysis Academic Planning and Budget University at Buffalo Course Objectives 1. Learn how to layout various types of dashboards
STAB22 section 1.1. total = 88(200/100) + 85(200/100) + 77(300/100) + 90(200/100) + 80(100/100) = 176 + 170 + 231 + 180 + 80 = 837,
 + 85(200/100) + 77(300/100) + 90(200/100) + 80(100/100) = 176 + 170 + 231 + 180 + 80 = 837,") STAB22 section 1.1 1.1 Find the student with ID 104, who is in row 5. For this student, Exam1 is 95, Exam2 is 98, and Final is 96, reading along the row. 1.2 This one involves a careful reading of the
STAB22 section 1.1 1.1 Find the student with ID 104, who is in row 5. For this student, Exam1 is 95, Exam2 is 98, and Final is 96, reading along the row. 1.2 This one involves a careful reading of the
Data Visualization Best Practice. Sophie Sparkes Data Analyst
 Data Visualization Best Practice Sophie Sparkes Data Analyst http://graphics.wsj.com/infectious-diseases-and-vaccines/ http://blogs.sas.com/content/jmp/2015/03/05/graph-makeover-measles-heat-map/ http://graphics.wsj.com/infectious-diseases-and-vaccines/
Once saved, if the file was zipped you will need to unzip it. For the files that I will be posting you need to change the preferences.
 1 Commands in JMP and Statcrunch Below are a set of commands in JMP and Statcrunch which facilitate a basic statistical analysis. The first part concerns commands in JMP, the second part is for analysis
STAT355 - Probability & Statistics
 STAT355 - Probability & Statistics Instructor: Kofi Placid Adragni Fall 2011 Chap 1 - Overview and Descriptive Statistics 1.1 Populations, Samples, and Processes 1.2 Pictorial and Tabular Methods in Descriptive
DESCRIPTIVE STATISTICS AND EXPLORATORY DATA ANALYSIS
 DESCRIPTIVE STATISTICS AND EXPLORATORY DATA ANALYSIS SEEMA JAGGI Indian Agricultural Statistics Research Institute Library Avenue, New Delhi - 110 012 seema@iasri.res.in 1. Descriptive Statistics Statistics
1.3 Measuring Center & Spread, The Five Number Summary & Boxplots. Describing Quantitative Data with Numbers
 1.3 Measuring Center & Spread, The Five Number Summary & Boxplots Describing Quantitative Data with Numbers 1.3 I can n Calculate and interpret measures of center (mean, median) in context. n Calculate
BNG 202 Biomechanics Lab. Descriptive statistics and probability distributions I
 BNG 202 Biomechanics Lab Descriptive statistics and probability distributions I Overview The overall goal of this short course in statistics is to provide an introduction to descriptive and inferential
Data analysis process
 Data analysis process Data collection and preparation Collect data Prepare codebook Set up structure of data Enter data Screen data for errors Exploration of data Descriptive Statistics Graphs Analysis
WebFOCUS RStat. RStat. Predict the Future and Make Effective Decisions Today. WebFOCUS RStat
 Information Builders enables agile information solutions with business intelligence (BI) and integration technologies. WebFOCUS the most widely utilized business intelligence platform connects to any enterprise
Data Mining: Exploring Data. Lecture Notes for Chapter 3. Introduction to Data Mining
 Data Mining: Exploring Data Lecture Notes for Chapter 3 Introduction to Data Mining by Tan, Steinbach, Kumar Tan,Steinbach, Kumar Introduction to Data Mining 8/05/2005 1 What is data exploration? A preliminary
II. DISTRIBUTIONS distribution normal distribution. standard scores
 Appendix D Basic Measurement And Statistics The following information was developed by Steven Rothke, PhD, Department of Psychology, Rehabilitation Institute of Chicago (RIC) and expanded by Mary F. Schmidt,
Data Visualization Techniques
 Data Visualization Techniques From Basics to Big Data with SAS Visual Analytics WHITE PAPER SAS White Paper Table of Contents Introduction.... 1 Generating the Best Visualizations for Your Data... 2 The
Descriptive Statistics
 Descriptive Statistics Descriptive statistics consist of methods for organizing and summarizing data. It includes the construction of graphs, charts and tables, as well various descriptive measures such
Statistics I for QBIC. Contents and Objectives. Chapters 1 7. Revised: August 2013
 Statistics I for QBIC Text Book: Biostatistics, 10 th edition, by Daniel & Cross Contents and Objectives Chapters 1 7 Revised: August 2013 Chapter 1: Nature of Statistics (sections 1.1-1.6) Objectives
Analyzing Experimental Data
 Analyzing Experimental Data The information in this chapter is a short summary of some topics that are covered in depth in the book Students and Research written by Cothron, Giese, and Rezba. See the end
Evaluating the results of a car crash study using Statistical Analysis System. Kennesaw State University
 Running head: EVALUATING THE RESULTS OF A CAR CRASH STUDY USING SAS 1 Evaluating the results of a car crash study using Statistical Analysis System Kennesaw State University 2 Abstract Part 1. The study
Prentice Hall Mathematics Courses 1-3 Common Core Edition 2013
 A Correlation of Prentice Hall Mathematics Courses 1-3 Common Core Edition 2013 to the Topics & Lessons of Pearson A Correlation of Courses 1, 2 and 3, Common Core Introduction This document demonstrates
TIPS FOR DOING STATISTICS IN EXCEL
 TIPS FOR DOING STATISTICS IN EXCEL Before you begin, make sure that you have the DATA ANALYSIS pack running on your machine. It comes with Excel. Here s how to check if you have it, and what to do if you
The Dummy s Guide to Data Analysis Using SPSS
 The Dummy s Guide to Data Analysis Using SPSS Mathematics 57 Scripps College Amy Gamble April, 2001 Amy Gamble 4/30/01 All Rights Rerserved TABLE OF CONTENTS PAGE Helpful Hints for All Tests...1 Tests
Getting started in Excel
 Getting started in Excel Disclaimer: This guide is not complete. It is rather a chronicle of my attempts to start using Excel for data analysis. As I use a Mac with OS X, these directions may need to be
Scatter Plots with Error Bars
 Chapter 165 Scatter Plots with Error Bars Introduction The procedure extends the capability of the basic scatter plot by allowing you to plot the variability in Y and X corresponding to each point. Each
Data Exploration and Preprocessing. Data Mining and Text Mining (UIC 583 @ Politecnico di Milano)
") Data Exploration and Preprocessing Data Mining and Text Mining (UIC 583 @ Politecnico di Milano) References Jiawei Han and Micheline Kamber, "Data Mining: Concepts and Techniques", The Morgan Kaufmann
Data Exploration and Preprocessing Data Mining and Text Mining (UIC 583 @ Politecnico di Milano) References Jiawei Han and Micheline Kamber, "Data Mining: Concepts and Techniques", The Morgan Kaufmann
IBM SPSS Direct Marketing 23
 IBM SPSS Direct Marketing 23 Note Before using this information and the product it supports, read the information in Notices on page 25. Product Information This edition applies to version 23, release
EXPLORING SPATIAL PATTERNS IN YOUR DATA
 EXPLORING SPATIAL PATTERNS IN YOUR DATA OBJECTIVES Learn how to examine your data using the Geostatistical Analysis tools in ArcMap. Learn how to use descriptive statistics in ArcMap and Geoda to analyze
Measurement & Data Analysis. On the importance of math & measurement. Steps Involved in Doing Scientific Research. Measurement
 Measurement & Data Analysis Overview of Measurement. Variability & Measurement Error.. Descriptive vs. Inferential Statistics. Descriptive Statistics. Distributions. Standardized Scores. Graphing Data.
1. Go to your programs menu and click on Microsoft Excel.
 Elementary Statistics Computer Assignment 1 Using Microsoft EXCEL 2003, follow the steps below. For Microsoft EXCEL 2007 instructions, go to the next page. For Microsoft 2010 and 2007 instructions with
Below is a very brief tutorial on the basic capabilities of Excel. Refer to the Excel help files for more information.
 Excel Tutorial Below is a very brief tutorial on the basic capabilities of Excel. Refer to the Excel help files for more information. Working with Data Entering and Formatting Data Before entering data
IBM SPSS Direct Marketing 22
 IBM SPSS Direct Marketing 22 Note Before using this information and the product it supports, read the information in Notices on page 25. Product Information This edition applies to version 22, release
Mathematics (Project Maths)
") 2010. M130 S Coimisiún na Scrúduithe Stáit State Examinations Commission Leaving Certificate Examination Sample Paper Mathematics (Project Maths) Paper 2 Higher Level Time: 2 hours, 30 minutes 300 marks
2010. M130 S Coimisiún na Scrúduithe Stáit State Examinations Commission Leaving Certificate Examination Sample Paper Mathematics (Project Maths) Paper 2 Higher Level Time: 2 hours, 30 minutes 300 marks
Common Core Unit Summary Grades 6 to 8
 Common Core Unit Summary Grades 6 to 8 Grade 8: Unit 1: Congruence and Similarity- 8G1-8G5 rotations reflections and translations,( RRT=congruence) understand congruence of 2 d figures after RRT Dilations
Projects Involving Statistics (& SPSS)
") Projects Involving Statistics (& SPSS) Academic Skills Advice Starting a project which involves using statistics can feel confusing as there seems to be many different things you can do (charts, graphs,
Projects Involving Statistics (& SPSS) Academic Skills Advice Starting a project which involves using statistics can feel confusing as there seems to be many different things you can do (charts, graphs,
Simple Linear Regression
 STAT 101 Dr. Kari Lock Morgan Simple Linear Regression SECTIONS 9.3 Confidence and prediction intervals (9.3) Conditions for inference (9.1) Want More Stats??? If you have enjoyed learning how to analyze
MATH BOOK OF PROBLEMS SERIES. New from Pearson Custom Publishing!
 MATH BOOK OF PROBLEMS SERIES New from Pearson Custom Publishing! The Math Book of Problems Series is a database of math problems for the following courses: Pre-algebra Algebra Pre-calculus Calculus Statistics
Chapter 7: Simple linear regression Learning Objectives
 Chapter 7: Simple linear regression Learning Objectives Reading: Section 7.1 of OpenIntro Statistics Video: Correlation vs. causation, YouTube (2:19) Video: Intro to Linear Regression, YouTube (5:18) -
Getting started manual
 Getting started manual XLSTAT Getting started manual Addinsoft 1 Table of Contents Install XLSTAT and register a license key... 4 Install XLSTAT on Windows... 4 Verify that your Microsoft Excel is up-to-date...
R and Rcmdr : Basic Functions for Managing Data
 Jaila Page 1 R and Rcmdr : Basic Functions for Managing Data Key issues in using R for a data analysis: Difference between numeric variables and factors in R/Rcmdr Load data either by entering manually,
Exploratory Data Analysis
 Exploratory Data Analysis Johannes Schauer johannes.schauer@tugraz.at Institute of Statistics Graz University of Technology Steyrergasse 17/IV, 8010 Graz www.statistics.tugraz.at February 12, 2008 Introduction
Data Mining Techniques Chapter 5: The Lure of Statistics: Data Mining Using Familiar Tools
 Data Mining Techniques Chapter 5: The Lure of Statistics: Data Mining Using Familiar Tools Occam s razor.......................................................... 2 A look at data I.........................................................
Demographics of Atlanta, Georgia:
 Demographics of Atlanta, Georgia: A Visual Analysis of the 2000 and 2010 Census Data 36-315 Final Project Rachel Cohen, Kathryn McKeough, Minnar Xie & David Zimmerman Ethnicities of Atlanta Figure 1: From
Data Preparation and Statistical Displays
 Reservoir Modeling with GSLIB Data Preparation and Statistical Displays Data Cleaning / Quality Control Statistics as Parameters for Random Function Models Univariate Statistics Histograms and Probability