Introduction to Data Visualization
|
|
|
- Cora McDowell
- 10 years ago
- Views:
Transcription
1 Introduction to Data Visualization STAT 133 Gaston Sanchez Department of Statistics, UC Berkeley gastonsanchez.com github.com/gastonstat/stat133 Course web: gastonsanchez.com/teaching/stat133

2 Graphics 2

3 Data Visualization Using only numerical reduction methods in data analyses is far too limiting 3

4 Motivation Consider some data (four pairs of variables) ## x1 y1 x2 y2 x3 y3 x4 y4 ## ## ## ## ## ## ## ## ## ## ##

5 What things would you like to calculate for each variable? 5

6 Motivation ## x1 x2 x3 x4 ## Min. : 4.0 Min. : 4.0 Min. : 4.0 Min. : 8 ## 1st Qu.: 6.5 1st Qu.: 6.5 1st Qu.: 6.5 1st Qu.: 8 ## Median : 9.0 Median : 9.0 Median : 9.0 Median : 8 ## Mean : 9.0 Mean : 9.0 Mean : 9.0 Mean : 9 ## 3rd Qu.:11.5 3rd Qu.:11.5 3rd Qu.:11.5 3rd Qu.: 8 ## Max. :14.0 Max. :14.0 Max. :14.0 Max. :19 ## y1 y2 y3 y4 ## Min. : Min. :3.100 Min. : 5.39 Min. : ## 1st Qu.: st Qu.: st Qu.: st Qu.: ## Median : Median :8.140 Median : 7.11 Median : ## Mean : Mean :7.501 Mean : 7.50 Mean : ## 3rd Qu.: rd Qu.: rd Qu.: rd Qu.: ## Max. : Max. :9.260 Max. :12.74 Max. :

7 What things would you like to calculate for each pair of variables (e.g. x1, y1)? 7

8 Motivation cor(anscombe$x1, anscombe$y1) ## [1] cor(anscombe$x2, anscombe$y2) ## [1] cor(anscombe$x3, anscombe$y3) ## [1] cor(anscombe$x4, anscombe$y4) ## [1]
![8162365 cor(anscombe$x3, anscombe$y3) ## [1] 0.](/docs-images/45/8840470/images/page_8.jpg "8162867 cor(anscombe$x4, anscombe$y4) ## [1] 0.")
9 Motivation Mean of x values = 9.0 Mean of y values = 7.5 least squares equation: y = x Sum of squared errors: 110 Correlation coefficient:

10 Why Graphics? Are you able to see any patterns, associations, relations? ## x1 y1 x2 y2 x3 y3 x4 y4 ## ## ## ## ## ## ## ## ## ## ## Famous dataset "anscombe" (four data sets) 10
 10")
11 Why Graphics? How are these two variables associated? What does these data values look like? ## x1 y1 ## ## ## ## ## ## ## ## ## ## ##

12 Our eyes are not very good at making sense when looking at (many) numbers 12
")
13 Our eyes are not very good at making sense when looking at (many) numbers But they are great for looking at shapes and detecting patterns 12

14 Why Graphics y y x x2 y y x x4 13

15 Data Visualization Using only numerical reduction methods in data analyses is far too limiting. Visualization provides insight that cannot be appreciated by any other approach to learning from data. (W. S. Cleveland) 14

16 Data Visualization A key component of computing with data consists of Data Visualization Google "data visualization" 15

17 Data Visualization 16
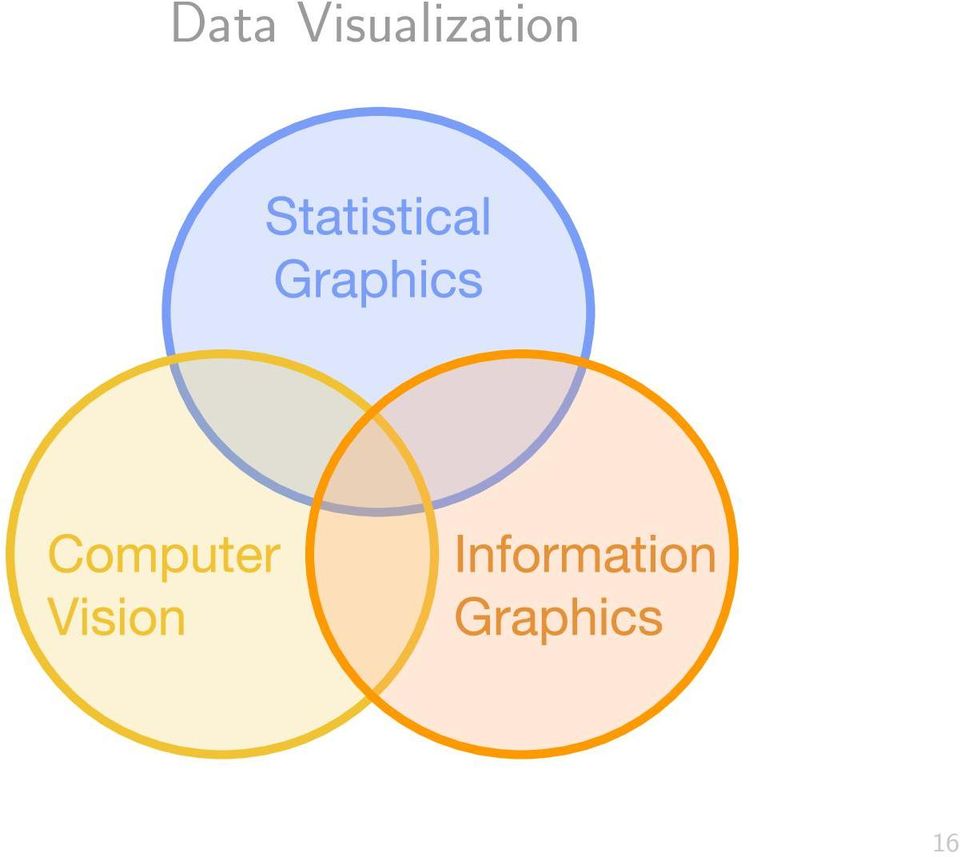
18 Data Visualization Data Visualization Statistical Graphics? Computer Graphics? Computer Vision? Infographics? Data Art? 17

19 Infographic 18

20 Scientific Imaging 19

21 Data Art 20
22 Visualization Continuum Statistical Graphics Facts Data Art Entertainment 21
23 Data Art? There s value in entertaining, putting a smile on someone s face, and making people feel something, as much as there is in optimized presentation. Nathan Yau, 2013 (Data Points, p 69) 22
24 Data Art? Data Art: visualizations that strive to entertain or to create aesthetic experiences with little concern for informing. Stephen Few,
25 Data Visualization 24

26 Stats Graphics 25
27 Stats Graphics Things commonly said about statistical graphics The data should stand out Story telling Big Picture The purpose of visualization is insight, not pictures (Ben Shneiderman) We ll focus on statistical graphics and other visual displays of data in science and technology 26
28 Stats Graphics Graphics for Exploration & Communication 27
29 Graphics for Exploration graphics for understanding data the analyst is the main (and usually only) consumer typically quick & dirty (not much care about visual appearance and design principles) lifespan of a few seconds 28
30 Graphics for Exploration A B C 29
31 Graphics for Communication graphics for presenting data to be consumed by others must care about visual appearance and design require a lot of iterations in order to get the final version what s the message? who s the audience? on what type of media / format? 30
32 Graphics for Communication 10 Average Score A B C 31
33 Graphics for Communication Use visualization to communicate ideas, influence, explain persuade Visuals can serve as evidence or support 32
34 Visualization Visuals can frequently take the place of many words, tables, and numbers Visuals can summarize, aggregate, unite, explain Sometimes words are needed, however 33
35 Graphics (Part I) In this first part of the course we ll focus on: graphics for exploration types of statistical graphics understanding graphics system in R traditional R graphics and graphics with "ggplot2" 34
36 Graphics (Part II) Later in the course we ll talk about: graphics for communication design principles color theory and use of color guidelines and good practices "shiny" and interactive graphics (time permitting) 35
37 Considerations Number of Variables Type of Variables 36
38 How many variables? Variables in datasets: 1 - univariate data 2 - bivariate data 3 - trivariate data multivariate data 37
39 What type of variables? Quantitative -vs- Qualitative Continuous -vs- Discrete 38
40 Univariate Quantitative variable: How values are distributed max, min, ranges measures of center measures of spread areas of concentration outliers interesting patterns 39
41 Univariate Qualitative variable: Counts and proportions (i.e. frequencies) Common values Most typical value Distribution of frequencies 40
42 Bivariate Quantitative-Quantitative Qualitative-Quantitative Qualitative-Qualitative In general we care about association (correlation, relationships) 41
43 Multivariate Quantitative Qualitative Mixed In general we care about association (correlation, relationships) 42
44 What about individuals? Resemblance Similarities and disimilarities Typologies 43
Diagrams and Graphs of Statistical Data
 Diagrams and Graphs of Statistical Data One of the most effective and interesting alternative way in which a statistical data may be presented is through diagrams and graphs. There are several ways in
Visualizing Data. Contents. 1 Visualizing Data. Anthony Tanbakuchi Department of Mathematics Pima Community College. Introductory Statistics Lectures
 Introductory Statistics Lectures Visualizing Data Descriptive Statistics I Department of Mathematics Pima Community College Redistribution of this material is prohibited without written permission of the
Lecture 2: Descriptive Statistics and Exploratory Data Analysis
 Lecture 2: Descriptive Statistics and Exploratory Data Analysis Further Thoughts on Experimental Design 16 Individuals (8 each from two populations) with replicates Pop 1 Pop 2 Randomly sample 4 individuals
Data exploration with Microsoft Excel: analysing more than one variable
 Data exploration with Microsoft Excel: analysing more than one variable Contents 1 Introduction... 1 2 Comparing different groups or different variables... 2 3 Exploring the association between categorical
Visualization and descriptive statistics. D.A. Forsyth
 Visualization and descriptive statistics D.A. Forsyth What s going on here? Most important, most creative scientific question Getting answers Make helpful pictures and look at them Compute numbers in support
Unresolved issues with the course, grades, or instructor, should be taken to the point of contact.
 Graphics and Data Visualization CS1501 Fall 2013 Syllabus Course Description With the advent of powerful data-mining technologies, engineers in all disciplines are increasingly expected to be conscious
4.1 Exploratory Analysis: Once the data is collected and entered, the first question is: "What do the data look like?"
 Data Analysis Plan The appropriate methods of data analysis are determined by your data types and variables of interest, the actual distribution of the variables, and the number of cases. Different analyses
Effective Big Data Visualization
 Effective Big Data Visualization Every Picture Tells A Story Don t It? Mark Gamble Dir Technical Marketing Actuate Corporation 1 Data Driven Summit 2014 Agenda What is data visualization? What is good?
Algebra 1 2008. Academic Content Standards Grade Eight and Grade Nine Ohio. Grade Eight. Number, Number Sense and Operations Standard
 Academic Content Standards Grade Eight and Grade Nine Ohio Algebra 1 2008 Grade Eight STANDARDS Number, Number Sense and Operations Standard Number and Number Systems 1. Use scientific notation to express
LAGUARDIA COMMUNITY COLLEGE CITY UNIVERSITY OF NEW YORK DEPARTMENT OF MATHEMATICS, ENGINEERING, AND COMPUTER SCIENCE
 LAGUARDIA COMMUNITY COLLEGE CITY UNIVERSITY OF NEW YORK DEPARTMENT OF MATHEMATICS, ENGINEERING, AND COMPUTER SCIENCE MAT 119 STATISTICS AND ELEMENTARY ALGEBRA 5 Lecture Hours, 2 Lab Hours, 3 Credits Pre-
Section Format Day Begin End Building Rm# Instructor. 001 Lecture Tue 6:45 PM 8:40 PM Silver 401 Ballerini
 NEW YORK UNIVERSITY ROBERT F. WAGNER GRADUATE SCHOOL OF PUBLIC SERVICE Course Syllabus Spring 2016 Statistical Methods for Public, Nonprofit, and Health Management Section Format Day Begin End Building
The Comparisons. Grade Levels Comparisons. Focal PSSM K-8. Points PSSM CCSS 9-12 PSSM CCSS. Color Coding Legend. Not Identified in the Grade Band
 Comparison of NCTM to Dr. Jim Bohan, Ed.D Intelligent Education, LLC [email protected] The Comparisons Grade Levels Comparisons Focal K-8 Points 9-12 pre-k through 12 Instructional programs from prekindergarten
The importance of graphing the data: Anscombe s regression examples
 The importance of graphing the data: Anscombe s regression examples Bruce Weaver Northern Health Research Conference Nipissing University, North Bay May 30-31, 2008 B. Weaver, NHRC 2008 1 The Objective
BNG 202 Biomechanics Lab. Descriptive statistics and probability distributions I
 BNG 202 Biomechanics Lab Descriptive statistics and probability distributions I Overview The overall goal of this short course in statistics is to provide an introduction to descriptive and inferential
Why Taking This Course? Course Introduction, Descriptive Statistics and Data Visualization. Learning Goals. GENOME 560, Spring 2012
 Why Taking This Course? Course Introduction, Descriptive Statistics and Data Visualization GENOME 560, Spring 2012 Data are interesting because they help us understand the world Genomics: Massive Amounts
Univariate Regression
 Univariate Regression Correlation and Regression The regression line summarizes the linear relationship between 2 variables Correlation coefficient, r, measures strength of relationship: the closer r is
Exploratory Data Analysis with R. @matthewrenze #codemash
 Exploratory Data Analysis with R @matthewrenze #codemash Motivation The ability to take data to be able to understand it, to process it, to extract value from it, to visualize it, to communicate it that
Descriptive statistics parameters: Measures of centrality
 Descriptive statistics parameters: Measures of centrality Contents Definitions... 3 Classification of descriptive statistics parameters... 4 More about central tendency estimators... 5 Relationship between
A Correlation of. to the. South Carolina Data Analysis and Probability Standards
 A Correlation of to the South Carolina Data Analysis and Probability Standards INTRODUCTION This document demonstrates how Stats in Your World 2012 meets the indicators of the South Carolina Academic Standards
DATA ANALYSIS. QEM Network HBCU-UP Fundamentals of Education Research Workshop Gerunda B. Hughes, Ph.D. Howard University
 DATA ANALYSIS QEM Network HBCU-UP Fundamentals of Education Research Workshop Gerunda B. Hughes, Ph.D. Howard University Quantitative Research What is Statistics? Statistics (as a subject) is the science
STATS8: Introduction to Biostatistics. Data Exploration. Babak Shahbaba Department of Statistics, UCI
 STATS8: Introduction to Biostatistics Data Exploration Babak Shahbaba Department of Statistics, UCI Introduction After clearly defining the scientific problem, selecting a set of representative members
Visualizing Data from Government Census and Surveys: Plans for the Future
 Censuses and Surveys of Governments: A Workshop on the Research and Methodology behind the Estimates Visualizing Data from Government Census and Surveys: Plans for the Future Kerstin Edwards March 15,
Algebra 1 Course Information
 Course Information Course Description: Students will study patterns, relations, and functions, and focus on the use of mathematical models to understand and analyze quantitative relationships. Through
Data Visualisation and Its Application in Official Statistics. Olivia Or Census and Statistics Department, Hong Kong, China [email protected].
 Data Visualisation and Its Application in Official Statistics Olivia Or Census and Statistics Department, Hong Kong, China [email protected] Abstract Data visualisation has been a growing topic of
COM CO P 5318 Da t Da a t Explora Explor t a ion and Analysis y Chapte Chapt r e 3
 COMP 5318 Data Exploration and Analysis Chapter 3 What is data exploration? A preliminary exploration of the data to better understand its characteristics. Key motivations of data exploration include Helping
Exploratory data analysis (Chapter 2) Fall 2011
 Fall 2011") Exploratory data analysis (Chapter 2) Fall 2011 Data Examples Example 1: Survey Data 1 Data collected from a Stat 371 class in Fall 2005 2 They answered questions about their: gender, major, year in school,
Exploratory data analysis (Chapter 2) Fall 2011 Data Examples Example 1: Survey Data 1 Data collected from a Stat 371 class in Fall 2005 2 They answered questions about their: gender, major, year in school,
BANA6037 Data Visualization Fall Semester 2014 (14FS) / First Half Session Section 001 S 9:00a- 12:50p Lindner 107
 / First Half Session Section 001 S 9:00a- 12:50p Lindner 107") BANA6037 Data Visualization Fall Semester 2014 (14FS) / First Half Session Section 001 S 9:00a- 12:50p Lindner 107 Instructors: Jeffrey A. Shaffer Vice President, IT and Analytics, Unifund [email protected]
BANA6037 Data Visualization Fall Semester 2014 (14FS) / First Half Session Section 001 S 9:00a- 12:50p Lindner 107 Instructors: Jeffrey A. Shaffer Vice President, IT and Analytics, Unifund [email protected]
Fairfield Public Schools
 Mathematics Fairfield Public Schools AP Statistics AP Statistics BOE Approved 04/08/2014 1 AP STATISTICS Critical Areas of Focus AP Statistics is a rigorous course that offers advanced students an opportunity
Introduction. Chapter 1. 1.1 Before you start. 1.1.1 Formulation
 Chapter 1 Introduction 1.1 Before you start Statistics starts with a problem, continues with the collection of data, proceeds with the data analysis and finishes with conclusions. It is a common mistake
CRLS Mathematics Department Algebra I Curriculum Map/Pacing Guide
 Curriculum Map/Pacing Guide page 1 of 14 Quarter I start (CP & HN) 170 96 Unit 1: Number Sense and Operations 24 11 Totals Always Include 2 blocks for Review & Test Operating with Real Numbers: How are
Multivariate Logistic Regression
 1 Multivariate Logistic Regression As in univariate logistic regression, let π(x) represent the probability of an event that depends on p covariates or independent variables. Then, using an inv.logit formulation
STAT355 - Probability & Statistics
 STAT355 - Probability & Statistics Instructor: Kofi Placid Adragni Fall 2011 Chap 1 - Overview and Descriptive Statistics 1.1 Populations, Samples, and Processes 1.2 Pictorial and Tabular Methods in Descriptive
AP STATISTICS REVIEW (YMS Chapters 1-8)
") AP STATISTICS REVIEW (YMS Chapters 1-8) Exploring Data (Chapter 1) Categorical Data nominal scale, names e.g. male/female or eye color or breeds of dogs Quantitative Data rational scale (can +,,, with
AP STATISTICS REVIEW (YMS Chapters 1-8) Exploring Data (Chapter 1) Categorical Data nominal scale, names e.g. male/female or eye color or breeds of dogs Quantitative Data rational scale (can +,,, with
Center: Finding the Median. Median. Spread: Home on the Range. Center: Finding the Median (cont.)
") Center: Finding the Median When we think of a typical value, we usually look for the center of the distribution. For a unimodal, symmetric distribution, it s easy to find the center it s just the center
Center: Finding the Median When we think of a typical value, we usually look for the center of the distribution. For a unimodal, symmetric distribution, it s easy to find the center it s just the center
DESCRIPTIVE STATISTICS AND EXPLORATORY DATA ANALYSIS
 DESCRIPTIVE STATISTICS AND EXPLORATORY DATA ANALYSIS SEEMA JAGGI Indian Agricultural Statistics Research Institute Library Avenue, New Delhi - 110 012 [email protected] 1. Descriptive Statistics Statistics
business statistics using Excel OXFORD UNIVERSITY PRESS Glyn Davis & Branko Pecar
 business statistics using Excel Glyn Davis & Branko Pecar OXFORD UNIVERSITY PRESS Detailed contents Introduction to Microsoft Excel 2003 Overview Learning Objectives 1.1 Introduction to Microsoft Excel
Data Exploration Data Visualization
 Data Exploration Data Visualization What is data exploration? A preliminary exploration of the data to better understand its characteristics. Key motivations of data exploration include Helping to select
Lecture 2. Summarizing the Sample
 Lecture 2 Summarizing the Sample WARNING: Today s lecture may bore some of you It s (sort of) not my fault I m required to teach you about what we re going to cover today. I ll try to make it as exciting
Organizing Your Approach to a Data Analysis
 Biost/Stat 578 B: Data Analysis Emerson, September 29, 2003 Handout #1 Organizing Your Approach to a Data Analysis The general theme should be to maximize thinking about the data analysis and to minimize
Vertical Alignment Colorado Academic Standards 6 th - 7 th - 8 th
 Vertical Alignment Colorado Academic Standards 6 th - 7 th - 8 th Standard 3: Data Analysis, Statistics, and Probability 6 th Prepared Graduates: 1. Solve problems and make decisions that depend on un
The Big Picture. Describing Data: Categorical and Quantitative Variables Population. Descriptive Statistics. Community Coalitions (n = 175)
") Describing Data: Categorical and Quantitative Variables Population The Big Picture Sampling Statistical Inference Sample Exploratory Data Analysis Descriptive Statistics In order to make sense of data,
Describing Data: Categorical and Quantitative Variables Population The Big Picture Sampling Statistical Inference Sample Exploratory Data Analysis Descriptive Statistics In order to make sense of data,
Healthcare data analytics. Da-Wei Wang Institute of Information Science [email protected]
 Healthcare data analytics Da-Wei Wang Institute of Information Science [email protected] Outline Data Science Enabling technologies Grand goals Issues Google flu trend Privacy Conclusion Analytics
2. Filling Data Gaps, Data validation & Descriptive Statistics
 2. Filling Data Gaps, Data validation & Descriptive Statistics Dr. Prasad Modak Background Data collected from field may suffer from these problems Data may contain gaps ( = no readings during this period)
with functions, expressions and equations which follow in units 3 and 4.
 Grade 8 Overview View unit yearlong overview here The unit design was created in line with the areas of focus for grade 8 Mathematics as identified by the Common Core State Standards and the PARCC Model
Simple Predictive Analytics Curtis Seare
 Using Excel to Solve Business Problems: Simple Predictive Analytics Curtis Seare Copyright: Vault Analytics July 2010 Contents Section I: Background Information Why use Predictive Analytics? How to use
PROPERTIES OF THE SAMPLE CORRELATION OF THE BIVARIATE LOGNORMAL DISTRIBUTION
 PROPERTIES OF THE SAMPLE CORRELATION OF THE BIVARIATE LOGNORMAL DISTRIBUTION Chin-Diew Lai, Department of Statistics, Massey University, New Zealand John C W Rayner, School of Mathematics and Applied Statistics,
Overview of InfoVis. Exercise. Get out pencil and paper. CS 7450 - Information Visualization Aug. 19, 2015 John Stasko. Fall 2015 CS 7450 2
 Overview of InfoVis CS 7450 - Information Visualization Aug. 19, 2015 John Stasko Exercise Get out pencil and paper Fall 2015 CS 7450 2 1 Data Fall 2015 CS 7450 4 2 Data Overload Confound: How to make
Security visualisation
 Security visualisation This thesis provides a guideline of how to generate a visual representation of a given dataset and use visualisation in the evaluation of known security vulnerabilities by Marco
Introduction to Regression and Data Analysis
 Statlab Workshop Introduction to Regression and Data Analysis with Dan Campbell and Sherlock Campbell October 28, 2008 I. The basics A. Types of variables Your variables may take several forms, and it
Common Core Unit Summary Grades 6 to 8
 Common Core Unit Summary Grades 6 to 8 Grade 8: Unit 1: Congruence and Similarity- 8G1-8G5 rotations reflections and translations,( RRT=congruence) understand congruence of 2 d figures after RRT Dilations
Business Statistics. Successful completion of Introductory and/or Intermediate Algebra courses is recommended before taking Business Statistics.
 Business Course Text Bowerman, Bruce L., Richard T. O'Connell, J. B. Orris, and Dawn C. Porter. Essentials of Business, 2nd edition, McGraw-Hill/Irwin, 2008, ISBN: 978-0-07-331988-9. Required Computing
Intro to Parametric & Nonparametric Statistics
 Intro to Parametric & Nonparametric Statistics Kinds & definitions of nonparametric statistics Where parametric stats come from Consequences of parametric assumptions Organizing the models we will cover
Data Visualization in R
 Data Visualization in R L. Torgo [email protected] Faculdade de Ciências / LIAAD-INESC TEC, LA Universidade do Porto Oct, 2014 Introduction Motivation for Data Visualization Humans are outstanding at detecting
Descriptive statistics Statistical inference statistical inference, statistical induction and inferential statistics
 Descriptive statistics is the discipline of quantitatively describing the main features of a collection of data. Descriptive statistics are distinguished from inferential statistics (or inductive statistics),
Data Mining: Exploring Data. Lecture Notes for Chapter 3. Introduction to Data Mining
 Data Mining: Exploring Data Lecture Notes for Chapter 3 Introduction to Data Mining by Tan, Steinbach, Kumar Tan,Steinbach, Kumar Introduction to Data Mining 8/05/2005 1 What is data exploration? A preliminary
Data Mining: Exploring Data. Lecture Notes for Chapter 3. Introduction to Data Mining
 Data Mining: Exploring Data Lecture Notes for Chapter 3 Introduction to Data Mining by Tan, Steinbach, Kumar What is data exploration? A preliminary exploration of the data to better understand its characteristics.
Representing Data Using Frequency Graphs
 Lesson 25 Mathematics Assessment Project Formative Assessment Lesson Materials Representing Data Using Graphs MARS Shell Center University of Nottingham & UC Berkeley Alpha Version If you encounter errors
 T O P I C 1 2 Techniques and tools for data analysis Preview Introduction In chapter 3 of Statistics In A Day different combinations of numbers and types of variables are presented. We go through these
430 Statistics and Financial Mathematics for Business
 Prescription: 430 Statistics and Financial Mathematics for Business Elective prescription Level 4 Credit 20 Version 2 Aim Students will be able to summarise, analyse, interpret and present data, make predictions
An introduction to using Microsoft Excel for quantitative data analysis
 Contents An introduction to using Microsoft Excel for quantitative data analysis 1 Introduction... 1 2 Why use Excel?... 2 3 Quantitative data analysis tools in Excel... 3 4 Entering your data... 6 5 Preparing
Analyzing Experimental Data
 Analyzing Experimental Data The information in this chapter is a short summary of some topics that are covered in depth in the book Students and Research written by Cothron, Giese, and Rezba. See the end
Chapter 13 Introduction to Linear Regression and Correlation Analysis
 Chapter 3 Student Lecture Notes 3- Chapter 3 Introduction to Linear Regression and Correlation Analsis Fall 2006 Fundamentals of Business Statistics Chapter Goals To understand the methods for displaing
Math 1. Month Essential Questions Concepts/Skills/Standards Content Assessment Areas of Interaction
 Binghamton High School Rev.9/21/05 Math 1 September What is the unknown? Model relationships by using Fundamental skills of 2005 variables as a shorthand way Algebra Why do we use variables? What is a
SPSS Guide: Regression Analysis
 SPSS Guide: Regression Analysis I put this together to give you a step-by-step guide for replicating what we did in the computer lab. It should help you run the tests we covered. The best way to get familiar
Exploratory Data Analysis
 Exploratory Data Analysis Johannes Schauer [email protected] Institute of Statistics Graz University of Technology Steyrergasse 17/IV, 8010 Graz www.statistics.tugraz.at February 12, 2008 Introduction
R and Rcmdr : Basic Functions for Managing Data
 Jaila Page 1 R and Rcmdr : Basic Functions for Managing Data Key issues in using R for a data analysis: Difference between numeric variables and factors in R/Rcmdr Load data either by entering manually,
Business Intelligence and Process Modelling
 Business Intelligence and Process Modelling F.W. Takes Universiteit Leiden Lecture 2: Business Intelligence & Visual Analytics BIPM Lecture 2: Business Intelligence & Visual Analytics 1 / 72 Business Intelligence
PREPARING TO TEACH DATA ANALYSIS AND PROBABILITY WITH TECHNOLOGY
 PREPARING TO TEACH DATA ANALYSIS AND PROBABILITY WITH TECHNOLOGY Hollylynne S. Lee and Karen F. Hollebrands North Carolina State University, United States of America [email protected] Developing the
Course Text. Required Computing Software. Course Description. Course Objectives. StraighterLine. Business Statistics
 Course Text Business Statistics Lind, Douglas A., Marchal, William A. and Samuel A. Wathen. Basic Statistics for Business and Economics, 7th edition, McGraw-Hill/Irwin, 2010, ISBN: 9780077384470 [This
Bachelor's Degree in Business Administration and Master's Degree course description
 Bachelor's Degree in Business Administration and Master's Degree course description Bachelor's Degree in Business Administration Department s Compulsory Requirements Course Description (402102) Principles
an introduction to VISUALIZING DATA by joel laumans
 an introduction to VISUALIZING DATA by joel laumans an introduction to VISUALIZING DATA iii AN INTRODUCTION TO VISUALIZING DATA by Joel Laumans Table of Contents 1 Introduction 1 Definition Purpose 2 Data
Data Visualization Basics for Students
 Data Visualization Basics for Students Dionisia de la Cerda Think about Your Message You want your audience to understand your message. This takes time. Think about your audience and plan your message.
Data Mining: Exploring Data. Lecture Notes for Chapter 3. Slides by Tan, Steinbach, Kumar adapted by Michael Hahsler
 Data Mining: Exploring Data Lecture Notes for Chapter 3 Slides by Tan, Steinbach, Kumar adapted by Michael Hahsler Topics Exploratory Data Analysis Summary Statistics Visualization What is data exploration?
Introduction to Statistics for Psychology. Quantitative Methods for Human Sciences
 Introduction to Statistics for Psychology and Quantitative Methods for Human Sciences Jonathan Marchini Course Information There is website devoted to the course at http://www.stats.ox.ac.uk/ marchini/phs.html
II. DISTRIBUTIONS distribution normal distribution. standard scores
 Appendix D Basic Measurement And Statistics The following information was developed by Steven Rothke, PhD, Department of Psychology, Rehabilitation Institute of Chicago (RIC) and expanded by Mary F. Schmidt,
How To Write A Data Analysis
 Mathematics Probability and Statistics Curriculum Guide Revised 2010 This page is intentionally left blank. Introduction The Mathematics Curriculum Guide serves as a guide for teachers when planning instruction
?????? Data Analytics
 ?????? Data Analytics Prof. Dr.-Ing. Lars Linsen Prof. Dr. Adalbert FX Wilhelm Fall 2015 0. Organizational Stuff 0.1 Syllabus and Organization Data Analytics 3 Course website http://www.faculty.jacobsuniversity.de/llinsen/teaching/??????.htm
Survey Data Analysis. Qatar University. Dr. Kenneth M.Coleman ([email protected]) - University of Michigan
 - University of Michigan") The following slides are the property of their authors and are provided on this website as a public service. Please do not copy or redistribute these slides without the written permission of all of the
The following slides are the property of their authors and are provided on this website as a public service. Please do not copy or redistribute these slides without the written permission of all of the
Get The Picture: Visualizing Financial Data part 1
 Get The Picture: Visualizing Financial Data part 1 by Jeremy Walton Turning numbers into pictures is usually the easiest way of finding out what they mean. We're all familiar with the display of for example
1) Write the following as an algebraic expression using x as the variable: Triple a number subtracted from the number
 Write the following as an algebraic expression using x as the variable: Triple a number subtracted from the number") 1) Write the following as an algebraic expression using x as the variable: Triple a number subtracted from the number A. 3(x - x) B. x 3 x C. 3x - x D. x - 3x 2) Write the following as an algebraic expression
1) Write the following as an algebraic expression using x as the variable: Triple a number subtracted from the number A. 3(x - x) B. x 3 x C. 3x - x D. x - 3x 2) Write the following as an algebraic expression
Data exploration with Microsoft Excel: univariate analysis
 Data exploration with Microsoft Excel: univariate analysis Contents 1 Introduction... 1 2 Exploring a variable s frequency distribution... 2 3 Calculating measures of central tendency... 16 4 Calculating
Session 7 Bivariate Data and Analysis
 Session 7 Bivariate Data and Analysis Key Terms for This Session Previously Introduced mean standard deviation New in This Session association bivariate analysis contingency table co-variation least squares
Module 3: Correlation and Covariance
 Using Statistical Data to Make Decisions Module 3: Correlation and Covariance Tom Ilvento Dr. Mugdim Pašiƒ University of Delaware Sarajevo Graduate School of Business O ften our interest in data analysis
Iris Sample Data Set. Basic Visualization Techniques: Charts, Graphs and Maps. Summary Statistics. Frequency and Mode
 Iris Sample Data Set Basic Visualization Techniques: Charts, Graphs and Maps CS598 Information Visualization Spring 2010 Many of the exploratory data techniques are illustrated with the Iris Plant data
Tableau's data visualization software is provided through the Tableau for Teaching program.
 A BEGINNER S GUIDE TO VISUALIZATION Featuring REU Site Collaborative Data Visualization Applications June 10, 2014 Vetria L. Byrd, PhD Advanced Visualization, Director REU Coordinator Visualization Scientist
For example, estimate the population of the United States as 3 times 10⁸ and the
 CCSS: Mathematics The Number System CCSS: Grade 8 8.NS.A. Know that there are numbers that are not rational, and approximate them by rational numbers. 8.NS.A.1. Understand informally that every number
Introduction to Statistics and Quantitative Research Methods
 Introduction to Statistics and Quantitative Research Methods Purpose of Presentation To aid in the understanding of basic statistics, including terminology, common terms, and common statistical methods.
Data Visualization Techniques
 Data Visualization Techniques From Basics to Big Data with SAS Visual Analytics WHITE PAPER SAS White Paper Table of Contents Introduction.... 1 Generating the Best Visualizations for Your Data... 2 The
Exercise 1.12 (Pg. 22-23)
") Individuals: The objects that are described by a set of data. They may be people, animals, things, etc. (Also referred to as Cases or Records) Variables: The characteristics recorded about each individual.
Individuals: The objects that are described by a set of data. They may be people, animals, things, etc. (Also referred to as Cases or Records) Variables: The characteristics recorded about each individual.
List of Examples. Examples 319
 Examples 319 List of Examples DiMaggio and Mantle. 6 Weed seeds. 6, 23, 37, 38 Vole reproduction. 7, 24, 37 Wooly bear caterpillar cocoons. 7 Homophone confusion and Alzheimer s disease. 8 Gear tooth strength.
Statistics. Measurement. Scales of Measurement 7/18/2012
 Statistics Measurement Measurement is defined as a set of rules for assigning numbers to represent objects, traits, attributes, or behaviors A variableis something that varies (eye color), a constant does
Computation of the Aggregate Claim Amount Distribution Using R and actuar. Vincent Goulet, Ph.D.
 Computation of the Aggregate Claim Amount Distribution Using R and actuar Vincent Goulet, Ph.D. Actuarial Risk Modeling Process 1 Model costs at the individual level Modeling of loss distributions 2 Aggregate
240ST014 - Data Analysis of Transport and Logistics
 Coordinating unit: Teaching unit: Academic year: Degree: ECTS credits: 2015 240 - ETSEIB - Barcelona School of Industrial Engineering 715 - EIO - Department of Statistics and Operations Research MASTER'S
Big Data in Pictures: Data Visualization
 Big Data in Pictures: Data Visualization Huamin Qu Hong Kong University of Science and Technology What is data visualization? Data visualization is the creation and study of the visual representation of
Pennsylvania System of School Assessment
 Pennsylvania System of School Assessment The Assessment Anchors, as defined by the Eligible Content, are organized into cohesive blueprints, each structured with a common labeling system that can be read
Data Mining. Dr. Saed Sayad. University of Toronto 2010 [email protected]. http://chem-eng.utoronto.ca/~datamining/
 Data Mining Dr. Saed Sayad University of Toronto 2010 [email protected] http://chem-eng.utoronto.ca/~datamining/ 1 Data Mining Data mining is about explaining the past and predicting the future by
Grade 6 Mathematics Assessment. Eligible Texas Essential Knowledge and Skills
 Grade 6 Mathematics Assessment Eligible Texas Essential Knowledge and Skills STAAR Grade 6 Mathematics Assessment Mathematical Process Standards These student expectations will not be listed under a separate