PHYLOGENETIC ANALYSIS
|
|
|
- Erin Lindsey
- 10 years ago
- Views:
Transcription
1 Bioinformatics: A Practical Guide to the Analysis of Genes and Proteins, Second Edition Andreas D. Baxevanis, B.F. Francis Ouellette Copyright 2001 John Wiley & Sons, Inc. ISBNs: (Hardback); (Paper); (Electronic) 14 PHYLOGENETIC ANALYSIS Fiona S. L. Brinkman Department of Microbiology and Immunology University of British Columbia Vancouver, British Columbia, Canada Detlef D. Leipe National Center for Biotechnology Information National Library of Medicine National Institutes of Health Bethesda, Maryland Phylogenetics is the study of evolutionary relationships. Phylogenetic analysis is the means of inferring or estimating these relationships. The evolutionary history inferred from phylogenetic analysis is usually depicted as branching, treelike diagrams that represent an estimated pedigree of the inherited relationships among molecules ( gene trees ), organisms, or both. Phylogenetics is sometimes called cladistics because the word clade, a set of descendants from a single ancestor, is derived from the Greek word for branch. However, cladistics is a particular method of hypothesizing about evolutionary relationships. The basic tenet behind cladistics is that members of a group or clade share a common evolutionary history and are more related to each other than to members of another group. A given group is recognized by sharing unique features that were not present in distant ancestors. These shared, derived characteristics can be anything that can be observed and described from two organisms having developed a spine to two sequences having developed a mutation at a certain base pair of a gene. Usually, cladistic analysis is performed by comparing multiple characteristics or characters at once, either multiple phenotypic characters or multiple base pairs or amino acids in a sequence. 323

2 324 PHYLOGENETIC ANALYSIS There are three basic assumptions in cladistics: Any group of organisms is related by descent from a common ancestor (fundamental tenet of evolutionary theory). There is a bifurcating pattern of cladogenesis. This assumption is controversial. Change in characteristics occurs in lineages over time. This is a necessary condition for cladistics to work. The resulting relationships from cladistic analysis are most commonly represented by a phylogenetic tree: A node Human Mouse A clade Fly Even with this simple tree, a number of terms that are used frequently in phylogenetic analysis can be introduced: A clade is a monophyletic taxon. Clades are groups of organisms or genes that include the most recent common ancestor of all of its members and all of the descendants of that most recent common ancestor. Clade is derived from the Greek word klados, meaning branch or twig. Ataxon is any named group of organisms but not necessarily a clade. In some analyses, branch lengths correspond to divergence (e.g., in the above example, mouse is slightly more related to fly than human is to fly). A node is a bifurcating branch point. Macromolecules, especially sequences, have surpassed morphological and other organismal characters as the most popular form of data for phylogenetic or cladistic analysis. It is this molecular phylogenetic analysis that we will introduce here. It is unrealistic to believe that an all-purpose phylogenetic analysis recipe can be delineated (Hillis et al., 1993). Although numerous phylogenetic algorithms, procedures, and computer programs have been devised, their reliability and practicality are, in all cases, dependent on the structure and size of the data. The merits and pitfalls of various methods are the subject of often acrimonious debates in taxonomic and phylogenetic journals. Some of these debates are summarized in a series of useful reviews of phylogenetics (Saitou, 1996; Li, 1997; Swofford et al., 1996). An especially concise introduction to molecular phylogenetics is provided by Hillis et al. (1993). The danger of generating incorrect results is inherently greater in computational phylogenetics than in many other fields of science. The events yielding a phylogeny happened in the past and can only be inferred or estimated (with a few exceptions,

3 FUNDAMENTAL ELEMENTS OF PHYLOGENETIC MODELS 325 see Hillis et al., 1994). Despite the well-documented limitations of available phylogenetic procedures, current biological literature is replete with examples of conclusions derived from the results of analyses in which data had been simply run through one or another phylogeny program. Occasionally, the limiting factor in phylogenetic analysis is not so much the computational method used; more often than not, the limiting factor is the users understanding of what the method is actually doing with the data. This brief guide to phylogenetic analysis has several objectives. First, a conceptual approach that describes some of the most important principles underlying the most widely and easily applied methods of phylogenetic analyses of biological sequences and their interpretation will be introduced. The aim is to show that practical phylogenetic analysis should be conceived as a search for a correct model, as much as a search for the correct tree. In this context, some of the particular models assumed by various popular methods and how these models might affect analysis of particular data sets will be discussed. Finally, some examples of the application of particular methods to the inferences of evolutionary history are provided. Note that the principles for DNA analysis will be initially discussed, although most also apply to protein sequences (except where further description of protein sequences is indicated). As there is a growing interest in the analysis of protein sequences, the reader is directed to further descriptions of protein-specific problems, as reviewed by Felsenstein (1996). FUNDAMENTAL ELEMENTS OF PHYLOGENETIC MODELS Phylogenetic tree-building methods presume particular evolutionary models. For a given data set, these models can be violated because of occurrences such as the transfer of genetic material between organisms. Thus, when interpreting a given analysis, one should always consider the model used and its assumptions and entertain other possible explanations for the observed results. As an example, consider the tree in Figure An investigation of organismal relationships in the tree suggests the eukaryote 1 is more related to the bacteria than to the other eukaryotes. Because the vast majority of other cladistic analyses, including those based on morphological features, suggest that eukaryote 1 is more related to the other eukaryotes than to bacteria, we suspect that for this analysis the assumptions of a bifurcating pattern of evolution are incorrect. We suspect that horizontal gene transfer from an ancestor of the bacteria 1, 2, and 3 to the ancestor of eukaryote 1 occurred because this would most simply explain the results. Models inherent in phylogenetics methods make additional default assumptions: 1. The sequence is correct and originates from the specified source. 2. The sequences are homologous (i.e., are all descended in some way from a shared ancestral sequence). 3. Each position in a sequence alignment is homologous with every other in that alignment. 4. Each of the multiple sequences included in a common analysis has a common phylogenetic history with the others (e.g., there are no mixtures of nuclear and organellar sequences).

4 326 PHYLOGENETIC ANALYSIS Figure Example of a phylogenetic tree based on genes that do not match organismal phylogeny, suggesting horizontal gene transfer has occurred. The ancestor of protozoan eukaryote 1 (underlined and marked with an arrow) appears to have obtained the gene from the ancestor of Bacteria 1, 2, and 3, as this is the simplest explanation for the results. This unexpected result is not without precedent: there have been a number of reported phylogenetic analyses that suggest that protozoa have taken up genes from bacteria, most likely from bacteria that they have ingested. 5. The sampling of taxa is adequate to resolve the problem of interest. 6. Sequence variation among the samples is representative of the broader group of interest. 7. The sequence variability in the sample contains phylogenetic signal adequate to resolve the problem of interest. There are additional assumptions that are defaults in some methods but can be at least partially corrected for in others: 1. The sequences in the sample evolved according to a single stochastic process. 2. All positions in the sequence evolved according to the same stochastic process. 3. Each position in the sequence evolved independently. Errors in published phylogenetic analyses can often be attributed to violations of one or more of the foregoing assumptions. Every sequence data set must be

5 PHYLOGENETIC DATA ANALYSIS: THE FOUR STEPS 327 evaluated against these assumptions, with other possible explanations for the observed results considered. TREE INTERPRETATION THE IMPORTANCE OF IDENTIFYING PARALOGS AND ORTHOLOGS As more genomes are sequenced, we are becoming more interested in learning about protein or gene evolution (i.e., investigating gene phylogeny, rather than organismal phylogeny). This can aid our understanding of the function of proteins and genes. Studies of protein and gene evolution involve the comparison of homologs sequences that have common origins but may or may not have common activity. Sequences that share an arbitrary, threshold level of similarity determined by alignment of matching bases are termed homologous. They are inherited from a common ancestor that possessed similar structure, although the structure of the ancestor may be difficult to determine because it has been modified through descent. Homologs are most commonly either orthologs, paralogs, or xenologs. Orthologs are homologs produced by speciation. They represent genes derived from a common ancestor that diverged due to divergence of the organisms they are associated with. They tend to have similar function. Paralogs are homologs produced by gene duplication. They represent genes derived from a common ancestral gene that duplicated within an organism and then subsequently diverged. They tend to have different functions. Xenologs are homologs resulting from horizontal gene transfer between two organisms. The determination of whether a gene of interest was recently transferred into the current host by horizontal gene transfer is often difficult. Occasionally, the %(G C) content may be so vastly different from the average gene in the current host that a conclusion of external origin is nearly inescapable, however often it is unclear whether a gene has horizontal origins. Function of xenologs can be variable depending on how significant the change in context was for the horizontally moving gene; however, in general, the function tends to be similar. An example of how the identification of orthologs and paralogs can be used to aid prediction of protein function is illustrated in Figure PHYLOGENETIC DATA ANALYSIS: THE FOUR STEPS A straightforward phylogenetic analysis consists of four steps: 1. Alignment (both building the data model and extracting a phylogenetic dataset) 2. Determining the substitution model 3. Tree building 4. Tree evaluation

6 328 PHYLOGENETIC ANALYSIS Figure Insight into protein function from an investigation of paralogs and orthologs an example. Pseudomonas aeruginosa, a bacteria that is one of the top three causes of opportunistic infections, is noted for its antimicrobial resistance and resistance to detergents. Three homologous outer membrane proteins, OprJ, OpM, and OprN, have been identified as playing a role in this antimicrobial resistance, by pumping different antimicrobials out of the cell as they entered. When the genome of this bacterium was sequenced, it was found that there were no less than 14 homologs of the genes encoding these three proteins (given names starting with Opm ). Phylogenetic analysis of these protein sequences, using the neighbor joining distance method within the PHYLIP 5.3 package, showed that this 17-member family was divided into two clades, one containing all three genes with roles in antimicrobial efflux pumps (underlined italics). Two members of the other clade were found to share highest similarity with proteins AprF and TolC from another organism, E. coli. AprF and TolC are both involved in secreting proteins. This analysis allowed us to hypothesize that the clade containing OprM, OprJ, and OprN, nicknamed the OprM family, comprises a series of paralogous genes involved in efflux of different antimicrobials or antimicrobial-like compounds. The other cluster with homologs to AprF and TolC may be a functionally rated group of paralogs involved in secretion of proteins (of which OpmM appears to be the ortholog of AprF and OpmH is likely the ortholog of TolC). Currently, efforts are expanding to characterize P. aeruginosa with mutations in these genes to evaluate their ability to efflux antimicrobials. This phylogenetic analysis allows us to prioritize the analysis of genes in this extended family, analyzing the OprM family genes first as they are more likely to have the functions of interest. This tree was drawn using Treeview. Each step is critical for the analysis and should be handled accordingly. For example, trees are only as good as the alignment they are based on. When performing a phylogenetic analysis, it often insightful to build trees based on different modifications of the alignment to see how the alignment proposed influences the resulting tree.
.")
7 ALIGNMENT: BUILDING THE DATA MODEL 329 ALIGNMENT: BUILDING THE DATA MODEL Phylogenetic sequence data usually consist of multiple sequence alignments; the individual, aligned-base positions are commonly referred to as sites. These sites are equivalent to characters in theoretical phylogenetic discussions, and the actual base (or gap) occupying a site is the character state. Multiple alignment methods are reviewed in Chapter 9. This chapter reviews similar alignment methods in the context of phylogenetic analysis. Aligned sequence positions subjected to phylogenetic analysis represent a priori phylogenetic conclusions because the sites themselves (not the actual bases) are effectively assumed to be genealogically related, or homologous. Sites at which one is confident of homology and that contain changes in character states useful for the given phylogenetic analysis are often referred to as informative sites. Steps in building the alignment include selection of the alignment procedure(s) and extraction of a phylogenetic data set from the alignment. The latter procedure requires determination of how ambiguously aligned regions and insertion/deletions (referred to as indels, or gaps) will be treated in the tree-building procedure. A typical alignment procedure involves the application of a program such as CLUSTAL W, followed by manual alignment editing and submission to a treebuilding program. This procedure should be performed with the following questions and considerations in mind: How much computer dependence? Fully computational multiple alignment is sometimes advocated on the grounds that manual editing is inexplicit and/or unobjective (Gatesy et al., 1993). Usually, however, manual alignment editing is advocated (e.g., Thompson et al., 1994) because alignment algorithms and programs are not optimally adapted for phylogenetic alignment (see Fig. 14.3). Phylogenetic criteria preferred. Some computational multiple alignment methods align sequences strictly based on the order they receive them (the input order) without any consideration of their relationship. However, many current methods (e.g., CLUSTAL W, PileUp, ALIGN in ProPack) align according to an explicitly phylogenetic criterion (a guide tree ). These guide trees are generated on the basis of initial pairwise sequence alignments. SAM (Hughey et al., 1996) and MACAW (Lawrence et al., 1993) are examples of multiple alignment programs that do not explicitly invoke phylogenetic criteria, although it is possible to manipulate parameters in these programs to mimic phylogenetic processes. Theory holds that more closely related sequences should be aligned first and then the resulting groups of sequences, which may be less related to one another but still have a common ancestor, should share the same ancestral indels. This means that they could then be more accurately aligned. The guide tree from CLUSTAL W (Fig. 14.4) is formatted as a PHYLIP tree file and can be imported in various tree-drawing programs. Some programs are designed to simultaneously (recursively) optimize an alignment and a phylogenetic tree (e.g., TreeAlign and MALIGN). In theory, an optimal simultaneous solution or set of solutions to an alignment/phylogeny problem exists, but the hazard of the recursive approach lies in the possibility of funneling the analysis toward a wrong or
 are effectively assumed to be")
8 330
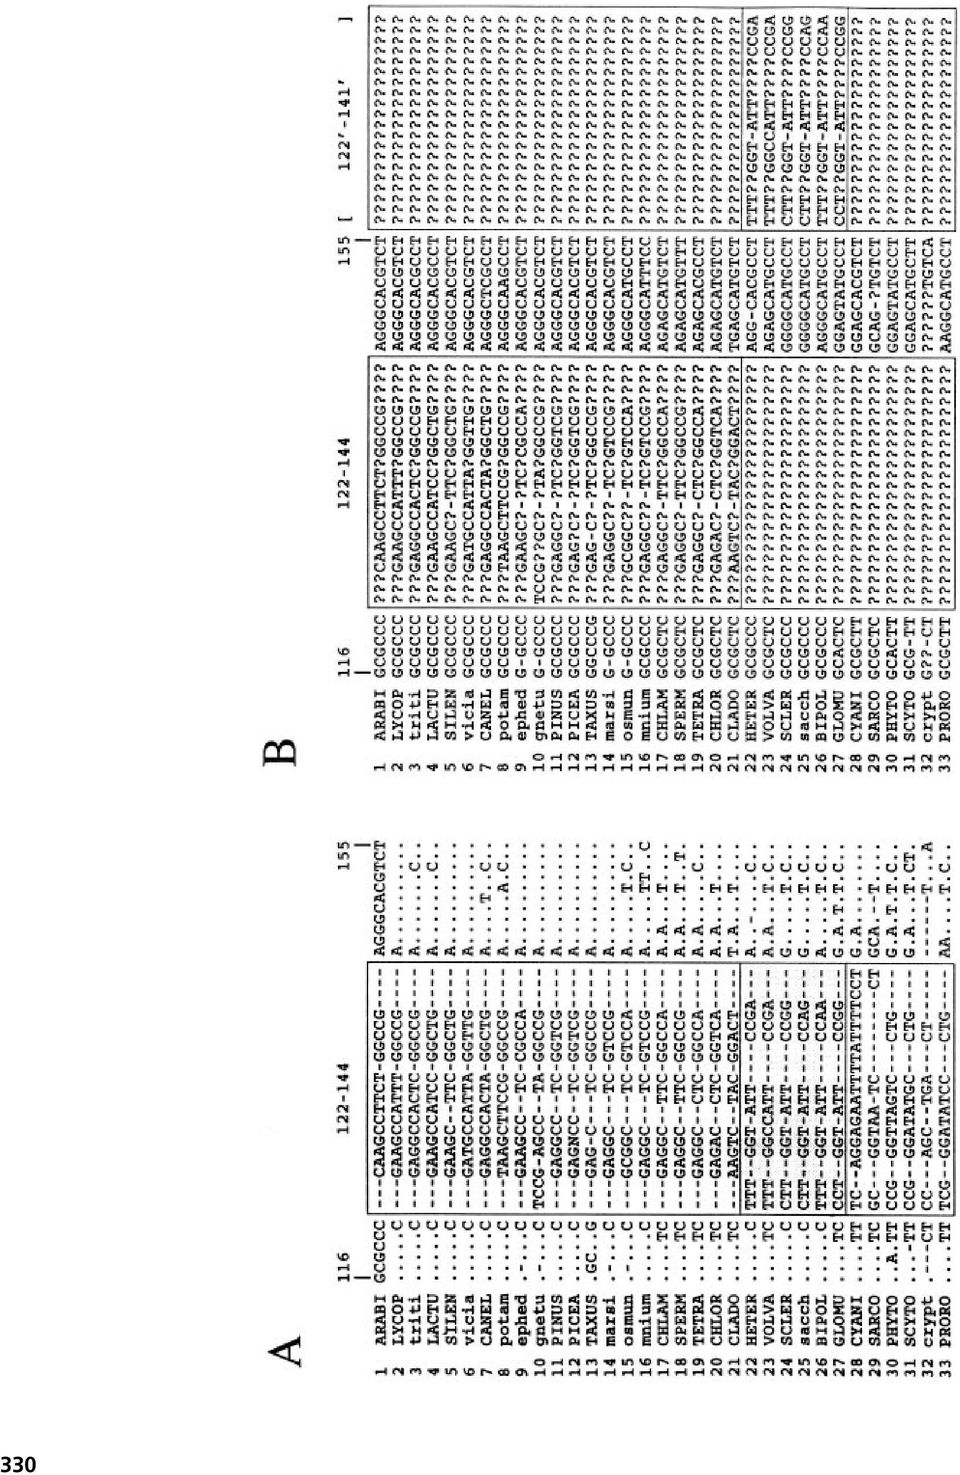
9 ALIGNMENT: BUILDING THE DATA MODEL 331 incomplete solution (Thorne and Kishino, 1992). Thus, when the tree-building analysis based on the alignment is followed, one should consider whether other evolutionary relationships might be favored using a slightly modified alignment. Alignment Parameter Estimation. The most important parameters in an alignment method are those that determine the placement of indels or gaps in an alignment of length-variable sequences. Alignment parameters should vary dynamically with evolutionary divergence (Thompson et al., 1994), such that base mismatches are more likely as the sequences become more divergent. Alignment parameters should also be adjusted to prevent closely related, overrepresented sequences from adversely influencing the alignment of underrepresented sequences (Thompson et al., 1994, Hughey et al., 1996). This is accomplished by downweighting the alignment score contribution of closely related sequences. These dynamic parameter adjustments are both implemented in CLUSTAL W, whereas sequence weighting is implemented in SAM. Which Alignment Procedure is Best for Phylogenetic Analysis? The short answer is the method that is closest to understanding the evolutionary relationships < Figure Alignment modification for phylogenetic analysis. (A) Alignment showing a length-variable region (boxed) of 5.8S rdna for the taxa in the guide tree of Figure 14.4 Taxa 1 8 are angiosperms; 9 and 10, gnetophytes; 11 13, conifers; 14 and 15, ferns; 16, moss; 17 21, green algae; 22 27, fungi; and 28 33, protists. The alignment positions correspond to those published elsewhere (Hershkovitz and Lewis, 1996). Each sequence is unique in the shaded region. Taxa represented in the Figure 14.4 tree having the same sequence as any shown here were omitted for brevity. Note that taxa grouped in the guide tree (based on the entire sequence) appear to form alignment groups in the length-variable region. On a pairwise basis, alternative alignments of some of the distantly related taxa seem plausible. For example, if moved two spaces to the left, the TAC in the center of the CLADO sequence might appear to align better with YAY in several angiosperms than the YYC in other green algae. Sufficient sampling, however, shows that YAY is not universal in the angiosperms, and the guide tree supports the present alignment, which allows no length variability in green algae. In the absence of sufficient sampling, a guide tree, or other prior phylogenetic evidence, no such conclusion could be drawn. Note also that the taxa of the green plant lineage (1 21) do not align well with the fungi and protists. The variability in the shaded region and the divergences indicated in the guide tree suggest that there is no true alignment between these distantly related groups, that the alignment indicated is arbitrary, and that the actual bases are not likely homologous. (B) The same alignment, modified as follows for phylogenetic analysis: (1) the fungi and protists are rescored as missing for all positions in the shaded region, where alignment with the green plant lineage is ambiguous; (2) the length-variable regions of the fungi were appended to the end of the alignment because these sequences are alignable among fungi and include phylogenetically useful variation; and (3) multiple-position gaps were rescored as one gap position and the rest missing, so that, in MP analysis, multiposition gaps are not counted as several independent deletions. The length-variable region of protists was not appended to the end of the alignment because both the alignment and the guide tree indicate that the original alignment is arbitrary.
, such that base mismatches are more likely as the sequences become more divergent.")
10 332 PHYLOGENETIC ANALYSIS
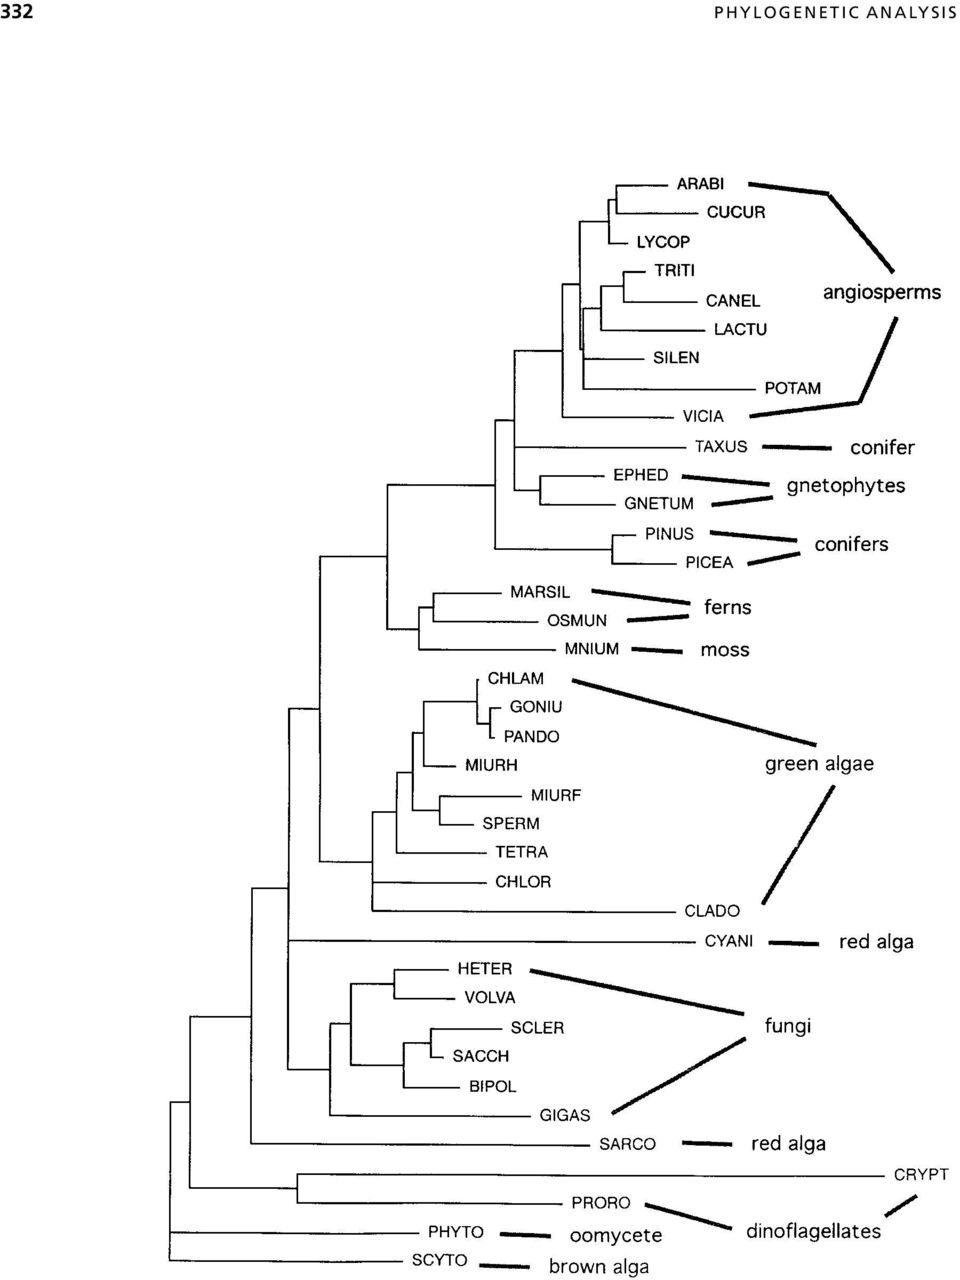
11 ALIGNMENT: EXTRACTION OF A PHYLOGENETIC DATA SET 333 between the sequences being examined. Unless the actual phylogenetic relationships are known beforehand, there is no clear way to determine which alignment procedure is best for a given phylogenetic analysis. In general, it is inadvisable to simply subject a computer-generated alignment to a treebuilding procedure because the latter is blind to errors in the former. This caution especially applies to tree-building programs included in alignment packages (e.g., CLUSTAL W and TREE in ProPack) because the tree-building methods in these programs are not rigorous (Feng and Doolittle, 1996). However, as long as the entire alignment is scrutinized in view of independent phylogenetic evidence, methods such as CLUSTAL W that utilize some degree of phylogenetic criteria are among the best currently available. Mathematical optimization and analysis of structures. Some alignment programs (e.g., MACAW, SAM) optimize according to a statistical model, but the relationship of these statistics to phylogenetic models is not yet clear. No methods are yet available for determining whether one multiple alignment is significantly better than another based on a phylogenetic model. Aligning according to secondary or tertiary sequence structure is considered phylogenetically more reliable than sequence-based alignment because confidence in homology assessment is greater when comparisons are made to complex structures rather than to simple characters (primary sequence). However, there does not appear to be any way to computationally facilitate phylogeny-based structural multiple alignment. Hopefully, new insights into these areas will be developed in the near future. ALIGNMENT: EXTRACTION OF A PHYLOGENETIC DATA SET In alignments that include length variation, the phylogenetic data set is usually not identical to the alignment. Even in alignments of length-invariable sequences, the data set can be different for example, when only first and second codon positions are to be analyzed to avoid the strong G C bias in the third codon position from affecting the final results. < Figure CLUSTAL guide tree for 5.8S rdna sequences of selected plants, fungi, and protists. The taxa and sequences corresponding to the acronyms are described elsewhere (Hershkovitz and Lewis, 1996). The tree is a neighbor-joining (distance) resolution of pairwise sequence similarities determined by pairwise alignment according to specified (in this case, default) gap penalties in CLUSTAL. Similarity is calculated as the proportion of pairwise shared bases, ignoring gap positions in either sequence. The tree can be generated as an end product or as a preliminary step in a multiple-alignment procedure. Either way, it is saved to a PHYLIP-formatted tree file. For the multiple-alignment procedure, the guide tree topology determines the sequence input order (outermost clusters are aligned first) and the branch lengths determine the sequence weights. This tree includes (see Hershkovitz and Lewis, 1996) several groupings that contradict broader evidence (e.g., polyphyly of conifers and red algae; monophyly of ferns plus moss). Such inaccuracies potentially mislead the multiple alignment. This tree was drawn and printed using the tree-drawing feature in the Macintosh version of PAUP.
 because the tree-building methods in these programs are not rigorous (Feng and Doolittle, 1996).")
12 334 PHYLOGENETIC ANALYSIS In the case of length-variable sequences, the degree of difference between an alignment and the phylogenetic data set is determined mainly by how alignment ambiguities and indels are treated. The most extreme way to treat indels is to remove from the analysis all sites that include gaps (cf. Swofford et al., 1996). This approach has the advantage of permitting all the variation in the sequences to be described in terms of the substitution model, without the need for an ad hoc model to account for indels. The disadvantage of this approach is that phylogenetic signals contained within the indel regions are discarded. Maximum parsimony (MP; see below) is the only method that permits for the incorporation of alignable gaps as characters. These can be included in either of two ways: as an additional character state (a fifth nucleotide base or twenty-first amino acid) or as a set of characters independent of base substitutions. The first approach is not tenable for gaps occupying more than one site, for these will be counted as independent character state changes. The latter approach is useful for analyzing an alignment in which subsets of sequences contain perfectly aligned gaps. A set of gap characters can be appended to the aligned sequence data set, or the gaps can be scored in place by using the extra base approach but scoring only one of the gap positions in a sequence as a gap and the remainder as missing. These approaches can be implemented using PAUP. For some alignments, procedures that ignore all gap scores or all sites including gap scores are less than ideal. However, there is not yet any program that allows one to ignore individual sites in individual sequences. When alignment might be unambiguous within groups of sequences but ambiguous among them, alignment surgery is warranted to ensure that unambiguous information relevant to groups of sequences can be retained and ambiguous information removed. An example of alignment surgery is given in Figure In gapped regions, one should determine whether alternative alignments seem reasonably plausible and, just as important, whether they might bias the tree-building analysis. When alignment ambiguities are resolved manually, phylogenetic relations, substitution processes, and base composition should be considered. It is perfectly reasonable at this stage to resolve ambiguities in favor of phylogenetic evidence and in some cases to delete ambiguous regions in the alignment. The advantage of this latter approach is that unambiguous information relevant to particular sequences can be retained over ambiguous data. The disadvantage is that parsimony and likelihood tree-building methods can interpret the missing information as zero divergence. In summary, the following points should be considered when constructing a multiple sequence alignment for a phylogenetic analysis: The alignment step in phylogenetic analysis is one of the most important because it produces the data set on which models of evolution are used. It is not uncommon to edit the alignment, deleting unambiguously aligned regions and inserting or deleting gaps to more accurately reflect probable evolutionary processes that led to the divergence between sequences. It is useful to perform phylogenetic analyses based on a series of slightly modified alignments to determine how ambiguous regions in the alignment affect the results and what aspects of the results one may have more or less confidence in.

13 DETERMINING THE SUBSTITUTION MODEL 335 DETERMINING THE SUBSTITUTION MODEL The substitution model should be given the same emphasis as alignment and tree building. As implied in the preceding section, the substitution model influences both alignment and tree building; hence, a recursive approach is warranted. At the present time, two elements of the substitution model can be computationally assessed for nucleotide data but not for amino acid or codon data. One element is the model of substitution between particular bases; the other is the relative rate of overall substitution among different sites in the sequence. Simple computational procedures have not been developed for assessing more complex variables (e.g., site- or lineagespecific substitution models). An overview of substitution models is presented below. Models of Substitution Rates Between Bases In general, substitutions are more frequent between bases that are biochemically more similar. In the case of DNA, the four types of transition (A G, G A, C T, T C) are usually more frequent than the eight types of transversion (A C, A T, C G, G T, and the reverse). Such biases will affect the estimated divergence between two sequences. Specification of the relative rates of substitution among particular residues usually takes the form of a square matrix; the number of rows/columns is four in the case of bases, 20 in the case of amino acids (e.g., in PAM and BLOSUM matrices), and 61 in the case of codons (excluding stop codons). The off-diagonal elements of the matrix correspond to the relative costs of going from one base to another. The diagonal elements represent the cost of having the same base in different sequences. The cost schedule can be fixed a priori to ensure that the tree-building method will tally an exact cost for each substitution incurred. Fixed-cost matrices are character-state weight matrices and are applied in maximum parsimony (MP) tree building (Fig. 14.5). When such weights are applied, the method is referred to as weighted parsimony. For distance and maximum likelihood (ML) tree building, the costs can be derived from instantaneous rate matrices representing ML estimators of the probability that a particular type of substitution will occur (Fig. 14.6). Although application of the MP weight matrix is just simple arithmetic, application of the distance and ML rate matrices can involve complex algebra. To avoid the blind application of possibly inappropriate methods, practitioners are advised to familiarize themselves with the relevant underlying theory (see Li, 1997; Swofford et al., 1996). Character-state weight matrices have usually been estimated more or less by eye, but they can also be derived from a rate matrix. For example, if it is presumed that each of the two transitions occurs at double the frequency of each transversion, a weight matrix can simply specify, for example, that the cost of A-G is 1 and the cost of A-T is 2 (Fig. 14.5). (The parsimony method dictates that the diagonal elements of the matrix, or the cost of having the same base in different sequences, be zero. This proves to be a shortcoming of parsimony; this will be discussed further below.) In the subsequent tree-building step, this set of assumptions will minimize the overall number of transversions and tend to cluster sequences differing mainly by transitions. A simplified substitution rate matrix used in ML and distance phylogenetic analysis is presented in Figure The matrix is analogous to that presented in Figure

14 336 PHYLOGENETIC ANALYSIS Figure Character weight matrix and application in MP phylogenetic analysis. (A) Matrix indicating that a transversion substitution costs twice that of a transition. Because, according to MP bases shared between two sequences cannot ever have changed, diagonal elements of the matrix are ignored. (B, C) Two phylogenetic resolutions and reconstructions of the evolution of a hypothetical pattern of aligned bases at a particular site in eight sequences. With unweighted MP, both reconstructions (among several others) have the same cost (three steps); hence, they are equally acceptable. With the weight matrix in (A), the reconstruction of (B) requires four steps, and the reconstruction of (C) requires five. Thus, the first reconstruction (B) and others requiring four steps are preferred. 14.5, but the actual computation of divergence involves more complex algebra and cannot be determined by simply counting steps between bases. The paralinear or log-det transformation corrects for nonstationarity (see Swofford et al., 1996). In this method, which is applicable only to distance tree building, the numbers of raw substitutions of each type and in each direction are tallied for each sequence pair in a four-by-four matrix as shown in Figure Each matrix has an algebraic determinant, the log of which becomes a factor in estimating sequence divergence, hence the name log-det. Pairwise comparisons of sequences having various and assorted patterns of base frequencies will yield a variety of matrix patterns, giving a variety of determinant values. Thus, each estimated pairwise distance will be affected by the determinant particular to each pair, which effectively
 have the same cost (three steps); hence, they are equally acceptable.")
15 DETERMINING THE SUBSTITUTION MODEL 337 Figure Simplified substitution rate matrix used in ML and distance phylogenetic analysis. The off-diagonal values a n represent a product of an instantaneous rate of change, a relative rate between the different substitutions, and the frequency of the target base. In practice, the forward rates (upper triangular values) are presumed to equal the reverse rates (corresponding lower triangular values). The diagonal elements are nonzero, which effectively accounts for the possibility that more divergent sequences are more likely to share the same base by chance. In the simplest model of sequence evolution (the Jukes- Cantor model), all values of a are the same: all substitution types and base frequencies are presumed equal. allows the substitution model to be different for each, varying along different branches of a phylogenetic tree. Log-det is especially sensitive to among-site rate heterogeneity (see below), since base frequency bias can exist only in sites that are subject to variation. Models of Among-Site Substitution Rate Heterogeneity In addition to variation in substitution patterns, variation in substitution rates among different sites in a sequence has been shown to profoundly affect the results of tree building (Swofford et al., 1996). The most obvious example of among-site rate variation, or heterogeneity, is that evident among the three codon positions in a coding Figure Pairwise sequence comparison. The table compares 1,361 sites of 18S rdna aligned between spinach (Spinacia oleracea) and a rust fungus (Sclerotinium sclerotiorum). The rows indicate the distribution of bases in the fungus aligned to particular bases in spinach. The columns indicate the reverse. The diagonal values are the number of site-wise identities between the sequences. Note the AT bias in the fungus: 83 ( ) sites that are G or C in spinach are A or T in the fungus. In contrast, only 47 sites ( ) that are G or C in the fungus are A or T in spinach. This bias is muted in simple comparison of base frequencies in the two sequences (the totals) because most sites are the same in both sequences and are probably mutationally constrained. Note also the obviously larger number of transition ( = 96) versus transversion ( = 57) substitutions and that C-T transitions account for 58/153 total differences. The data shown can be generated using the PAUP or MEGA programs.

16 338 PHYLOGENETIC ANALYSIS sequence. Due to the degeneracy of the genetic code, changes in the third codon position can more frequently occur without affecting the ultimately encoded protein sequence. Therefore, this third codon position tends to be much more variable than the first two. For this reason, many phylogenetic analyses of coding sequences exclude the third codon position. In some cases, however, rate variation patterns are more subtle (e.g., those corresponding to conserved regions of proteins or rrna). Approaches to the estimation of substitution rate heterogeneity are the nonparametric models (Yang et al., 1996), the invariants model, and the gamma distribution models (Swofford et al., 1996). The nonparametric approach derives categories of relative rates for particular sites. This approach can be used with MP tree building simply by weighting particular sites according to relative mutation frequency, although such weighting tends to require prior knowledge of the true tree. The approach is also applicable to ML tree building, but it is considered computationally impractical (Yang et al., 1996). The invariants approach estimates a proportion of sites that are not free to vary. The remaining sites are presumed to vary with equal probability. The gamma approach assigns a substitution probability to sites by assuming that, for a given sequence, the probabilities vary according to a gamma distribution. The shape of the gamma distribution, as described by the shape parameter, describes the distribution of substitution probabilities among sites in a sequence (Swofford et al., 1996, p. 444, Fig. 13; cf. Li, 1997, p. 76, Fig. 3.10; note that the scales differ). In a combined approach, it can be presumed that a proportion of sites are invariant and that the remainder varies according to a gamma distribution. In practice, gamma correction can be continuous, discrete, or autodiscrete (Yang et al., 1996). Continuous gamma means that sites are assigned to a change probability along a continuous curve. At present, this approach is computationally impractical in most cases. The discrete gamma approximation assigns sites to a specified number of categories that approximate the shape of the gamma curve. The autodiscrete model assumes that adjacent sites have correlated rates of change. Groups of sites are assigned to categories, and sites within a category can be assumed to have either constant or heterogeneous rates. Various rate heterogeneity corrections are implemented in several tree-building programs. For nucleotide data, PAUP 4.0 implements both invariants and discrete gamma models for separate or combined use with time-reversible distance and likelihood tree-building methods and invariants in conjunction with the log-det distance method (see below). For nucleotide, amino acid, and codon data, PAML implements continuous, discrete, and autodiscrete models. For nucleotide and amino acid data, PHYLIP implements a discrete gamma model. Models of Substitution Rates Between Amino Acids The most widely used models of amino acid substitution include distance-based methods, which are based on matrixes such as PAM and BLOSUM. Again, such matrices are described further in other chapters in this book. Briefly, Dayhoff s PAM 001 matrix (Dayhoff, 1979) is an empirical model that scales probabilities of change from one amino acid to another in terms of an expected 1% change between two amino acid sequences. This matrix is used to make a transition probability matrix that allows prediction of the probability of changing from one amino acid to another and also predicts equilibrium amino acid composition. Phylogenetic distances are calculated with the assumption that the probabilities in the matrix are correct. The
, the invariants model, and the gamma distribution models (Swofford et al., 1996). The nonparametric approach derives categories of relative rates for particular sites.")
17 DETERMINING THE SUBSTITUTION MODEL 339 distance that is computed is scaled in units of expected fraction of amino acids changed. Kimura s distance is another method used in PROTDIST, one of the PHY- LIP family of programs (mentioned further below), and is a rough distance formula for approximating PAM distance by simply measuring the fraction of amino acids that differ between two sequences and computing the distance by a set formula (see Kimura, 1983). This is a more rapid method, but it has some obvious limitations. It does not take into account which amino acids differ or what amino acids are changed, so some information is lost. The distance measure is represented as the fraction of amino acids differing; this is also the case with PAM distances. If the fraction of amino acids differing gets larger than , the distance becomes infinite. Although PROTDIST is one of the most widely used programs providing substitution models for calculating protein distances, others that are faster and make use of additional matrices such as BLOSUM are now more widely-used (e.g., PUZZLE). The model used in parsimony (not a distance-based method) insists that any amino acid changes be consistent with the genetic code so that, for example, lysine is allowed to substitute to methionine but not to proline. However, changes between two amino acids via a third are allowed and are counted as two changes if each of the two replacements is individually allowed. This sometimes allows changes that, at first sight, one would think should be outlawed. Thus, phenylalanine can be changed to glutamine via leucine in two steps total. Genetic code translation tables show that there is a leucine codon one step away from a phenylalanine codon; there is also a leucine codon one step away from a glutamine codon. These leucine codons, however, are not identical. It actually takes three base substitutions to get from either of the phenylalanine codons (UUU and UUC) to either of the glutamine codons (CAA or CAG). Why, then, does this program count only two? The answer is that recent DNA sequence comparisons seem to show that synonymous changes (changes in the nucleotide sequence of a codon region that do not change what amino acids are encoded by that region) are considerably faster and easier than ones that change the amino acid outright. We are assuming that, in effect, synonymous changes occur so much more readily that they need not be counted. Thus, in the chain of changes UUU (Phe) CUU (Leu) CUA (Leu) CAA (Glu), the middle one is not counted because it does not actually change the amino acid (leucine). Which Substitution Model to Use? Although any of the parameters in a substitution model might prove critical for a given data set, the best model is not always the one with the most parameters. To the contrary, the fewer the parameters, the better. This is because every parameter estimate has an associated variance. As additional parametric dimensions are introduced, the overall variance increases, sometimes prohibitively (see Li, 1997, p. 84, Table 4.1). For a given DNA sequence comparison, a two-parameter model will require that the summed base differences be sorted into two categories and into six for a six-parameter model. Obviously, the number of sites sampled in each of the six categories would be much smaller (and perhaps too small) to give a reliable estimate. A good strategy for substitution model specification for DNA sequences is the describe tree feature in PAUP, which uses likelihood to simultaneously estimate the six reversible substitution rates, the -shape parameter of the gamma distribution, and the proportion of invariant sites. These parameters can be estimated by means

18 340 PHYLOGENETIC ANALYSIS of equal or specified base frequencies. Usually, any reasonable phylogenetic tree (e.g., an easily generated neighbor-joining tree) is suitable for this procedure because parameter estimates are apparently influenced predominantly by the character pattern rather than by the tree topology (Swofford et al., 1996). This estimation procedure is not overly time consuming for up to 50 sequences. If there will be more sequences or less time, the test tree can be selectively pruned to reduce the number of taxa while retaining the overall phylogenetic range and structure. From the estimated substitution parameters, one can determine whether a simpler model is justified (e.g., whether the six substitution categories can be reduced to two) by comparing likelihood scores estimated for this tree using more or fewer parameters. Parameters for and the proportion of invariant sites sometimes can substitute for each other, so one should compare likelihoods with each estimated alone versus both together. Note that, unlike MP and ME, the ML scores derived using different parameter values are directly comparable (Swofford et al., 1996). In the case of protein-coding DNA sequences, it is sometimes obvious that, depending on the divergence of the samples, the useful variation is essentially either in the first and second codon positions, with the third positions randomized across the data set, or in the third position, with the first and second positions invariant. The procedure above will correct for this rate heterogeneity, although removing the useless sites may permit a more precise estimate of rate heterogeneity in the remaining sites. For protein sequences, the model used is often dependent on the degree of sequence similarity. For more divergent sequences, the BLOSUM matrices are often better, whereas the PAM matrix is suited for more highly similar sequences. Both parsimony and distance matrix methods (mentioned further below) have benefits and disadvantages, and their use depends on one s philosophy about protein sequence changes: Is it better to retain information about each character when determining a tree (i.e., through parsimony) or to derive distance measures to base the tree (i.e., using a distance matrix)? Is a matrix based on empirical data a more accurate reflection of evolutionary change than a matrix based on generated theories about sequence change? Again, although cladistic analysis can be a powerful method for investigating evolutionary relationships, keep in mind that there is no one clear method that is better than the other. Each has its own benefits and disadvantages that differ depending on the type of analyses performed and the philosophy of the investigator. TREE-BUILDING METHODS Tree-building methods implemented in available software are discussed in detail in the literature (Saitou, 1996; Swofford et al., 1996; Li, 1997) and described on the Internet. This section briefly describes some of the most popular methods. Treebuilding methods can be sorted into distance-based vs. character-based methods. Much of the discussion in molecular phylogenetics dwells on the utility of distanceand character-based methods (e.g., Saitou, 1996; Li, 1997). Distance methods compute pairwise distances according to some measure and then discard the actual data, using only the fixed distances to derive trees. Character-based methods derive trees that optimize the distribution of the actual data patterns for each character. Pairwise distances are, therefore, not fixed, as they are determined by the tree topology. The
. This estimation procedure is not overly time consuming for up to 50 sequences.")
19 TREE-BUILDING METHODS 341 most commonly applied distance-based methods include neighbor-joining and the Fitch-Margoliash method, and the most common character-based methods include maximum parsimony and maximum likelihood. Distance-Based Methods Distance-based methods use the amount of dissimilarity (the distance) between two aligned sequences to derive trees. A distance method would reconstruct the true tree if all genetic divergence events were accurately recorded in the sequence (Swofford et al., 1996). However, divergence encounters an upper limit as sequences become mutationally saturated. After one sequence of a diverging pair has mutated at a particular site, subsequent mutations in either sequence cannot render the sites any more different. In fact, subsequent mutations can make them again equal (for example, if a valine mutates to an isoleucine, which mutates back to a valine). Therefore, most distance-based methods correct for such unseen substitutions. In practice, application of the rate matrix effectively presumes that some proportion of observed pairwise base identities actually represents multiple mutations and that this proportion increases with increasing overall sequence divergence. Some programs implement, at least optionally, calculation of uncorrected distances, whereas, for example, the MEGA program (Kumar et al., 1994) implements only uncorrected distances for codon and amino acid data. Unless overall divergences are very low, the latter approach is virtually guaranteed to give inaccurate results. Pairwise distance is calculated using maximum-likelihood estimators of substitution rates. The most popular distance tree-building programs have a limited number of substitution models, but PAUP 4.0 implements a number of models, including the actual model estimated from the data using maximum likelihood, as well as the logdet distance method. Distance methods are much less computationally intensive than maximum likelihood but can employ the same models of sequence evolution. This is their biggest advantage. The disadvantage is that the actual character data are discarded. The most commonly applied distance-based methods are the unweighted pair group method with arithmetic mean (UPGMA), neighbor joining (NJ), and methods that optimize the additivity of a distance tree, including the minimum evolution (ME) method. Several methods are available in more than one phylogenetics software package but not all implementations allow the same parameter specifications and/or tree optimization features (e.g., branch swapping; see below). Unweighted Pair Group Method with Arithmetic Mean (UPGMA). UPGMA is a clustering or phenetic algorithm it joins tree branches based on the criterion of greatest similarity among pairs and averages of joined pairs. It is not strictly an evolutionary distance method (Li, 1997). UPGMA is expected to generate an accurate topology with true branch lengths only when the divergence is according to a molecular clock (ultrametric; Swofford et al., 1996) or approximately equal to raw sequence dissimilarity. As mentioned earlier, these conditions are rarely met in practice. Neighbor Joining (NJ). The neighbor-joining algorithm is commonly applied with distance tree building, regardless of the optimization criterion. The fully resolved tree is decomposed from a fully unresolved star tree by successively

20 342 PHYLOGENETIC ANALYSIS Figure Star decomposition. This is how tree-building algorithms such as neighborjoining work. The most similar terminals are joined, and a branch is inserted between them and the remainder of the star. Subsequently, the new branch is consolidated so that its value is a mean of the two original values, yielding a star tree with n-1 terminals. The process is repeated until only one terminal remains. inserting branches between a pair of closest (actually, most isolated) neighbors and the remaining terminals in the tree (Fig. 14.8). The closest neighbor pair is then consolidated, effectively reforming a star tree, and the process is repeated. The method is comparatively rapid. Fitch-Margoliash (FM). The Fitch-Margoliash (FM) method seeks to maximize the fit of the observed pairwise distances to a tree by minimizing the squared deviation of all possible observed distances relative to all possible path lengths on the tree (Felsenstein, 1997). There are several variations that differ in how the error is weighted. The variance estimates are not completely independent because errors in all the internal tree branches are counted at least twice (Rzhetsky and Nei, 1992). Minimum Evolution (ME). Minimum evolution seeks to find the shortest tree that is consistent with the path lengths measured in a manner similar to FM; that is, ME works by minimizing the squared deviation of observed to tree-based distances (Rzhetsky and Nei, 1992; Swofford et al., 1996; Felsenstein, 1997). Unlike FM, ME does not use all possible pairwise distances and all possible associated tree path lengths. Rather, it fixes the location of internal tree nodes based on the distance to external nodes and then optimizes the internal branch length according to the minimum measured error between these observed points. It thus purports to eliminate the nonindependence of FM measurements. Which Distance-Based Tree-Building Procedure Is Best? ME and FM appear to be the best procedures, and they perform nearly identically in simulation studies (Huelsenbeck, 1995). ME is becoming more widely implemented in computer programs, including METREE (Rzhetsky and Nei, 1994) and PAUP. For protein data, the FM procedure in PHYLIP offers the greatest range of substitution models but no correction for among-site rate heterogeneity. The MEGA (Kumar et al., 1994) and METREE packages include a gamma correction for proteins, but only in conjunction with a raw ( p-distance ) divergence model (no distance or bias correction), which is unreliable except for small divergences (Rzhetsky and Nei, 1994). MEGA also computes separate distances for synonymous and nonsynonymous sites, but this
 neighbors and the remaining terminals in the tree (Fig. 14.8).")
21 TREE-BUILDING METHODS 343 method is valid only in the absence of substitution or base frequency bias and when there is no correction for among-site rate heterogeneity. Thus, for most data sets, using the nucleotide data under a more realistic model might be preferable to MEGA s methods. Simulation studies indicate that UPGMA performs poorly over a broad range of tree shape space (Huelsenbeck, 1995). The use of this method is not recommended; it is mentioned here only because its application seems to persist, as evidenced by UPGMA gene trees appearing in publications (Huelsenbeck, 1995). NJ is clearly the fastest procedure and generally yields a tree close to the ME tree. (Rzhetsky and Nei, 1992; Li, 1997). However, it yields only one tree. Depending on the structure of the data, numerous different trees might be as good or significantly better than the NJ tree (Swofford et al., 1996). Character-Based Methods The character-based methods have little in common with each other, besides the use of the character data at all steps in the analysis. This allows the assessment of the reliability of each base position in an alignment on the basis of all other base positions. Maximum Parsimony (MP). Maximum parsimony is an optimization criterion that adheres to the principle that the best explanation of the data is the simplest, which in turn is the one requiring the fewest ad hoc assumptions. In practical terms, the MP tree is the shortest the one with the fewest changes which, by definition, is also the one with the fewest parallel changes. There are several variants of MP that differ with regard to the permitted directionality of character state change (Swofford et al., 1996). To accommodate substitution bias, MP is amenable to weighting; for example, the transformation of a transversion can be weighted relative to a transition (see above). The easiest way to do this is to create a weighting step matrix in which the weights are the reciprocal of the rates estimated using ML as described above. However, step-matrix weighting can greatly slow MP computation. The MP method performs poorly when there is substantial among-site rate heterogeneity (Huelsenbeck, 1995). There are few good fixes for this problem. One approach is to modify the data set to include only sites that exhibit little or no heterogeneity as determined by likelihood estimation (see above). Another approach is to recursively reweight positions according to their propensity to change as observed in preliminary trees. This successive approximations approach is automatically facilitated in PAUP, but it is prone to error to the degree that the preliminary trees are incorrect. MP analyses tend to yield numerous (and sometimes many thousands of) trees that have the same score. Because each is held to be as optimal as any other, only groupings present in the strict consensus of all trees are considered to be supported by the data. The reason that distance and ML tree methods tend to arrive at a single best tree is that their calculations involve division and decimals, whereas MP merely counts discrete steps. For a given data set, a strict consensus of all ME or ML trees that are not significantly worse than optimal probably would yield resolution more or less comparable to the MP consensus. Unfortunately, whereas MP users conventionally present strict consensus (and sometimes consensus of trees one or two steps worse), ME and ML users typically do not.
22 344 PHYLOGENETIC ANALYSIS Simulation studies have shown that MP performs no better than ME and worse than ML when the amount of sequence evolution since lineages diverged is much greater than the amount of divergence that occurred between lineage splits (i.e., in a tree with very long terminal branches and short internal internodes) (Huelsenbeck, 1995). This condition produces long branch attraction the long branches become artificially connected because the number of nonhomologous similarities the sequences have accumulated exceeds the number of homologous similarities they have retained with their true closest relatives (Swofford et al., 1996). Character weighting improves the performance of MP under these conditions (Huelsenbeck, 1995). Maximum Likelihood (ML). ML turns the phylogenetic problem inside out. ML searches for the evolutionary model, including the tree itself, that has the highest likelihood of producing the observed data. In practice, ML is derived for each base position in an alignment. The likelihood is calculated in terms of the probability that the pattern of variation at a site would be produced by a particular substitution process, given a particular tree and the overall observed base frequencies. The likelihood becomes the sum of the probabilities of each possible reconstruction of substitutions under a particular substitution process. The likelihoods for all the sites are multiplied to give an overall likelihood of the tree (i.e., the probability of the data given the tree and the substitution process). As one can imagine, for one particular tree, the likelihood of the data is low at some sites and high at others. For a good tree, many sites will have higher likelihood, so the product of likelihoods is high. For a poor tree, the reverse will be true. The substitution model should be optimized to fit the observed data. For example, if there is a transition bias, evident by an inordinate number of sites that include only purines or pyrimidines, the likelihood of the data under a model that assumes no bias will never be as good as one that does. Likewise, if a substantial proportion of the sites are occupied by a single base and another substantial proportion have equal base frequencies, the likelihood of the data under a model that assumes that all sites evolve equally will be less than that of a model that allows rate heterogeneity. Modifying the substitution parameters, however, modifies the likelihood of the data associated with particular trees. Thus, the tree yielding the highest likelihood under one substitution model might yield much lower likelihood under another. Because ML uses great amounts of computational time, it is usually impractical to perform a complete search that simultaneously optimizes the substitution model and the tree for a given data set. An economical, heuristic approach is recommended (Adachi and Hasegawa, 1996; Swofford et al., 1996). Perhaps the best time saver in this regard is preliminary ML estimation of the substitution model (as can be performed using PAUP). This procedure can be applied iteratively, searching for better ML trees, then reestimating the parameters, and then searching for better trees. As algorithms, computers, and phylogenetic understanding have improved, the ML criterion has become more popular for molecular phylogenetic analysis. In simulation studies, ML has consistently outperformed ME and MP when the data analysis proceeds according to the same model that generates the data (Huelsenbeck, 1995). ML will always be the most computationally intensive method of all, however, so there will always be situations in which it is not practical.
23 TREE-BUILDING METHODS 345 DISTANCE, PARSIMONY, AND MAXIMUM LIKELIHOOD: WHAT S THE DIFFERENCE? Distance matrix methods simply count the number of differences between two sequences. This number is referred to as the evolutionary distance, and its exact size depends on the evolutionary model used. The actual tree is then computed from the matrix of distance values by running a clustering algorithm that starts with the most similar sequences (i.e., those that have the shortest distance between them) or by trying to minimize the total branch length of the tree. The principle of maximum parsimony searches for a tree that requires the smallest number of changes to explain the differences observed among the taxa under study. A maximum-likelihood approach to phylogenetic inference evaluates the probability that the chosen evolutionary model has generated the observed data. The evolutionary model could simply mean that one assumes that changes between all nucleotides (or amino acids) are equally probable. The program will then assign all possible nucleotides to the internal nodes of the tree in turn and calculate the probability that each such sequence would have generated the data (if two sister taxa have the nucleotide A, a reconstruction that assumes derivation from a C would be assigned a low probability compared with a derivation that assumes there already was an A ). The probabilities for all possible reconstructions (not just the more probable one) are summed up to yield the likelihood for one particular site. The likelihood for the tree is the product of the likelihoods for all alignment positions in the data set. Searching for Trees The number of unique phylogenetic trees increases exponentially with the number of taxa, becoming astronomical even for, say, 50 sequences (Swofford et al., 1996; Li, 1997). In most cases, computational limitations permit exploration of only a small fraction of possible trees. The exact number will depend mainly on the number of taxa, the optimality criterion (e.g., MP is much faster than ML), the parameters (e.g., unweighted MP is much faster than weighted; ML with fewer preset parameters is much faster than with more and/or simultaneously optimized parameters), computer hardware, and computer software (some algorithms are faster than others; some software allows multiprocessing; some software limits the number and kind of trees that can be stored in memory). The search procedure is also affected by data structure: poorly resolvable data produce more nearly optimal trees that must be evaluated to find the most optimal. Branch-swapping algorithms successively modify existing trees built by an initial step (Swofford et al., 1996). The algorithms range from those that generate all possible unique trees (exhaustive algorithms) to those that evaluate only minor modifications. Quartet puzzling is a relatively rapid tree-searching algorithm available for ML tree building (Strimmer and von Haeseler, 1996) and is available in PUZZLE. One of the best ways to economize the search effort is to prune the data set. For example, it might be apparent from the data alone or from preliminary searching
24 346 PHYLOGENETIC ANALYSIS that a particular cluster of five terminals is unresolvable, that the arrangement of these terminals does not impact the remainder of the topology, and/or that resolution of these terminals is not the objective of the analysis. Removing four of the terminals from the analysis simplifies the search by several orders of magnitude. Every analysis is unique. The elements that influence the choice of optimal search strategy (amount of data, structure of data, amount of time, hardware, objective of analysis) are too variable to suggest a foolproof recipe. Thus, researchers must be familiar with their data; they must also have specific objectives in mind, understanding the various search procedures as well as the capabilities of their hardware and software. Rooting Trees The methods described above produce unrooted trees (i.e., trees having no evolutionary polarity). To evaluate evolutionary hypotheses, it is often necessary to locate the root of the tree. Rooting phylogenetic trees is not a trivial problem (Nixon and Carpenter, 1993). If one accepts a molecular clock, then the root will always be at the midpoint of the longest span across the tree (Weston, 1994). Whether molecular evolution is indeed clocklike generally remains a contentious issue (Li, 1997), but most gene trees exhibit unclocklike behavior regardless of where the root is placed. Thus, rooting is generally evaluated by extrinsic evidence, that is, by means of determining where the tree would attach to an outgroup, which can be any organism/sequence not descended from the nearest common ancestor of the organisms/sequences analyzed (for example, a bird sequence could be used to root an analysis of mammals). Outgroup rooting, however, creates a dilemma: an outgroup that is closely related to the ingroup might be simply an erroneously excluded member of the ingroup. A clearly distant outgroup (e.g., a fungus for an analysis of plants) can have a sequence so diverged that its attachment to the ingroup is subject to the long-branch attraction problem mentioned above. It is wise to examine the results obtained for trees both with and without an outgroup. Another means of rooting involves analysis of a duplicated gene or gene with an internal duplication (Lawson et al., 1996). If all the paralogs from most or all of the organisms are included in the analysis, then one can logically root the tree exactly where the paralog gene trees converge, assuming that there are not long branch problems in all trees. TREE EVALUATION Several procedures are available that evaluate the phylogenetic signal in the data and the robustness of trees (Swofford et al., 1996; Li, 1997). The most popular of the former class are tests of data signal versus randomized data (skewness and permutation tests). The latter class includes tests of tree support from resampling of observed data (nonparametric bootstrap). The likelihood ratio test provides a means of evaluating both the substitution model and the tree. Randomized Trees (Skewness Test) Simulation studies indicate that the distribution of random MP tree lengths generated using random data sets will be symmetrical, whereas those using data sets with
25 TREE EVALUATION 347 phylogenetic signal will be skewed. The critical value of the g 1 statistic of skewness will vary with the number of taxa and variable sites in the sequence. The test does not estimate the reliability of a particular topology, and it is sensitive to even very small amounts of signal present in an otherwise random data set. If taxa from groups that are obviously well supported by the data are selectively deleted, the test can be used to determine whether a phylogenetic signal remains, provided at least 10 variable characters and 5 taxa are examined. The procedure is implemented in PAUP. Randomized Character Data (Permutation Tests) The randomized data approach determines whether an MP tree or portion of it derived from the actual data could have arisen by chance. The data are not truly randomized but permuted within each aligned column, so that covariation in the initial data is removed. The result is an alignment of sequences that are not random sequences; rather, the base at each site in these sequences is randomly drawn from the population of bases occupying that site in the overall alignment. The permutation tail probability test (PTP) compares the score for the MP tree with trees generated by numerous permutations of the data at each site, determining only whether there is a phylogenetic signal in the original data. A topology-dependent test (T-PTP) compares the scores for specific trees to determine whether the difference can be attributed to chance. This method does not evaluate whether the tree or any portion of it is correct (Swofford et al., 1996). In particular, the T-PTP test will appear to corroborate groups that are in trees close to the MP tree but not in it. This is because the method detects the collective signal that places a taxon even approximately, if not actually, in its correct position. The results can be fine-tuned, however, by additional applications using relevant subsets of the data (Faith and Trueman, 1996). The procedure is implemented in PAUP. Bootstrap Bootstrapping is a resampling tree evaluation method that works with distance, parsimony, likelihood, and just about any other tree derivation method. It was invented in 1979 (Efron, 1979) and introduced as a tree evaluation method in phylogenetic analysis by Felsenstein (1985). The result of bootstrap analysis is typically a number associated with a particular branch in the phylogenetic tree that gives the proportion of bootstrap replicates that supports the monophyly of the clade. How is this done practically? Bootstrapping can be considered a two-step process comprising the generation of (many) new data sets from the original set and the computation of a number that gives the proportion of times that a particular branch (e.g., a taxon) appeared in the tree. That number is commonly referred to as the bootstrap value. New data sets are created from the original data set by sampling columns of characters at random from the original data set with replacement. With replacement means that each site can be sampled again with the same probability as any of the other sites. As a consequence, each of the newly created data sets has the same number of total positions as the original data set, but some positions are duplicated or triplicated and others are missing. It is therefore possible that some of the newly created data sets are completely identical to the original set or, on the other extreme, that only one of the sites is replicated, say, 500 times, whereas the remaining 499 positions in the original data set are dropped.
26 348 PHYLOGENETIC ANALYSIS Although it has become common practice to include bootstrapping as part of a thorough phylogenetic analysis, there is some discussion on what exactly is measured by this method. It was originally suggested that the bootstrap value is a measure of repeatability (Felsenstein, 1985). In more recent interpretations, it has been considered to be a measure of accuracy a biologically more relevant parameter that gives the probability that the true phylogeny has been recovered. On the basis of simulation studies, it has been suggested that, under favorable conditions (roughly equal rates of change, symmetric branches), bootstrap values greater than 70% correspond to a probability of greater than 95% that the true phylogeny has been found (Hillis and Bull, 1993). By the same token, under less favorable conditions, bootstrap values greater than 50% will be overestimates of accuracy (Hillis and Bull, 1993). Simply put, under certain conditions, high bootstrap values can make the wrong phylogeny look good; therefore, the conditions of the analysis must be considered. Bootstrapping can be used in experiments in which trees are recomputed after internal branches are deleted one at a time. The results provide information on branching orders that are ambiguous in the full data set (cf. Leipe et al., 1994). Parametric Bootstrap The parametric bootstrap differs from the nonparametric in that it uses simulated (yet actual) replicates rather than pseudoreplicates. In the case of phylogenetic sequence analysis, replicate data sets of the same size as the original data set are generated according to a specified model of sequence evolution, including the optimal tree topology determined according to that model (Huelsenbeck et al., 1996). Each data set is then analyzed according to the method of interest. Support for the branches in the test tree can be determined in much the same way as in the nonparametric bootstrap. Likelihood Ratio Tests As the name implies, likelihood ratio tests are applicable to ML analyses. A suboptimal likelihood value is evaluated for significance against a normal distribution of the error in the optimal model. In ideal applications, the error curve is presumed to be a 2 distribution. Thus, the test statistic is twice the difference between the optimal and test values, and the degrees of freedom is the number of parameter differences. Application of the 2 test to alternative phylogenetic trees is problematic, especially because of the irregularity of [the] parameter space (Yang et al., 1995), but its use has been advocated for evaluating optimality of the substitution model when the number of parameters between models is known. PHYLOGENETICS SOFTWARE PHYLIP and PAUP compete as the most widely used phylogenetic analysis software, although other newer applications such as PUZZLE are beginning to compete. Here, PHYLIP and PAUP will be described in the most detail, with references made to other available packages that have useful features. However, the number of programs available is now so numerous, many each having their own useful features, that the
27 PHYLOGENETICS SOFTWARE 349 reader is referred to the list of Internet resources at the end of this chapter for further information. PHYLIP PHYLIP (for phylogeny inference package) is a package now consisting of about 30 programs that cover most aspects of phylogenetic analysis. PHYLIP is free and available for a wide variety of computer platforms (Mac, DOS, UNIX, VAX/VMS, and others). According to its author, PHYLIP is currently the most widely used phylogeny program. PHYLIP is a command-line program and does not have a point-and-click interface, as programs like PAUP do. The documentation is well written and very comprehensive, and the interface is straightforward. A program within PHYLIP is invoked by typing its name, which automatically causes the data to be read from a file called infile or a file name you specify if no infile exists. This infile must be in PHYLIP format; this format is clearly described in the documentation, and most sequence analysis programs offer the ability to export sequences in this format. For example, if an alignment is produced using CLUSTAL W or edited using GeneDoc, the alignment may be saved in PHYLIP format and then used in PHYLIP programs directly. Once the user activates a given PHYLIP program and loads the infile, the user can then choose from an option menu or accept the default values. The program will write its output to a file called outfile (and treefile where applicable). If the output is to be read by another program, outfile or treefile must be renamed before execution of the next program, as all files named outfile/tree file in the current directory are overwritten at the beginning of any program execution. The tree file generated is a widely used format that can be imported into a variety of tree-drawing programs, including DRAWGRAM and DRAWTREE that come with this package. However, these PHYLIP tree-drawing programs produce low-resolution graphics, so a program such as TreeView (described below) is instead recommended. Particulars of some of the PHYLIP tree-inference programs are discussed below. PROTDIST is a program that computes a distance matrix for an alignment of protein sequences. It allows the user to choose between one of three evolutionary models of amino acid replacements. The simplest, fastest (and least realistic) model assumes that each amino acid has an equal chance of turning into 1 of the other 19 amino acids. The second is a category model in which the amino acids are redistributed among different groups; transitions in this model are evaluated differently depending on whether the change would result in an amino acid in the same or in a different group. The third (default) method, which is recommended, uses a table of empirically observed transitions between amino acids, the Dayhoff PAM 001 matrix (Dayhoff, 1979). More details can be found in the PHYLIP documentation and in a publication (Felsenstein, 1996). NEIGHBOR is a tree-generating program that utilizes the distance matrix data generated from a program such as PROTDIST and generates a tree using the neighborjoining method. This is one of the more popular methods, due to its speed of computation. FITCH is another tree-generating program similar to NEIGHBOR but much more robust. It also uses distance matrix data, such as that described in PROTDIST, and generates a tree using the method of Fitch-Margoliash. This method, while more robust than NEIGHBOR, tends to produce a similar final answer, yet takes longer
28 350 PHYLOGENETIC ANALYSIS to compute. Although computational times are often significantly longer, the quality of the results produced by the method often makes this method the method of choice in these types of analyses. PROTPARS is a parsimony program for protein sequences that generates trees without utilizing a distance matrix. The evolutionary model is different from the ones used in the PROTDIST program in that it considers the underlying changes in the nucleotide sequence to evaluate the probabilities of the observed amino acid changes. Specifically, it makes the (biologically meaningful) assumption that synonymous changes [e.g., GCA (alanine) GCC (alanine)] occur more often than nonsynonymous changes. As a consequence, a transition between two amino acids that would require, for example, three nonsynonymous changes in the underlying nucleotide sequences, is assigned a lower probability than an amino acid change calling for two nonsynonymous changes and one synonymous change. PROTPARS does not have an option that uses empirical values for amino acid changes (e.g., PAM matrices). DNADIST computes a distance matrix from nucleotide sequences. Trees are generated by running the output through NEIGHBOR or other distance matrix programs in the PHYLIP package. DNADIST allows the user to choose between three models of nucleotide substitution. The older Jukes and Cantor model is similar to the simple model in the PROTDIST program in that it assumes equal probabilities for all changes. The more recent Kimura two-parameter model is very similar but allows the user to weigh transversion more heavily than transitions. PHYLIP also comprises DNAML, a maximum-likelihood program for nucleotide data. Because the program is fairly slow, the use of its faster sibling, the fastdnaml program (Olsen et al., 1994) described below, is recommended. SEQBOOT and CONSENSE are required for bootstrap analysis. SEQBOOT is used to generate any number of replicates of the data; these replicates are then used in programs within the PHYLIP suite for analysis. The resulting tree file contains as many trees as there are replicates of the data, so this file needs to be run through CONSENSE to generate the consensus tree from the analysis. As an example, the steps involved in building a bootstrapped neighbor-joining tree for protein sequences are outlined in Figure > Figure Work flow for bootstrap analysis with the PHYLIP program. SEQBOOT accepts a file in PHYLIP format as input and multiplies it a user-specified number of times (e.g., 1,000). The resulting outfile can be used to calculate 1,000 distance matrices for DNA (DNADIST) or protein (PROTDIST) data. In this step, the actual data (nucleotides, amino acids) are discarded and replaced by a figure that is a measure for the amount of divergence between two sequences. The NEIGHBOR program will create 1,000 trees from these matrices. The CONSENSE program reduces the 1,000 trees to a single one and indicates the bootstrap values as numbers on the branches. The topology of the CONSENSE tree can be viewed with any text editor in the outfile, whereas the treefile can be further processed for publication purposes. Treetool and TreeView allow the user to manipulate the tree (rerooting, branch rearrangements, conversions from dendrograms to phylograms, and so forth) and to save the file in commonly used graphic formats. Although these are not part of the PHYLIP package (indicated by boxes with dashed lines), they are freely available (see end-of-chapter list). Different file formats used during date processing through the stages of bootstrap analysis are also shown. Periods to the right and at the bottom of a box indicate files that were truncated to save space.
29 PHYLOGENETICS SOFTWARE 351
30 352 PHYLOGENETIC ANALYSIS PAUP The objective of the development of PAUP is to provide a phylogenetics program that includes as many functions (including tree graphics) as possible in a single, platform-independent program with a menu interface. PAUP stands for phylogenetic analysis using parsimony and still contains one of the most sophisticated parsimony programs available. Version 3 performed only MP-associated tree-building and analytical functions. PAUP version 4 also includes distance and ML functions for nucleotide data and other new features. Current tree-building functions in PAUP include MP, and, for nucleotide data, distance and ML using the fastdnaml algorithm. In addition, PAUP performs Lake s method of invariants (Swofford et al., 1996; Li, 1997). Each tree-building program permits a variety of options. The MP options include specification of any characterweighting scheme. Distance options include choice of NJ, ME, FM (see PAUP release notes regarding PHYLIP), and UPGMA procedures. The full range of options and their current values can be examined using the menu and/or by typing pse [ttings]?, dse[ttings]?, and lse[ttings]? for parsimony, distance, and likelihood, respectively. Both distance and ML allow detailed specification of the substitution model (values of substitution, gamma, and invariant-sites parameters, assuming equal, specified, or empirical base frequencies), and these can be estimated for any tree by setting the parameter values to est[imate] and applying the des[cribe tree] command with a desired tree in memory. According to the release notes accompanying PAUP test version 4, PAUP* usually finds trees with likelihoods as high or higher [i.e., better] than PHYLIP (both because PAUP* s tree rearrangements are more extensive and because its convergence criterion for branch-length iteration is stricter). With any tree-building method, PAUP allows a variety of tree search options. These include algorithm specification for generating the initial tree (starting tree): NJ, stepwise addition, or input tree(s). The stepwise-addition algorithm allows numerous options, including addition of taxa as is (taxa added in file order): closest, furthest, or random with any number of replicates. All the stepwise options allow for any maximal number of partial trees to be retained and built on during taxon addition. Increasing this number to, say, 100, is another means of increasing the diversity of starting topologies, although these are not random. A random addition strategy provides a useful complement to the default search strategy (closest addition, TBR swapping, saving all best trees). In the random search, a large number of replicates can be combined with the faster NNI swapping algorithm. For MP analysis, in which a large number of equal-length trees might exist, the search should specify saving from each replicate only a few trees that match or are better than the score of the slower search. In addition, the number of suboptimal trees (the trees that will be swapped on to find better trees) should be limited by setting MAXTREES to a low number (e.g., 10). By using this strategy to explore areas of tree space possibly missed in the slow search, one sometimes finds better trees and/or additional unique optimal trees. PAUP performs the nonparametric bootstrap for distance, MP, and ML, using all options available for tree building with these methods. When a bootstrap or jackknife with MP is under way, MAXTREES should be set between 10 and no more than 100. This is because poorly resolvable portions of an MP tree will usually be even less resolvable with resampled data; hence, a replicate could find astronomical num-
31 PHYLOGENETICS SOFTWARE 353 bers of equal-length trees. Because tree branches weakly supported by the full data set will not have high bootstrap or jackknife values, limiting MAXTREES will have little, if any, bearing on the results, especially if the number of replicates is increased to, say, 1,000. In addition, PAUP performs the Kishino-Hasegawa test to compare MP or ML trees, computes four types of consensus of multiple trees (usually used for multiple equal-length MP trees), computes stepwise differences between MP trees, and evaluates signal conflicts between specified partitions of sites (e.g., nuclear and organellar sequence data in a combined analysis). Other Programs In addition to PAUP and PHYLIP, there are phylogenetics programs that have some unique capabilities but are generally more limited in their procedures and portability. These include FastDNAml, PUZZLE, MACCLADE, and MOLPHY. FastDNAml. FastDNAml (Olsen et al., 1994) is a freestanding maximum-likelihood, tree-building program. Although it is currently not part of the PHYLIP package, it uses largely the same input and output conventions, and the results of fastdnaml and PHYLIP s DNAML should be very similar or identical. FastDNAml can be run on parallel processors, and it comes with a number of useful scripts (in particular for bootstrapping and jumbling the sequence input order). To take full advantage of the program, knowledge of UNIX is beneficial. The source code for UNIX systems is publicly available from the RDP Web site, and a Power Macintosh version is available by FTP. PUZZLE or TREE-PUZZLE PUZZLE or TREE-PUZZLE (Strimmer and von Haeseler, 1996), as it is now called, is a maximum likelihood-based program that implements a fast tree search algorithm (quartet puzzling) that allows analysis of large data sets and automatically assigns estimations of support to each internal branch. PUZZLE also computes pairwise maximum-likelihood distances as well as branch lengths for user-specified trees. PUZZLE also offers a novel method, likelihood mapping, to investigate the support of a hypothesized internal branch without computing an overall tree and to visualize the phylogenetic content of a sequence alignment. It conducts a number of statistical tests ( 2 test for homogeneity of base composition, likelihood ratio clock test, Kishino-Hasegawa test) and includes a large range of models of substitution. Rate heterogeneity is modeled by a discrete gamma distribution and by allowing invariable sites. MACCLADE. MACCLADE is an interactive Macintosh program for manipulating trees and data and studying the phylogenetic behavior of characters (Maddison and Maddison, 1992). It uses the NEXUS file format and will read PAUP data and tree files. Some information in PAUP files will be ignored in MACCLADE (e.g., gap mode), but information in a PAUP assumptions block will be imported, including character weightings and character and taxon sets. Several subtle differences exist between PAUP and MACCLADE files. Thus, PAUP files edited with MAC- CLADE and vice versa should be saved under new names and the unedited file
32 354 PHYLOGENETIC ANALYSIS maintained separately. PHYLIP, NBRF-PIR, and text files are also readable by MAC- CLADE. Any method can be used to generate the trees, but MACCLADE s functions are based strictly on parsimony. For example, the program allows one to trace the evolution of each individual character on any tree. The MP and ML reconstruction functions differ, however, and the ML function is considered more realistic (Swofford et al., 1996). Tree topologies can be manipulated by dragging branches, and flipping branches can produce aesthetic modifications in tree symmetry. MACCLADE includes additional features relevant to sequence analysis, including a chart of character number versus number of changes in a tree, which is useful for visualizing among-site rate heterogeneity, and a chart of the overall numbers of changes from one base to another over an MP tree ( state changes and stasis chart: the values are sometimes erroneously reported in the literature as substitution rates, but there is no correction for branch lengths or among-site rate heterogeneity). MOLPHY. MOLPHY is a shareware package of programs and utilities for ML analysis and statistics of nucleotide or amino acid sequences (Adachi and Hasegawa, 1996). It has been tested on Sun OS and HP9000/700 systems. Practical application requires some knowledge of UNIX file management. The ML procedures are similar to those in PHYLIP, but there is a wider range of amino acid substitution models and options for faster, heuristic searches, including an option to use local bootstrap analyses (i.e., a bootstrap on subtrees under the assumption that the remainder of the tree is correct) to search for better ML trees. The output includes branch-length estimates and standard error. Analysis of separate codon positions is possible. MOL- PHY uses a subset of the nucleotide substitution models available in PAUP, although it allows user-specified parameter values. The current MOLPHY lacks a bootstrap option and also has no accommodation for among-site rate heterogeneity. Tree Drawing. There are a number of tree-drawing programs available now, such as TreeTool (X-windows), TreeDraw (Macintosh), PHYLODENDRON (Macintosh), TreeView (Macintosh, Microsoft Windows), or the tree-drawing tool in PAUP, and all handle standard tree files. These programs facilitate not only the generation of trees suitable for publication or other presentation but also facilitate viewing of the data in general. For example, programs such as the freely available TreeView enable the user to manipulate the view of branching order, root the tree, and other graphical manipulations that aid the user. INTERNET-ACCESSIBLE PHYLOGENETIC ANALYSIS SOFTWARE Currently, there are few Web-based applications that will permit an investigator to perform phylogenetic analyses over the Web. However, these kinds of resources are appearing in increasing numbers, and, presumably as the Internet bandwidth increases and servers have faster CPUs, this may become even more common. Highlighted here are three Internet-based applications that provide phylogenetic analysis capabilities: WEBPHYLIP, PhyloBLAST, and the BLAST2 & Orthologue Search Server. These illustrate the variety of applications currently available. Although all use PHYLIP programs, the latter two combine phylogenetic analysis with BLAST to aid the user in retrieving sequences for analysis.
33 INTERNET-ACCESSIBLE PHYLOGENETIC ANALYSIS SOFTWARE 355 WEBPHYLIP WEBPHYLIP uses CGI/Perl scripts to produce a Web-based cut-and-paste interface to the PHYLIP programs. Unfortunately, the programs are not linked together; therefore, to generate a neighbor-joining tree, for example, the user must run multiple analyses (PROTDIST and NEIGHBOR in this case). Analyses may time-out if too intensive of an analysis is requested. Also, the trees cannot be easily viewed; for example, if the user has a PC, they must have ghostview or another such PostScript viewer installed to actually view the results. However, the Web site provides excellent flowcharts and other helpful documentation about running the programs, and an extensive collection of the PHYLIP programs is available. PhyloBLAST PhyloBLAST is also based on CGI/Perl scripts. PhyloBLAST compares a user s protein sequence to the SWISS-PROT/TREMBL databases using BLAST2 and then allows user-defined phylogenetic analyses to be performed on selected sequences from the BLAST output. Neighbor-joining and parsimony analyses may be performed, either with or without bootstrapping, using PHYLIP programs. Flexible features, such as the ability to input premade multiple sequence alignments and use all options found in the PHYLIP programs, provide additional functionality that goes beyond the simple analysis of a BLAST result. Because PHYLIP programs need to generate trees that are linked, there is less input required by the user than for WEB- PHYLIP; however, DNA analysis and analysis using some programs (for example, FITCH) are not currently available. However, PhyloBLAST s ability to generate trees-containing hyperlinks to further protein sequence information or generate JPEG graphics of trees is a considerable advantage. Also, the program is set up to handle Web page time-outs so long analyses are not a problem (and can be ed to the user if preferred). BLAST2 & Orthologue Search Server This is a fairly specialized application of phylogenetic analysis of a BLAST output for the identification of orthologs verses paralogs. It is based on the use of CLUS- TALW, WU-BLAST2, and the tree-reconciling algorithm of Page (1994). This tool first performs a BLAST analysis and then performs a phylogenetic analysis on userselected sequences based on a CLUSTAL W alignment and PHYLIP s neighborjoining methods. This resulting neighbor-joining tree ( gene tree ) is ultimately compared with a predicted species tree and the reconciled tree viewed for analysis. The philosophy here is that, whenever the phylogeny of the species matches the phylogeny of the gene tree, these genes will be deemed orthologous. Although this is a useful tool, users should be cautioned that this does not represent a comprehensive phylogenetic analysis, due to the automated nature of the application. Its use should be primarily as intended: to gain insight into what homologous sequences are orthologous in an automated fashion. Further analysis should be performed for any particularly in-depth investigation using less automated alignment and phylogenetic analysis that suits the sequences being investigated.
34 356 PHYLOGENETIC ANALYSIS SOME SIMPLE PRACTICAL CONSIDERATIONS 1. Paradoxical as it may sound, by far the most important factor in inferring phylogenies is not the method of phylogenetic inference but the quality of the input data. The importance of data selection and in particular of the alignment process cannot be overestimated. Even the most sophisticated phylogenetic inference methods are not able to correct for erroneous input data. 2. Look at the data from as many angles as possible. Use each of the three main methods (distance, maximum parsimony, maximum likelihood) and compare the resulting trees for consistency. At the same time, be aware that one cannot rely on having arrived at a good estimate for the true phylogeny just because all three methods produce the same tree. Unfortunately, consistency among results obtained by different methods does not necessarily mean that the result is statistically significant (or represents the true phylogeny), since there can be several reasons for such correspondence. 3. The choice of outgroup taxa can have as much influence on the analysis as the choice of ingroup taxa. Complication will occur in particular when the outgroup shares an unusual property (e.g., composition bias or clock rate) with one or several ingroup taxa. It is therefore advisable to compute every analysis with several outgroups and check for congruency of the ingroup topologies. 4. Be aware that programs can give different answers (trees) depending on the order in which the sequences appear in the input file. PHYLIP, PAUP and other phylogenetic software provide a jumble option that reruns the analysis with different (jumbled) input orders. If for whatever reason the tree must be computed in a single run, sequences that are suspected of being problematic should be placed toward the end of the input file, to lower the probability that tree rearrangement methods will be negatively influenced by a poor initial topology stemming from any problematic sequences. INTERNET RESOURCES FOR TOPICS PRESENTED IN CHAPTER 14 Compilation of available phylogeny programs BLAST2 & Orthologue Search CLUSTAL W GeneDoc GeneTree PHYLIP PhyloBLAST Phylogenetic Resources PUZZLEBOOT ReadSeq RDP Tree software.html genetree.html readseq.html
35 REFERENCES 357 TreeView WebPHYLIP WHS lxzhang/phylip/ REFERENCES Adachi, J., and Hasegawa, M. (1996). MOLPHY Version 2.3. Programs for Molecular phylogenetics based on maximum likelihood (Tokyo: Institute of Statistical Mathematics). Efron, B. (1979). Bootstrapping methods: Another look at the jackknife. Ann. Stat. 7, Dayhoff, M. O., Schwartz, R. M., and Orcutt, B. C. (1978). A model of evolutionary change in proteins. In Atlas of Protein Sequence and Structure M. O. Dayhoff, Ed. (Washington, DC: National Biomedical Research Foundation), p Dayhoff, M. O. (1979). Atlas of Protein Sequence and Structure, Volume 5, Supplement 3, National Biomedical Research Foundation, Washington, D.C.Faith, D. P., and Trueman, J. W. H. (1996). When the topology-dependent permutation test (T-PTP) for monophyly returns significant support for monophyly, should that be equated with (a) rejecting the null hypothesis of nonmonophyly, (b) rejecting the null hypothesis of no structure, (c) failing to falsify a hypothesis of monophyly, or (d) none of the above? Syst. Biol. 45, Felsenstein, J. (1985). Confidence intervals on phylogenies: An approach using the bootstrap. Evolution 39, Felsenstein, J. (1996). Inferring phylogenies from protein sequences by parsimony, distance, and likelihood methods. Methods Enzymol. 266, Felsenstein, J. (1997). An alternative least-squares approach to inferring phylogenies from pairwise distances. Syst. Biol. 46, Feng, D. F., and Doolittle, R. F. (1996). Progressive alignment of amino acid sequences and construction of phylogenetic trees from them. Methods Enzymol. 266, Gatesy, J., DeSalle, R., and Wheeler, W. (1993). Alignment-ambiguous nucleotide sites and the exclusion of systematic data. Mol. Phylogenet. Evol. 2, Hershkovitz, M.A., and Lewis, L.A. (1996). Deep-level diagnostic value of the rdna ITS region. Mol. Biol. Evol. 13, Hillis, D. M., Allard, M. W., and Miyamoto, M. M. (1993). Analysis of DNA sequence data: Phylogenetic inference. Methods Enzymol. 224, Hillis, D. M., and Bull, J. J. (1993). An empirical test of bootstrapping as a method for assessing confidence in phylogenetic analysis. Syst. Biol. 42, Hillis, D. M., Huelsenbeck, J. P., and Cunningham, C. W. (1994). Application and accuracy of molecular phylogenies. Science 264, Huelsenbeck, J. P. (1995). Performance of phylogenetic methods in simulation. Syst. Biol. 44, Huelsenbeck, J. P., Hillis, D. M., and Jones, R. (1996). Parametric bootstrapping in molecular phylogenetics. In Molecular Zoology: Advances, Strategies, and Protocols, J. D. Ferraris and S. R. Palumbi, Eds. (New York: Wiley-Liss), p Hughey, R., Krogh, A., Barrett, C., and Grate, L. (1996). SAM: Sequence alignment and modelling software. University of California, Baskin Center for Computer Engineering and Information Sciences. ( doc/sam doc.html) Kimura, M. (1983). The Neutral Theory of Molecular Evolution. Cambridge University Press, Cambridge. Kumar, S., Tamura, K., and Nei, M. (1994). MEGA: Molecular Evolutionary Genetics Analysis software for microcomputers. Comput. Appl. Biosci. 10,
36 358 PHYLOGENETIC ANALYSIS Lake, J. A. (1994). Reconstructing evolutionary trees from DNA and protein sequences: Paralinear distances. Proc. Natl. Acad. Sci. U.S.A. 91, Lawrence, C. E., Altschul, S. F., Boguski, M. S., Liu, J. S., Neuwald, A. F., and Wootton, J. C. (1993). Detecting subtle sequence signals: A Gibbs sampling strategy for multiple alignments. Science 262, Lawson, F. S., Charlebois, R. L., and Dillon, J. A. (1996). Phylogenetic analysis of carbamoylphosphate synthetase genes: Complex evolutionary history includes an internal duplication within a gene which can root the tree of life. Mol. Biol. Evol. 13, Leipe, D. D., Wainright, P. O., Gunderson, J. H., Porter, D., Patterson, D. J., Valois, F., Himmerich, S., and Sogin, M. L. (1994). The Stramenopiles from a molecular perspective: 16S-like rrna sequences from Labyrinthuloides minutum and Cafeteria roenbergensis. Phycologia 33, Li, W.-H. (1997). Molecular Evolution (Sunderland, MA: Sinauer Associates). Maddison, W. P., and Maddison, D. R. (1992). MacClade: Analysis of Phylogeny and Character Evolution. Version 3.0 (Sunderland, MA: Sinauer Associates). Nixon, K. C., and Carpenter, J. M. (1993). On outgroups. Cladistics 9, Olsen, G. J., Matsuda, H., Hagstrom, R., and Overbeek, R. (1994). fastdnaml: A tool for construction of phylogenetic trees of DNA sequences using maximum likelihood. Comput. Appl. Biosci. 10, 41. Page, R.D.M. (1994). Maps between trees and cladistic analysis of historical associations among genes, organisms, and areas. Systematic Biol. 43, Rzhetsky, A., and Nei, M. (1992). A simple method for estimating and testing minimum evolution trees. Mol. Biol. Evol. 9, Rzhetsky, A., and Nei, M. (1994). METREE: A program package for inferring and testing minimum-evolution trees. Comput. Appl. Biosci. 10, Saitou, N. (1996). Reconstruction of gene trees from sequence data. Methods Enzymol. 266, Strimmer, K., and von Haeseler, A. (1996). Quartet puzzling: A quartet maximum likelihood method for reconstructing tree topologies. Mol. Biol. Evol. 13, Swofford, D. L., Olsen, G. J., Waddell, P. J., and Hillis, D. M. (1996). Phylogenetic inference. In Molecular Systematics, D. M. Hillis, C. Moritz, and B. K. Mable, Eds. (Sunderland, MA: Sinauer Associates), p Thompson, J. D., Higgins, D. G., and Gibson, T. J. (1994). Clustal W: Improving the sensitivity of progressive multiple alignment through sequence weighting. Nucleic Acids Res. 22, Thorne, J. L., and Kishino, H. (1992). Freeing phylogenies from artifacts of alignment. Mol. Biol. Evol. 9, Weston, P. H. (1994). Methods for rooting cladistic trees. In Models in Phylogeny Reconstruction, R. W. Scotland, D. J. Siebert, and D. M. Williams, Eds. (Oxford: Systematics Association), p Yang, W. M., Inouye, C. J., Zeng, Y., Bearss, D., and Seto, E. (1996). Transcriptional repression by YY1 is mediated by interaction with mammalian homolog of the yeast global regulator RPD3. Proc. Natl. Acad. Sci. U.S.A. 93, Yang, Z., Goldman, N., and Friday, A. (1995). Maximum likelihood trees from DNA sequences: A peculiar statistical problem. Syst. Biol. 44,
Introduction to Bioinformatics AS 250.265 Laboratory Assignment 6
 Introduction to Bioinformatics AS 250.265 Laboratory Assignment 6 In the last lab, you learned how to perform basic multiple sequence alignments. While useful in themselves for determining conserved residues
Introduction to Phylogenetic Analysis
 Subjects of this lecture Introduction to Phylogenetic nalysis Irit Orr 1 Introducing some of the terminology of phylogenetics. 2 Introducing some of the most commonly used methods for phylogenetic analysis.
Protein Sequence Analysis - Overview -
 Protein Sequence Analysis - Overview - UDEL Workshop Raja Mazumder Research Associate Professor, Department of Biochemistry and Molecular Biology Georgetown University Medical Center Topics Why do protein
Sequence Analysis 15: lecture 5. Substitution matrices Multiple sequence alignment
 Sequence Analysis 15: lecture 5 Substitution matrices Multiple sequence alignment A teacher's dilemma To understand... Multiple sequence alignment Substitution matrices Phylogenetic trees You first need
PROC. CAIRO INTERNATIONAL BIOMEDICAL ENGINEERING CONFERENCE 2006 1. E-mail: [email protected]
 BIOINFTool: Bioinformatics and sequence data analysis in molecular biology using Matlab Mai S. Mabrouk 1, Marwa Hamdy 2, Marwa Mamdouh 2, Marwa Aboelfotoh 2,Yasser M. Kadah 2 1 Biomedical Engineering Department,
RETRIEVING SEQUENCE INFORMATION. Nucleotide sequence databases. Database search. Sequence alignment and comparison
 RETRIEVING SEQUENCE INFORMATION Nucleotide sequence databases Database search Sequence alignment and comparison Biological sequence databases Originally just a storage place for sequences. Currently the
Amino Acids and Their Properties
 Amino Acids and Their Properties Recap: ss-rrna and mutations Ribosomal RNA (rrna) evolves very slowly Much slower than proteins ss-rrna is typically used So by aligning ss-rrna of one organism with that
Pairwise Sequence Alignment
 Pairwise Sequence Alignment [email protected] SS 2013 Outline Pairwise sequence alignment global - Needleman Wunsch Gotoh algorithm local - Smith Waterman algorithm BLAST - heuristics What
Molecular Clocks and Tree Dating with r8s and BEAST
 Integrative Biology 200B University of California, Berkeley Principals of Phylogenetics: Ecology and Evolution Spring 2011 Updated by Nick Matzke Molecular Clocks and Tree Dating with r8s and BEAST Today
The Central Dogma of Molecular Biology
 Vierstraete Andy (version 1.01) 1/02/2000 -Page 1 - The Central Dogma of Molecular Biology Figure 1 : The Central Dogma of molecular biology. DNA contains the complete genetic information that defines
BASIC STATISTICAL METHODS FOR GENOMIC DATA ANALYSIS
 BASIC STATISTICAL METHODS FOR GENOMIC DATA ANALYSIS SEEMA JAGGI Indian Agricultural Statistics Research Institute Library Avenue, New Delhi-110 012 [email protected] Genomics A genome is an organism s
Bio-Informatics Lectures. A Short Introduction
 Bio-Informatics Lectures A Short Introduction The History of Bioinformatics Sanger Sequencing PCR in presence of fluorescent, chain-terminating dideoxynucleotides Massively Parallel Sequencing Massively
Network Protocol Analysis using Bioinformatics Algorithms
 Network Protocol Analysis using Bioinformatics Algorithms Marshall A. Beddoe [email protected] ABSTRACT Network protocol analysis is currently performed by hand using only intuition and a protocol
MASCOT Search Results Interpretation
 The Mascot protein identification program (Matrix Science, Ltd.) uses statistical methods to assess the validity of a match. MS/MS data is not ideal. That is, there are unassignable peaks (noise) and usually
Bayesian Phylogeny and Measures of Branch Support
 Bayesian Phylogeny and Measures of Branch Support Bayesian Statistics Imagine we have a bag containing 100 dice of which we know that 90 are fair and 10 are biased. The
Introduction to Bioinformatics 3. DNA editing and contig assembly
 Introduction to Bioinformatics 3. DNA editing and contig assembly Benjamin F. Matthews United States Department of Agriculture Soybean Genomics and Improvement Laboratory Beltsville, MD 20708 [email protected]
Genome Explorer For Comparative Genome Analysis
 Genome Explorer For Comparative Genome Analysis Jenn Conn 1, Jo L. Dicks 1 and Ian N. Roberts 2 Abstract Genome Explorer brings together the tools required to build and compare phylogenies from both sequence
Clone Manager. Getting Started
 Clone Manager for Windows Professional Edition Volume 2 Alignment, Primer Operations Version 9.5 Getting Started Copyright 1994-2015 Scientific & Educational Software. All rights reserved. The software
Phylogenetic Trees Made Easy
 Phylogenetic Trees Made Easy A How-To Manual Fourth Edition Barry G. Hall University of Rochester, Emeritus and Bellingham Research Institute Sinauer Associates, Inc. Publishers Sunderland, Massachusetts
Gamma Distribution Fitting
 Chapter 552 Gamma Distribution Fitting Introduction This module fits the gamma probability distributions to a complete or censored set of individual or grouped data values. It outputs various statistics
An experimental study comparing linguistic phylogenetic reconstruction methods *
 An experimental study comparing linguistic phylogenetic reconstruction methods * François Barbançon, a Steven N. Evans, b Luay Nakhleh c, Don Ringe, d and Tandy Warnow, e, a Palantir Technologies, 100
Maximum-Likelihood Estimation of Phylogeny from DNA Sequences When Substitution Rates Differ over Sites1
 Maximum-Likelihood Estimation of Phylogeny from DNA Sequences When Substitution Rates Differ over Sites1 Ziheng Yang Department of Animal Science, Beijing Agricultural University Felsenstein s maximum-likelihood
Chapter 6: The Information Function 129. CHAPTER 7 Test Calibration
 Chapter 6: The Information Function 129 CHAPTER 7 Test Calibration 130 Chapter 7: Test Calibration CHAPTER 7 Test Calibration For didactic purposes, all of the preceding chapters have assumed that the
Name: Class: Date: Multiple Choice Identify the choice that best completes the statement or answers the question.
 Name: Class: Date: Chapter 17 Practice Multiple Choice Identify the choice that best completes the statement or answers the question. 1. The correct order for the levels of Linnaeus's classification system,
Graph theoretic approach to analyze amino acid network
 Int. J. Adv. Appl. Math. and Mech. 2(3) (2015) 31-37 (ISSN: 2347-2529) Journal homepage: www.ijaamm.com International Journal of Advances in Applied Mathematics and Mechanics Graph theoretic approach to
Gerry Hobbs, Department of Statistics, West Virginia University
 Decision Trees as a Predictive Modeling Method Gerry Hobbs, Department of Statistics, West Virginia University Abstract Predictive modeling has become an important area of interest in tasks such as credit
Data Analysis, Statistics, and Probability
 Chapter 6 Data Analysis, Statistics, and Probability Content Strand Description Questions in this content strand assessed students skills in collecting, organizing, reading, representing, and interpreting
Algorithms in Computational Biology (236522) spring 2007 Lecture #1
 spring 2007 Lecture #1") Algorithms in Computational Biology (236522) spring 2007 Lecture #1 Lecturer: Shlomo Moran, Taub 639, tel 4363 Office hours: Tuesday 11:00-12:00/by appointment TA: Ilan Gronau, Taub 700, tel 4894 Office
Algorithms in Computational Biology (236522) spring 2007 Lecture #1 Lecturer: Shlomo Moran, Taub 639, tel 4363 Office hours: Tuesday 11:00-12:00/by appointment TA: Ilan Gronau, Taub 700, tel 4894 Office
Data for phylogenetic analysis
 Data for phylogenetic analysis The data that are used to estimate the phylogeny of a set of tips are the characteristics of those tips. Therefore the success of phylogenetic inference depends in large
A successful market segmentation initiative answers the following critical business questions: * How can we a. Customer Status.
 MARKET SEGMENTATION The simplest and most effective way to operate an organization is to deliver one product or service that meets the needs of one type of customer. However, to the delight of many organizations
What mathematical optimization can, and cannot, do for biologists. Steven Kelk Department of Knowledge Engineering (DKE) Maastricht University, NL
 Maastricht University, NL") What mathematical optimization can, and cannot, do for biologists Steven Kelk Department of Knowledge Engineering (DKE) Maastricht University, NL Introduction There is no shortage of literature about the
What mathematical optimization can, and cannot, do for biologists Steven Kelk Department of Knowledge Engineering (DKE) Maastricht University, NL Introduction There is no shortage of literature about the
Solution of Linear Systems
 Chapter 3 Solution of Linear Systems In this chapter we study algorithms for possibly the most commonly occurring problem in scientific computing, the solution of linear systems of equations. We start
Final Project Report
 CPSC545 by Introduction to Data Mining Prof. Martin Schultz & Prof. Mark Gerstein Student Name: Yu Kor Hugo Lam Student ID : 904907866 Due Date : May 7, 2007 Introduction Final Project Report Pseudogenes
Introduction to Principal Components and FactorAnalysis
 Introduction to Principal Components and FactorAnalysis Multivariate Analysis often starts out with data involving a substantial number of correlated variables. Principal Component Analysis (PCA) is a
BIO 3350: ELEMENTS OF BIOINFORMATICS PARTIALLY ONLINE SYLLABUS
 BIO 3350: ELEMENTS OF BIOINFORMATICS PARTIALLY ONLINE SYLLABUS NEW YORK CITY COLLEGE OF TECHNOLOGY The City University Of New York School of Arts and Sciences Biological Sciences Department Course title:
A short guide to phylogeny reconstruction
 A short guide to phylogeny reconstruction E. Michu Institute of Biophysics, Academy of Sciences of the Czech Republic, Brno, Czech Republic ABSTRACT This review is a short introduction to phylogenetic
How To Check For Differences In The One Way Anova
 MINITAB ASSISTANT WHITE PAPER This paper explains the research conducted by Minitab statisticians to develop the methods and data checks used in the Assistant in Minitab 17 Statistical Software. One-Way
THREE DIMENSIONAL REPRESENTATION OF AMINO ACID CHARAC- TERISTICS
 THREE DIMENSIONAL REPRESENTATION OF AMINO ACID CHARAC- TERISTICS O.U. Sezerman 1, R. Islamaj 2, E. Alpaydin 2 1 Laborotory of Computational Biology, Sabancı University, Istanbul, Turkey. 2 Computer Engineering
A comparison of methods for estimating the transition:transversion ratio from DNA sequences
 Molecular Phylogenetics and Evolution 32 (2004) 495 503 MOLECULAR PHYLOGENETICS AND EVOLUTION www.elsevier.com/locate/ympev A comparison of methods for estimating the transition:transversion ratio from
http://www.jstor.org This content downloaded on Tue, 19 Feb 2013 17:28:43 PM All use subject to JSTOR Terms and Conditions
 A Significance Test for Time Series Analysis Author(s): W. Allen Wallis and Geoffrey H. Moore Reviewed work(s): Source: Journal of the American Statistical Association, Vol. 36, No. 215 (Sep., 1941), pp.
How to report the percentage of explained common variance in exploratory factor analysis
 UNIVERSITAT ROVIRA I VIRGILI How to report the percentage of explained common variance in exploratory factor analysis Tarragona 2013 Please reference this document as: Lorenzo-Seva, U. (2013). How to report
A Step-by-Step Tutorial: Divergence Time Estimation with Approximate Likelihood Calculation Using MCMCTREE in PAML
 9 June 2011 A Step-by-Step Tutorial: Divergence Time Estimation with Approximate Likelihood Calculation Using MCMCTREE in PAML by Jun Inoue, Mario dos Reis, and Ziheng Yang In this tutorial we will analyze
Activity IT S ALL RELATIVES The Role of DNA Evidence in Forensic Investigations
 Activity IT S ALL RELATIVES The Role of DNA Evidence in Forensic Investigations SCENARIO You have responded, as a result of a call from the police to the Coroner s Office, to the scene of the death of
BLAST. Anders Gorm Pedersen & Rasmus Wernersson
 BLAST Anders Gorm Pedersen & Rasmus Wernersson Database searching Using pairwise alignments to search databases for similar sequences Query sequence Database Database searching Most common use of pairwise
Visualization of Phylogenetic Trees and Metadata
 Visualization of Phylogenetic Trees and Metadata November 27, 2015 Sample to Insight CLC bio, a QIAGEN Company Silkeborgvej 2 Prismet 8000 Aarhus C Denmark Telephone: +45 70 22 32 44 www.clcbio.com [email protected]
DNA Sequence Alignment Analysis
 Analysis of DNA sequence data p. 1 Analysis of DNA sequence data using MEGA and DNAsp. Analysis of two genes from the X and Y chromosomes of plant species from the genus Silene The first two computer classes
High Throughput Network Analysis
 High Throughput Network Analysis Sumeet Agarwal 1,2, Gabriel Villar 1,2,3, and Nick S Jones 2,4,5 1 Systems Biology Doctoral Training Centre, University of Oxford, Oxford OX1 3QD, United Kingdom 2 Department
!"!!"#$$%&'()*+$(,%!"#$%$&'()*""%(+,'-*&./#-$&'(-&(0*".$#-$1"(2&."3$'45"
*+$(,%!#$%$&'()*%(+,'-*&./#-$&'(-&(0*.$#-$1(2&.3$'45") !"!!"#$$%&'()*+$(,%!"#$%$&'()*""%(+,'-*&./#-$&'(-&(0*".$#-$1"(2&."3$'45"!"#"$%&#'()*+',$$-.&#',/"-0%.12'32./4'5,5'6/%&)$).2&'7./&)8'5,5'9/2%.%3%&8':")08';:
!"!!"#$$%&'()*+$(,%!"#$%$&'()*""%(+,'-*&./#-$&'(-&(0*".$#-$1"(2&."3$'45"!"#"$%&#'()*+',$$-.&#',/"-0%.12'32./4'5,5'6/%&)$).2&'7./&)8'5,5'9/2%.%3%&8':")08';:
DnaSP, DNA polymorphism analyses by the coalescent and other methods.
 DnaSP, DNA polymorphism analyses by the coalescent and other methods. Author affiliation: Julio Rozas 1, *, Juan C. Sánchez-DelBarrio 2,3, Xavier Messeguer 2 and Ricardo Rozas 1 1 Departament de Genètica,
RNA and Protein Synthesis
 Name lass Date RN and Protein Synthesis Information and Heredity Q: How does information fl ow from DN to RN to direct the synthesis of proteins? 13.1 What is RN? WHT I KNOW SMPLE NSWER: RN is a nucleic
D-optimal plans in observational studies
 D-optimal plans in observational studies Constanze Pumplün Stefan Rüping Katharina Morik Claus Weihs October 11, 2005 Abstract This paper investigates the use of Design of Experiments in observational
NCSS Statistical Software Principal Components Regression. In ordinary least squares, the regression coefficients are estimated using the formula ( )
") Chapter 340 Principal Components Regression Introduction is a technique for analyzing multiple regression data that suffer from multicollinearity. When multicollinearity occurs, least squares estimates
Chapter 340 Principal Components Regression Introduction is a technique for analyzing multiple regression data that suffer from multicollinearity. When multicollinearity occurs, least squares estimates
Similarity Searches on Sequence Databases: BLAST, FASTA. Lorenza Bordoli Swiss Institute of Bioinformatics EMBnet Course, Basel, October 2003
 Similarity Searches on Sequence Databases: BLAST, FASTA Lorenza Bordoli Swiss Institute of Bioinformatics EMBnet Course, Basel, October 2003 Outline Importance of Similarity Heuristic Sequence Alignment:
Name Class Date. binomial nomenclature. MAIN IDEA: Linnaeus developed the scientific naming system still used today.
 Section 1: The Linnaean System of Classification 17.1 Reading Guide KEY CONCEPT Organisms can be classified based on physical similarities. VOCABULARY taxonomy taxon binomial nomenclature genus MAIN IDEA:
Why Taking This Course? Course Introduction, Descriptive Statistics and Data Visualization. Learning Goals. GENOME 560, Spring 2012
 Why Taking This Course? Course Introduction, Descriptive Statistics and Data Visualization GENOME 560, Spring 2012 Data are interesting because they help us understand the world Genomics: Massive Amounts
Fixed-Effect Versus Random-Effects Models
 CHAPTER 13 Fixed-Effect Versus Random-Effects Models Introduction Definition of a summary effect Estimating the summary effect Extreme effect size in a large study or a small study Confidence interval
Chi Square Tests. Chapter 10. 10.1 Introduction
 Contents 10 Chi Square Tests 703 10.1 Introduction............................ 703 10.2 The Chi Square Distribution.................. 704 10.3 Goodness of Fit Test....................... 709 10.4 Chi Square
STATISTICA Formula Guide: Logistic Regression. Table of Contents
 : Table of Contents... 1 Overview of Model... 1 Dispersion... 2 Parameterization... 3 Sigma-Restricted Model... 3 Overparameterized Model... 4 Reference Coding... 4 Model Summary (Summary Tab)... 5 Summary
SNP Essentials The same SNP story
 HOW SNPS HELP RESEARCHERS FIND THE GENETIC CAUSES OF DISEASE SNP Essentials One of the findings of the Human Genome Project is that the DNA of any two people, all 3.1 billion molecules of it, is more than
AP Biology 2013 Free-Response Questions
 AP Biology 2013 Free-Response Questions About the College Board The College Board is a mission-driven not-for-profit organization that connects students to college success and opportunity. Founded in 1900,
The Best of Both Worlds:
 The Best of Both Worlds: A Hybrid Approach to Calculating Value at Risk Jacob Boudoukh 1, Matthew Richardson and Robert F. Whitelaw Stern School of Business, NYU The hybrid approach combines the two most
Penalized regression: Introduction
 Penalized regression: Introduction Patrick Breheny August 30 Patrick Breheny BST 764: Applied Statistical Modeling 1/19 Maximum likelihood Much of 20th-century statistics dealt with maximum likelihood
Bioinformatics Resources at a Glance
 Bioinformatics Resources at a Glance A Note about FASTA Format There are MANY free bioinformatics tools available online. Bioinformaticists have developed a standard format for nucleotide and protein sequences
PHYML Online: A Web Server for Fast Maximum Likelihood-Based Phylogenetic Inference
 PHYML Online: A Web Server for Fast Maximum Likelihood-Based Phylogenetic Inference Stephane Guindon, F. Le Thiec, Patrice Duroux, Olivier Gascuel To cite this version: Stephane Guindon, F. Le Thiec, Patrice
CHAPTER 8 FACTOR EXTRACTION BY MATRIX FACTORING TECHNIQUES. From Exploratory Factor Analysis Ledyard R Tucker and Robert C.
 CHAPTER 8 FACTOR EXTRACTION BY MATRIX FACTORING TECHNIQUES From Exploratory Factor Analysis Ledyard R Tucker and Robert C MacCallum 1997 180 CHAPTER 8 FACTOR EXTRACTION BY MATRIX FACTORING TECHNIQUES In
Just the Facts: A Basic Introduction to the Science Underlying NCBI Resources
 1 of 8 11/7/2004 11:00 AM National Center for Biotechnology Information About NCBI NCBI at a Glance A Science Primer Human Genome Resources Model Organisms Guide Outreach and Education Databases and Tools
AP Biology Essential Knowledge Student Diagnostic
 AP Biology Essential Knowledge Student Diagnostic Background The Essential Knowledge statements provided in the AP Biology Curriculum Framework are scientific claims describing phenomenon occurring in
Focusing on results not data comprehensive data analysis for targeted next generation sequencing
 Focusing on results not data comprehensive data analysis for targeted next generation sequencing Daniel Swan, Jolyon Holdstock, Angela Matchan, Richard Stark, John Shovelton, Duarte Mohla and Simon Hughes
Multivariate Analysis of Ecological Data
 Multivariate Analysis of Ecological Data MICHAEL GREENACRE Professor of Statistics at the Pompeu Fabra University in Barcelona, Spain RAUL PRIMICERIO Associate Professor of Ecology, Evolutionary Biology
From DNA to Protein. Proteins. Chapter 13. Prokaryotes and Eukaryotes. The Path From Genes to Proteins. All proteins consist of polypeptide chains
 Proteins From DNA to Protein Chapter 13 All proteins consist of polypeptide chains A linear sequence of amino acids Each chain corresponds to the nucleotide base sequence of a gene The Path From Genes
Circuits 1 M H Miller
 Introduction to Graph Theory Introduction These notes are primarily a digression to provide general background remarks. The subject is an efficient procedure for the determination of voltages and currents
Static IP Routing and Aggregation Exercises
 Politecnico di Torino Static IP Routing and Aggregation xercises Fulvio Risso August 0, 0 Contents I. Methodology 4. Static routing and routes aggregation 5.. Main concepts........................................
GenBank, Entrez, & FASTA
 GenBank, Entrez, & FASTA Nucleotide Sequence Databases First generation GenBank is a representative example started as sort of a museum to preserve knowledge of a sequence from first discovery great repositories,
Keywords: evolution, genomics, software, data mining, sequence alignment, distance, phylogenetics, selection
 Sudhir Kumar has been Director of the Center for Evolutionary Functional Genomics in The Biodesign Institute at Arizona State University since 2002. His research interests include development of software,
INTERNATIONAL CONFERENCE ON HARMONISATION OF TECHNICAL REQUIREMENTS FOR REGISTRATION OF PHARMACEUTICALS FOR HUMAN USE Q5B
 INTERNATIONAL CONFERENCE ON HARMONISATION OF TECHNICAL REQUIREMENTS FOR REGISTRATION OF PHARMACEUTICALS FOR HUMAN USE ICH HARMONISED TRIPARTITE GUIDELINE QUALITY OF BIOTECHNOLOGICAL PRODUCTS: ANALYSIS
Overview of Violations of the Basic Assumptions in the Classical Normal Linear Regression Model
 Overview of Violations of the Basic Assumptions in the Classical Normal Linear Regression Model 1 September 004 A. Introduction and assumptions The classical normal linear regression model can be written
A greedy algorithm for the DNA sequencing by hybridization with positive and negative errors and information about repetitions
 BULLETIN OF THE POLISH ACADEMY OF SCIENCES TECHNICAL SCIENCES, Vol. 59, No. 1, 2011 DOI: 10.2478/v10175-011-0015-0 Varia A greedy algorithm for the DNA sequencing by hybridization with positive and negative
Asexual Versus Sexual Reproduction in Genetic Algorithms 1
 Asexual Versus Sexual Reproduction in Genetic Algorithms Wendy Ann Deslauriers ([email protected]) Institute of Cognitive Science,Room 22, Dunton Tower Carleton University, 25 Colonel By Drive
UNDERSTANDING THE TWO-WAY ANOVA
 UNDERSTANDING THE e have seen how the one-way ANOVA can be used to compare two or more sample means in studies involving a single independent variable. This can be extended to two independent variables
Statistics Graduate Courses
 Statistics Graduate Courses STAT 7002--Topics in Statistics-Biological/Physical/Mathematics (cr.arr.).organized study of selected topics. Subjects and earnable credit may vary from semester to semester.
Auxiliary Variables in Mixture Modeling: 3-Step Approaches Using Mplus
 Auxiliary Variables in Mixture Modeling: 3-Step Approaches Using Mplus Tihomir Asparouhov and Bengt Muthén Mplus Web Notes: No. 15 Version 8, August 5, 2014 1 Abstract This paper discusses alternatives
Evaluating the Performance of a Successive-Approximations Approach to Parameter Optimization in Maximum-Likelihood Phylogeny Estimation
 Evaluating the Performance of a Successive-Approximations Approach to Parameter Optimization in Maximum-Likelihood Phylogeny Estimation Jack Sullivan,* Zaid Abdo, à Paul Joyce, à and David L. Swofford
Protein Protein Interaction Networks
 Functional Pattern Mining from Genome Scale Protein Protein Interaction Networks Young-Rae Cho, Ph.D. Assistant Professor Department of Computer Science Baylor University it My Definition of Bioinformatics
The Scientific Data Mining Process
 Chapter 4 The Scientific Data Mining Process When I use a word, Humpty Dumpty said, in rather a scornful tone, it means just what I choose it to mean neither more nor less. Lewis Carroll [87, p. 214] In
THE BASICS OF STATISTICAL PROCESS CONTROL & PROCESS BEHAVIOUR CHARTING
 THE BASICS OF STATISTICAL PROCESS CONTROL & PROCESS BEHAVIOUR CHARTING A User s Guide to SPC By David Howard Management-NewStyle "...Shewhart perceived that control limits must serve industry in action.
15.062 Data Mining: Algorithms and Applications Matrix Math Review
 .6 Data Mining: Algorithms and Applications Matrix Math Review The purpose of this document is to give a brief review of selected linear algebra concepts that will be useful for the course and to develop
Comparison of Non-linear Dimensionality Reduction Techniques for Classification with Gene Expression Microarray Data
 CMPE 59H Comparison of Non-linear Dimensionality Reduction Techniques for Classification with Gene Expression Microarray Data Term Project Report Fatma Güney, Kübra Kalkan 1/15/2013 Keywords: Non-linear
Appendix 2 Statistical Hypothesis Testing 1
 BIL 151 Data Analysis, Statistics, and Probability By Dana Krempels, Ph.D. and Steven Green, Ph.D. Most biological measurements vary among members of a study population. These variations may occur for
Summation Algebra. x i
 2 Summation Algebra In the next 3 chapters, we deal with the very basic results in summation algebra, descriptive statistics, and matrix algebra that are prerequisites for the study of SEM theory. You
Genomes and SNPs in Malaria and Sickle Cell Anemia
 Genomes and SNPs in Malaria and Sickle Cell Anemia Introduction to Genome Browsing with Ensembl Ensembl The vast amount of information in biological databases today demands a way of organising and accessing
APPENDIX N. Data Validation Using Data Descriptors
 APPENDIX N Data Validation Using Data Descriptors Data validation is often defined by six data descriptors: 1) reports to decision maker 2) documentation 3) data sources 4) analytical method and detection
The primary goal of this thesis was to understand how the spatial dependence of
 5 General discussion 5.1 Introduction The primary goal of this thesis was to understand how the spatial dependence of consumer attitudes can be modeled, what additional benefits the recovering of spatial