1500 Hamilton Avenue Primrose Daycare Center Project
|
|
|
- Sherman Ball
- 9 years ago
- Views:
Transcription
1 15 Hamilton Avenue Primrose Daycare Center Project Traffic Impact Analysis Prepared for: Denise Duffy & Associates, Inc. January 16, 215 Hexagon Transportation Consultants, Inc. Hexagon Office: 111 W. St. John Street, Suite 85 San Jose, CA Hexagon Job Number: 14GB27 Phone: Document Name: Primrose Daycare Center TIA docx

2 15 Hamilton Avenue Primrose Daycare Center TIA January 16, 215 Table of Contents Executive Summary... ii 1. Introduction Existing Conditions Existing Plus Project Conditions Other Transportation Issues Conclusions Appendices Appendix A: Appendix B: Appendix C: Traffic Counts and Approved Trip Inventory Intersection Level of Service Calculations Signal Warrant Worksheets List of Tables Table 1 Signalized Intersection Level of Service Definitions Based on Control Delay... 9 Table 2 Existing Conditions Intersection Levels of Service Summary Table 3 Mid-Week Average Daily Traffic... 2 Table 4 Project Trip Generation Estimate Table 5 Existing/Background plus Project Conditions Intersection Levels of Service Summary Table 6 Vehicle Queuing and -Turn Pocket Storage Analysis List of Figures Figure 1 Project Site Plan and Surrounding Study Area... 6 Figure 2 Project Site Plan... 7 Figure 3 Existing Bicycle Facilities Figure 4 Existing Transit Services Figure 5 Existing Intersection Lane Configurations Figure 6 Existing Traffic Volumes Figure 7 Project Trip Distribution Pattern Figure 8 Project Trip Assignment Figure 9 Existing plus Project Traffic Volume Page i

3 15 Hamilton Avenue Primrose Daycare Center TIA January 16, 215 Executive Summary This report presents the results of the Transportation Impact Analysis (TIA) prepared for the proposed Primrose daycare center at 15 Hamilton Avenue in San Jose, California. The proposed project consists of a two story, 13,545 square foot daycare center adjoined with a 1,4 square foot children s playground. The daycare center will be located on a.92 acre site south of Hamilton Avenue between Hamilton Way and Cherrydale Drive and would consist of eleven classrooms with a capacity for 196 students. Access would be via a driveway opposite Cherrydale Drive. This study was conducted for the purpose of identifying potential traffic impacts related to the proposed development. The impacts of the project were evaluated following the standards and methodologies set forth by the City of San Jose. Project impacts on other transportation facilities, such as bicycle facilities and transit services, were determined on the basis of engineering judgment. An analysis according to the Santa Clara Valley Transportation Authority (VTA) Congestion Management Program (CMP) guidelines was prepared, since the project is expected to generate more than 1 peak hour vehicle trips. The study determined the traffic impacts of the proposed development on two signalized intersections and two unsignalized intersections during the weekday AM and PM peak periods of traffic. None of the study intersections are CMP-designated intersections. Project Trip Generation The City of San Jose has published trip generation rates in the San Jose Traffic Impact Analysis Handbook, November 29. After applying the appropriate rates for a daycare center, the proposed project is expected to generate 921 daily trips, with 175 trips occurring during the AM peak hour and 184 trips during the PM peak hour. Using the specified inbound/outbound splits, the project would produce 88 inbound and 88 outbound trips during the AM peak hour and 92 inbound and 92 outbound trips during the PM peak hour. Intersection Level of Service Analysis The results of the intersection level of service analysis for the two signalized intersections show that, measured against the City of San Jose level of service impact criteria, neither signalized study intersection would experience a significant impact. The City of San Jose does not establish significant impact criteria for unsignalized intersections. Table ES-1 summarizes the results of the intersection level of service analysis. Page ii

4 15 Hamilton Avenue Primrose Daycare Center TIA January 16, 215 Other Transportation Issues The City of San Jose General Plan 24 transportation policies strongly support increased walking, cycling, and transit ridership. The project would replace an empty lot, increasing activity at the site. New pedestrian, bicycle, and transit trips can make use of the available facilities surrounding the project site, which are adequate for increased demand. Pedestrian Facilities The City is planning modifications to the existing high visibility crosswalk at the unsignalized intersection of Hamilton Avenue and Hamilton Way, to add Rectangular Rapid Flash Beacons (RRFB). The project will install the beacons in accordance with the city plan. Signal Warrants Based on the result of the signal warrant analysis, a traffic signal is not warranted at the unsignalized intersection of Hamilton Avenue and Cherrydale Drive, under any study scenarios. Recommendations At the driveway vegetation height should be below motorists eye level to maintain adequate sight distance. Currently the drive aisle dimensions are narrower than required by the City s Zoning Code. The project applicant should coordinate with City staff to determine the drive aisle dimensions that will be necessary to adequately serve the project and to ensure that the planned overhang is acceptable. The project applicant should make the following revisions to the proposed site plan: reduce driveway width to 26 feet and better align entrance with Cherrydale Drive. The project applicant should develop a striping plan for the intersection of Hamilton Avenue and Cherrydale Drive to provide a left turn lane into the project driveway. The project applicant should install the upgrades to the nearby high visibility crosswalk. Page iii

5 15 Hamilton Avenue Primrose Daycare Center TIA January 16, 215 Table ES 1 Intersection Level of Service Summary Study Number Existing /Background Existing/Background + Project Peak Avg Avg Incr. In Incr. In Intersection Hour Count Date Delay LOS Delay LOS Crit. Delay Crit. V/C 1 Hamilton Avenue & Meridian Avenue AM 5/21/ E E PM 5/21/ E E Hamilton Avenue & Hicks Avenue AM 5/21/ B+ 1.8 B+.1.1 PM 5/21/ A 8.4 A.2.2 Notes: Bold indicates significant impact Intersection control based on existing conditions Existing and Background scenarios are identical Page iv

6 15 Hamilton Avenue Primrose Daycare Center TIA January 16, Introduction This report presents the results of the traffic impact analysis conducted for the proposed Primrose daycare center located at 15 Hamilton Avenue in San Jose, California. The project proposes to construct a two story, 13,545 square foot daycare center adjoined with a 1,6 s.f. children s playground. The daycare center will be located on a.92 acre site south of Hamilton Avenue between Hamilton Way and Cherrydale Drive and would consist of eleven classrooms with a capacity for 196 students. Access would be via a driveway opposite Cherrydale Drive. The project site and the surrounding study area are shown in Figure 1. Figure 2 presents the project site plan. Scope of Study This study was conducted for the purpose of identifying the potential traffic impacts related to the proposed project. The potential impacts of the project were evaluated in accordance with the standards set forth by the City of San Jose. Since the proposed project is expected to generate more than 1 peak hour vehicle trips, this traffic analysis follows the Santa Clara County Valley Transportation Agency (VTA) Congestion Management Program (CMP) guidelines. The traffic analysis is based on the AM and PM peak hour levels of service for two (2) signalized intersections, and two (2) two-way STOP-controlled intersections. Study Intersections 1. Hamilton Avenue and Meridian Avenue 2. Hamilton Avenue and Hicks Avenue 3. Hamilton Avenue and Hamilton Way (unsignalized) 4. Hamilton Avenue and Cherrydale Drive (unsignalized) None of the study intersections is part of the CMP roadway network. Page 5

7

8

9 15 Hamilton Avenue Primrose Daycare Center TIA January 16, 215 Although this traffic analysis is required to follow the CMP technical guidelines, which generally includes a freeway segment level of service analysis, the project site is sufficiently far away from any nearby freeways that this analysis was unnecessary. The proposed daycare center would run a daily schedule from 6 AM to 6 PM, with drop-off hours between 6 AM and 9 AM and pick-up hours between 3 PM and 6 PM. In addition, up to 28 children would be picked up at noon with others dropped off by bus after 3 PM. Since the primary drop-off and pick-up hours coincide with typical weekday peak hours of traffic, traffic conditions at the study intersections were analyzed for the typical weekday AM (7 AM to 9 AM) and PM (4 PM to 6 PM) peak hours of traffic. Traffic conditions were evaluated for the following scenarios: Scenario 1: Scenario 2: Scenario 3: Existing Conditions. Existing traffic volumes are based on new traffic counts conducted in May 214, while nearby schools were in session. Background Conditions. Normally traffic conditions are evaluated for Background and Background plus Project Conditions. However, the study intersections have no approved trips, and thus Background Conditions are identical to Existing Conditions Existing/Background plus Project Conditions. Existing traffic volumes with the project were estimated by adding to existing traffic volumes the traffic generated by the proposed expansion project assuming maximum enrollment. Existing plus project conditions were evaluated relative to existing conditions in order to determine the effects the project would have on the existing roadway network. Methodology This section presents the methods used to determine the traffic conditions for each scenario described above. It includes descriptions of the data requirements, the analysis methodologies, and the applicable level of service standards. Data Requirements The data required for the analysis were obtained from new traffic counts, the City of San Jose, and field observations. The following data were collected from these sources: existing traffic volumes, existing lane configurations, signal timing and phasing, and approved trips inventory (ATI) Level of Service Standards and Analysis Methodologies Traffic conditions at the study intersections were evaluated using level of service (LOS). Level of Service is a qualitative description of operating conditions ranging from LOS A, or free-flow conditions with little or no delay, to LOS F, or jammed conditions with excessive delays. The various analysis methods are described below. City of San Jose Signalized Intersections The City of San Jose level of service methodology for signalized intersections is the 2 Highway Capacity Manual (HCM) method. This method is applied using the TRAFFIX software. The 2 HCM operations method evaluates signalized intersection operations on the basis of average control delay time for all vehicles at the intersection. Since TRAFFIX is also the CMP-designated intersection level-of-service methodology, the City of San Jose methodology employs the CMP default values for the analysis parameters. The City of San Jose levelof-service standard for signalized intersections is LOS D or better. The correlation between average control delay and level of service is shown in Table 1. Page 8

10 15 Hamilton Avenue Primrose Daycare Center TIA January 16, 215 Table 1 Signalized Intersection Level of Service Definitions Based on Control Delay Level of Service Description Average Stopped Delay Per Vehicle (Sec.) A Operations with very low delay occurring with favorable progression Up to 1. and/or short cycle lengths. Operations with low delay occurring with good progression and/or B 1. to 2. short cycle lengths. C Operations with average delays resulting from fair progression and/or longer cycle lengths. Individual cycle failures begin to appear. 2.1 to 35. D Operations with longer delays due to a combination of unfavorable progression, long cycle lenghts, or high V/C ratios. Many vehicles stop and individual cycle failures are noticeable to 55. E Operations with high delay values indicating poor progression, long cycle lengths, and high V/C ratios. Individual cycle failures are frequent occurences. This is considered to be the limit of acceptable delay to 8. Operation with delays unacceptable to most drivers occurring due to F Greater than 8. oversaturation, poor progression, or very long cycle lengths. Source: Transportation Research Board, 2 Highway Capacity Manual, (Washington, D.C., 2). Unsignalized Intersections For the unsignalized intersections, an assessment was made of the need for signalization. This assessment was made based on the Peak-Hour Volume Signal Warrant (Section 4C.4) described in the California Manual on Uniform Traffic Control Devices (MUTCD). This method makes no evaluation of intersection levels of service, but simply provides an indication whether peak-hour traffic volumes are, or would be, sufficient to justify installation of a traffic signal. Additional analysis may include unsignalized level of service analysis and/or operational analysis such as evaluating vehicle queuing and delay. Other types of traffic control devices, signage, or geometric changes may be preferable based on existing field conditions. Queuing Methodology For selected high-demand movements at key intersections, the estimated maximum vehicle queues were compared to the existing or planned storage capacity. The queuing analysis is presented for informational purposes only, since neither the City of San Jose nor the CMP have defined any policies related to queuing. Vehicle queues were calculated using a Poisson probability distribution, which estimates the probability of n vehicles for a vehicle movement using the following formula: Page 9

11 15 Hamilton Avenue Primrose Daycare Center TIA January 16, 215 P (x n) n e ( ) n! Where: P (x n) probability of n vehicles in queue per lane n number of vehicles in the queue per lane Average number of vehicles in the queue per lane (vehicles per hour per lane/signal cycles per hour) The basis of the analysis is as follows: (1) the Poisson probability distribution is used to estimate the 95 th percentile maximum number of queued vehicles per signal cycle for a particular movement; (2) the estimated maximum number of vehicles in the queue is translated into a queue length, assuming 25 feet per vehicle; and (3) the estimated maximum queue length is compared to the existing or planned available storage capacity for the movement. Significant Impact Criteria Significance criteria are used to establish what constitutes an impact. For this analysis, the criteria used to determine significant impacts on signalized intersections are based on City of San Jose level-of-service standards. The effects of the project on other transportation facilities, such as bicycle facilities and transit service, were determined on the basis of engineering judgment. City of San Jose Definition of Significant Intersection Impacts The project is said to create a significant adverse impact on traffic conditions at a signalized intersection in the City of San Jose if for either peak hour: 1. The level of service at the intersection degrades from an acceptable LOS D or better under background conditions to an unacceptable LOS E or F under background plus project conditions, or 2. The level of service at the intersection is an unacceptable LOS E or F under background conditions and the addition of project trips causes both the critical-movement delay at the intersection to increase by four (4) or more seconds and the volume-to-capacity ratio (V/C) to increase by one percent (.1) or more, or An exception to rule #2 above applies when the addition of project traffic reduces the amount of average delay for critical movements (i.e. the change in average stopped delay for critical movements is negative). In this case, the threshold of significance is an increase in the critical V/C value by.1 or more. A significant impact by City of San Jose standards is said to be satisfactorily mitigated when the measures are implemented that would restore intersection level-of-service to background conditions or better. General Plan Transportation Policies The Circulation Element of the Envision San Jose 24 General Plan includes a set of balanced, long-range, multi modal transportation goals and policies that provide for a transportation network that is safe, efficient and sustainable (minimizes environmental, financial, and neighborhood impacts). These transportation goals and policies are intended to improve multi-modal accessibility to all land uses and create a city where people are less reliant on driving to meet their daily needs. San Jose s Transportation Goals, Policies and Actions aim to: Establish circulation policies that increase bicycle, pedestrian and transit travel while reducing motor vehicle trips to increase the City s share of travel by alternative transportation modes. Promote San Jose as a walking and bicycling-first city by providing and prioritizing funding for projects that enhance and improve bicycle and pedestrian facilities. Page 1
 the estimated maximum number of vehicles in the queue is translated into a queue length, assuming 25 feet per vehicle; and (3) the estimated maximum queue length is compared to the")
12 15 Hamilton Avenue Primrose Daycare Center TIA January 16, 215 Report Organization This report has a total of five chapters. Chapter 2 describes existing/background conditions including the existing roadway network, transit service, bicycle and pedestrian facilities. Chapter 3 presents existing/background plus project conditions including descriptions of the method used to estimate project traffic, its impact on the transportation system, and any recommended mitigation measures. Chapter 4 provides an evaluation of other transportation-related issues, such as site access, on-site circulation, vehicle queuing, parking, as well as potential project impacts on bicycle, pedestrian, and transit facilities. Chapter 5 presents the study conclusions including a summary of any proposed mitigation measures and recommended improvements. Page 11

13 15 Hamilton Avenue Primrose Daycare Center TIA January 16, Existing/Background Conditions This chapter describes the existing conditions for all of the major transportation facilities near the site, including the roadway network, transit service, and bicycle and pedestrian facilities. Because there are no approved projects in the area, background conditions are the same as existing conditions. Existing Roadway Network The major roadways in the vicinity of the site are Hamilton Avenue and Meridian Avenue. Local access to the project site is also provided via Pine Avenue, Gaton drive, Hamilton Way, Cherrydale Drive, and Hicks Avenue. These roadways are described below. The project is approximately equidistant from SR 17, I 28, and SR 87. Under the City of San Jose General Plan 24, Hamilton Avenue, Pine Avenue, and Meridian Avenue are identified as roadways that should prioritize automobiles, bicycles, pedestrians, and trucks equally. In general, this would alter roadway cross sections to add bicycle lanes and sidewalks where they are currently missing. Hamilton Avenue is designated as a City Collector Street under the 24 General Plan. Hamilton Avenue runs from just east of Saratoga Avenue east to Hicks Avenue, where it changes designation to Pine Avenue. Hamilton Avenue has an interchange with SR miles west of the project site. Within the immediate study area, Hamilton Avenue is a two lane collector with a center two-way turn lane. Hamilton Avenue provides sidewalks on both sides throughout the study area and dedicated bicycle lanes between Meridian Avenue and Hicks Avenue. Local bus route 82 runs on Hamilton Avenue. An enhanced visibility crosswalk is located near the project site at the intersection with Hamilton Way. Pedestrian signal heads are found at the signalized intersections with Meridian Avenue and Hicks Avenue. Meridian Avenue is designated as a Grand Boulevard under the 24 General Plan. Meridian Avenue runs from Park Avenue south to Camden Road. Meridian Avenue has an interchange with I-28 and Southwest Expressway to the north. Within the study area, Meridian is a partially divided four lane arterial with a center twoway turn lane. Meridian Avenue provides access to the project site via its intersections with Hamilton Avenue and Gaton Drive. Meridian Avenue provides sidewalks on both sides throughout the study area. Local bus route 63 runs on Meridian Avenue. There are no bicycle lanes. Pedestrian signal heads are found at the signalized intersections with Hamilton Avenue and Lenn Drive. Pine Avenue is an east-west collector street that continues east from Hamilton Avenue at Hicks Avenue and runs to just east of Creek Drive. Pine Avenue is designated as a Local Collector Street under the 24 General Plan and currently provides sidewalks on both sides but no bicycle lanes. Pedestrian signal heads are found at the signalized intersection with Hicks Avenue. Gaton Drive is a short two lane minor collector street that connects Hamilton Avenue just east of the project site to Meridian Avenue southwest of the project site. Gaton Drive provides sidewalks on both sides and is bicycle friendly due to low traffic volume. Page 12

14 15 Hamilton Avenue Primrose Daycare Center TIA January 16, 215 Hamilton Way is a short two lane minor collector street that connects Hamilton Avenue just west of the project site to Hicks Avenue. Hamilton Way provides sidewalks on both sides and is bicycle friendly due to low traffic volume. Cherrydale Drive is a short two lane local street that connects Hamilton Avenue from the project site to Hicks Avenue just south of Hamilton Way. Cherrydale Drive provides sidewalks on both sides and is bicycle friendly due to low traffic volume. Hicks Avenue is a major north-south collector street that changes designation from Camino Ramon at Minnesota Avenue and runs south to Curtner Avenue. Hicks Avenue provides access to the project site via its intersection with Hamilton Avenue. Hicks Avenue provides sidewalks on both sides but no bicycle lanes. Existing Bicycle and Pedestrian Facilities The only County-designated bicycle facility within the project study area is located along Hamilton Avenue between Meridian Avenue and Hicks Avenue. Although not designated as bicycle routes, due to low traffic volumes and vehicle speeds, the surrounding residential streets also provide safe routes for bicyclists. The existing bicycle facilities are shown in Figure 3. Pedestrian facilities in the study area consist of sidewalks along all surrounding local roadways. Crosswalks with pedestrian signal heads are located at all approaches for both signalized intersections in the study area. Of the unsignalized intersections, the intersections of Hamilton Avenue/Hamilton Way and Hamilton Avenue/Gaton Avenue have crosswalks across the minor street approaches. In addition, there is a high visibility crosswalk with flashing beacons across Hamilton Avenue at Hamilton Way, just west of the project site. The other unsignalized intersections in the study area do not provide crosswalks. The existing pedestrian facilities provide good connectivity between the surrounding residential areas and nearby bus lines on Hamilton Avenue and Meridian Avenue. Existing Transit Service Bus Service Existing transit services to the study area are provided by the VTA. The transit services are described below and shown on Figure 4. Local Route 63 provides bus service between Almaden Expressway & Camden Avenue and San Jose State University. It operates primarily on Camden Avenue, Meridian Avenue, Race Street, and San Fernando Street, with connection to the San Jose Diridon train station and transit center. Route 63 operates from 6:15 AM to 7:3 PM Northbound and 1:3 PM Southbound, with a 3-minute headway during peak commute hours. Local Route 82 provides bus service between the Westgate Shopping Center and downtown San Jose. It operates primarily along Hamilton Avenue/Pine Avenue, Minnesota Avenue/Alma Avenue, and First Street/Second Street. Route 82 operates from 6: AM to 9:15 PM, with a 3-minute headway during peak commute hours. Within the study area, the bus stops for bus route 63 at the intersection of Hamilton Avenue and Meridian Avenue are within walking distance to the project site (approximately.3 mile). The bus stops for bus route 82 between Hamilton Drive and Gaton Drive are both within easy walking distance of the site. The eastbound bus stop is located immediately east of the project site (under 1 feet) and provides direct access to the site. The westbound bus stop is located on the opposite side of the Hamilton Avenue from the project site, with a nearby (under 2 feet) high visibility crosswalk at Hamilton Way. Light Rail Transit (LRT) and Other Rail Services There are no direct rail connections near the project site. The Hamilton LRT station is located near SR 17 approximately 1.5 miles west of the project site and connected by the route 82 bus. The Hamilton LRT station Page 13

15 15 Hamilton Avenue Primrose Daycare Center TIA January 16, 215 provides light rail services north to Mountain View and south to the Winchester Transit Center in Campbell through the Mountain View/Winchester line. Existing Intersection Lane Configurations and Traffic Volumes The existing lane configurations at the study intersections were obtained by observations in the field. The existing intersection lane configurations are shown in Figure 5. Existing traffic volumes were obtained from new traffic counts conducted in May 214, while schools were in session. The existing AM and PM peak-hour intersection volumes are shown in Figure 6. The traffic count data are included in Appendix A. Page 14

16
17

18

19

20 15 Hamilton Avenue Primrose Daycare Center TIA January 16, 215 Existing/Background Intersection Levels of Service Intersection levels of service were evaluated against the City of San Jose standards. The results of the intersection level-of-service analysis under existing conditions are summarized in Table 2. The level of service results show that the intersection of Hamilton Avenue & Hicks Avenue is operating at LOS B or better in both peak periods, but the intersection of Hamilton Avenue & Meridian Avenue is operating at an unacceptable LOS E in both peak periods. The level of service calculations are included in Appendix B. Table 2 Existing Conditions Intersection Levels of Service Summary Study Number Peak Count Avg Intersection Hour Date Delay LOS 1 Hamilton Avenue & Meridian Avenue AM 5/21/ E+ PM 5/21/ E+ 2 Hamilton Avenue & Hicks Avenue AM 5/21/ B+ PM 5/21/ A Note: Intersection control based on existing conditions Observed Existing Traffic Conditions Traffic conditions in the field were observed in order to identify existing operational deficiencies and to confirm the accuracy of calculated intersection levels of service. The purpose of this effort was (1) to identify any existing traffic problems that may not be directly related to level of service, and (2) to identify any locations where the level of service analysis does not accurately reflect existing traffic conditions. AM Peak Period In the AM peak period, all study intersections exhibited no significant operational issues and operated at LOS E or better. Based on the above discussion, we determine that the calculated level-of-service results reflect actual traffic conditions observed in the field. PM Peak Period In the PM peak period, all study intersections exhibited no operational issues and operated at LOS E or better. Based on the above discussion, we determine that the calculated level-of-service results reflect actual traffic conditions observed in the field. Average Daily Traffic Existing midweek traffic volumes for the three local streets in the study area were obtained from new 24-hour traffic counts conducted on a Tuesday, Wednesday, and Thursday in October 214, while schools were in session. One-way and two-way midweek average daily traffic (ADT) for Hamilton Way, Cherrydale Drive, and Gaton Drive are presented in Table 3. The traffic count data are included in Appendix A. The existing volumes are consistent with typical volumes in San Jose for local residential streets. Page 19

21 15 Hamilton Avenue Primrose Daycare Center TIA January 16, 215 Table 3 Mid-Week Average Daily Traffic Roadway Limits NB/EB ADT SB/WB ADT 2 Way ADT Hamilton Way Hamilton Ave/Hicks Dr Cherrydale Drive Hamilton Ave/Hicks Dr Gaton Drive Meridian Ave/Hamilton Ave Page 2
22 15 Hamilton Avenue Primrose Daycare Center TIA January 16, Existing/Background Plus Project Conditions This chapter describes existing plus project traffic conditions, including the method by which project traffic is estimated. There are no approved projects in the study area so background conditions are the same as existing conditions. Project Trip Estimates The magnitude of traffic produced by a new development and the locations where that traffic would appear are estimated using a three-step process: 1) trip generation, 2) trip distribution, and 3) trip assignment. In determining project trip generation, the magnitude of traffic entering and exiting the site is estimated for the AM and PM peak hours. As part of the project trip distribution, an estimate is made of the directions to and from which the project trips would travel. In the project trip assignment, the project trips are assigned to specific streets and intersections. These procedures are described below. Trip Generation Trips generated by any new development can be estimated based on counts of existing development of the same land use type. The City of San Jose has used count data of existing development that has been collected over the years to derive a list of trip generation rates for the most common land uses. The trip generation rates that have been developed can be applied to new development within the City to help predict future traffic increases that would result from new development. These recommended rates are detailed in the San Jose Traffic Impact Analysis Handbook, November 29. Therefore, trip generation resulting from new development proposed within the City of San Jose typically is estimated by multiplying the City s established trip generation rates by the size of the development. The City s handbook publishes trip generation rates for child care centers based on the number of students. On the basis of the trip generation rates recommended by the City of San Jose, it is estimated that the project would generate 931 daily trips, with 177 trips occurring during the AM peak hour and 186 trips during the PM peak hour. Using the specified inbound/outbound splits, the project would produce 88 inbound and 88 outbound trips during the AM peak hour, and 93 inbound and 93 outbound trips during the PM peak hour. The project trip generation estimates are presented in Table 4. Page 21
23 15 Hamilton Avenue Primrose Daycare Center TIA January 16, 215 Table 4 Project Trip Generation Estimate AM Peak Hou AM Peak Hour Trips PM Peak Hour PM Peak Hour Trips Daily Daily Peak Hour Peak Hour Land Use Size Rate Trips Rate In Out Total Rate In Out Total Proposed Use Primrose Daycare /1/ 196 Students Notes: 1. "Day Care Center" rate from San Jose Traffic Impact Analysis Handbook, 29. Trip Distribution and Assignment The trip distribution pattern for the proposed project was estimated based on existing travel patterns on the surrounding roadway system and the locations of complementary land uses. It is assumed that most parents are dropping off their children in the morning then going to work, and picking up their children after work in the evening and going home. The trip distribution pattern is illustrated in Figure 7. The peak hour trips generated by the proposed development were assigned to the roadway system in accordance with trip distribution patterns. The project trip assignment at the study intersections is shown graphically in Figure 8. Existing/Background Plus Project Traffic Volumes Existing Plus Project peak hour traffic volumes were estimated by adding to existing traffic volumes the additional traffic generated by the project. The Existing Plus Project traffic volumes are shown graphically in Figure 9. Existing/Background Plus Project Intersection Levels of Service The results of the intersection level of service analysis under existing plus project conditions are summarized in Table 5.The results show that the intersection of Hamilton Avenue and Hicks Avenue would continue to operate at an acceptable LOS B or better in both peak periods, compared against the City of San Jose standards. The intersection of Hamilton Avenue and Meridian Avenue would continue to operate at an unacceptable LOS E under project conditions. The project impacts at both intersections would be insignificant. Table 5 Existing/Background plus Project Conditions Intersection Levels of Service Summary Existing /Background Existing/Background + Project Study Peak Avg Avg Incr. in Incr. in Number Intersection Hour Delay LOS Delay LOS Crit. Delay Crit. V/C 1 Hamilton Avenue & Meridian Avenue AM 55.3 E E+ 1.. PM 56.6 E E Hamilton Avenue & Hicks Avenue AM 1.7 B+ 1.8 B+.1.1 PM 8.4 A 8.4 A.2.2 Notes: Bold indicates significant impact Intersection control based on existing conditions Existing and Background scenarios are identical Page 22
24
25
26
27 15 Hamilton Avenue Primrose Daycare Center TIA January 16, Other Transportation Issues This chapter presents an analysis of other transportation issues related to the project, including: Site access, on-site circulation, student pick-up/drop-off operations, and parking Signal warrant evaluation Vehicle queuing and storage Potential project impacts to transit, bicycle, and pedestrian facilities Unlike the level of service impact methodology, which is adopted by the City Council, the analyses in this chapter are based on professional judgment in accordance with the standards and methods employed by the traffic engineering community. Although operational issues are not considered CEQA impacts, they do describe traffic conditions that are relevant to describing the project environment. Site Access and Circulation A review of the project site plan was performed to determine whether adequate site access and circulation would be provided. Vehicle operations and queuing, as well as pedestrian safety in the parking lot also were analyzed. This review was based on the site plan prepared by RMC Architects dated January 5, 215, shown in Figure 2. On-site vehicular circulation was reviewed in accordance with generally accepted traffic engineering standards. The hours of operation for the daycare would be 6 AM to 6 PM Monday through Friday. The daycare would not be open regularly on weekends. There may be occasional special events that happen on weekends. Parents generally would drop off their children between 6 AM and 9 AM and pick them up between 3 PM and 6 PM. Also, the daycare would operate an afterschool program. The daycare would have a van that would pick up students at their schools and transport them to the site. The van would utilize one of the onsite parking spaces to drop off the students. Parents would come to the site to pick up the afterschool students. Drop-off and pick-up of students would involve parents parking and walking their children in and out. There would be no curbside drop-off or pick-up. Site Access Access to the project site would be provided via one driveway on Hamilton Avenue opposite Cherrydale Drive. This driveway would provide one inbound lane and one outbound lane and would be 26 feet wide. This dimension matches the City requirement. Page 26
28 15 Hamilton Avenue Primrose Daycare Center TIA January 16, 215 Sight Distance The project access points should be free and clear of any obstructions to optimize sight distance, thereby ensuring that existing vehicles can see pedestrians on the sidewalk and other vehicles travelling on adjacent streets. Landscaping near the driveway should be kept low to not conflict with a driver s ability to locate a gap in traffic and see oncoming pedestrians and bicyclists. Sight distance generally should be provided in accordance with Caltrans standards. The minimum acceptable sight distance is often considered the Caltrans stopping sight distance. Sight distance requirement vary depending on the roadway speeds. For the driveway on Hamilton Avenue, which has a posted speed limit of 35 mph, the Caltrans stopping distance is 3 feet (based on a design speed of 4 mph). Thus, a driver must be able to see 3 feet down Hamilton Avenue. Currently, the site plan does not propose trees along the edges of the sidewalks fronting the project site. On-street parking is currently prohibited on eastbound Hamilton Avenue and would continue to be prohibited under the proposed project. Based on the above mentioned standards, care should be taken in the landscaping plan to ensure that no large vegetation would restrict sight distance at the corners of the driveway. Shrubbery that grows at motorists eye level should be avoided. Driveway Alternatives: Full Access vs. -Turn In/Out The site plan currently shows a full access driveway opposite Cherrydale Drive. This configuration would require conversion of the painted median on Hamilton Avenue into a left turn lane serving the project driveway. The project site plan shows this conversion. An alternative driveway configuration option would be to restrict the driveway to right-in/right out movements only. This would have the advantage of preventing left-turn queuing on westbound Hamilton Avenue. However, eliminating left turns would inconvenience some drivers and would lead to increased u-turns. Hamilton Avenue is not wide enough to accommodate u-turns near the site, so drivers might be tempted to make three point turns in residential driveways. Hexagon recommends that the project driveway allow all turning movements, including left turns. On-Site Circulation Fire Truck On-Site Circulation The San Jose Fire Department requirements specify that every portion of all building exterior walls shall be within 15 feet of an access road. The proposed site plan shows that the entire building would be within 1 feet of Hamilton Avenue, and thus an on-site fire lane is not required. Parking is prohibited on the portion of Hamilton Avenue adjacent to the project site, providing adequate access for fire trucks. Therefore, fire truck access is adequate. Garbage Truck On-Site Circulation The site plan proposes a covered trash enclosure near the southeastern corner of the project site. Trash pick up will occur once per week around midday on a Thursday or Friday (exact schedule yet to be determined). Garbage trucks can access the trash enclosure via the driveway on Hamilton Avenue. The driveway as well as the drive aisle to the trash enclosure have widths exceeding the 22 feet requirements set by the City of San Jose for garbage truck access and circulation. How to access the on-site dumpster will be at the discretion of the truck driver. The truck may back into the site and exit forward or may enter head first and back out. The corner turns meet both the minimum inside turning radius of 34 feet and outside turning radius of 5 feet requirements set by the City of San Jose. The location of the trash enclosure will also allow an unobstrcuted approach of 4 feet, as required by the City of San Jose. Therefore, trash truck access is adequate. Parking Lot Dimensions According to the site plan, the main drive aisle is designed to be 26 feet wide and contains 9-degree parking on both sides for most of its length. The proposed design dimensions for the parking lot meet the City s standard width for a two-way drive aisle of 26 feet wide where 9-degree parking is provided. Page 27
29 15 Hamilton Avenue Primrose Daycare Center TIA January 16, 215 The site plan specifies typical parking stalls measuring 9 feet wide and 15 feet long. The 26 spaces along the southern side of the drive aisle include an additional overhang of 2 feet. The City s standard for uniform car spaces is 8.5 feet wide by 17 feet long, 8 feet wide by 16 feet long for compact car spaces, and 9 feet wide by 18 feet long for full size car spaces. Thus, taking the overhang into account, the proposed parking would include 2 full size standard spaces, 11 compact standard spaces, 3 compact clean air vehicle spaces, 1 full size handicapped space, and 1 van accessible space. The project applicant should coordinate with City staff to ensure that the drive aisle dimensions and the planned overhang are acceptable. Student Drop-Off/Pick-Up Operations All parents would park on-site and walk their children to/from the proposed facility. After school students would arrive by van and be picked up by parents. The van would utilize a regular parking space to drop off the afterschool students. With the number of parking spaces available for drop-off and pick-up, vehicle queuing at the project site is expected to be minimal. The proposed site plan details a walkway along the north side of the northern parking section and a striped pedestrian walkway between the two handicapped spaces, as well as a walkway connecting the main entrance to the sidewalk along Hamilton Avenue. The drive aisle would contain two speed bumps. Parking Evaluation According to the City of San Jose Parking Code, the proposed child care project is required to provide a minimum of 22 parking spaces. The project is proposing 36 total spaces and thus meets the City Parking Code. Neighborhood Traffic Neighbors have expressed concerns about increased traffic on Gaton Drive due to the project. Gaton Drive provides a connection between Hamilton Avenue and Meridian Avenue that avoids the signalized intersection of Hamilton Avenue & Meridian Avenue. 24-hour traffic counts conducted on Gaton Drive showed that the existing volume is about 78 vehicles per day. The Institute of Transportation Engineers in their publication Transportation and Land Development recommends that local residential streets should have traffic volume below 3, vehicles per day. The traffic on Gaton Drive is well below this number. Thus, the current volume on Gaton Drive is comparable to similar neighborhood streets elsewhere in San Jose. The proposed project is unlikely to add a noticeable amount of additional traffic volume to this road. In addition, neighbors have expressed concerns about speeding, which is unrelated to the project. Nearby neighbors should work with the City to study this issue separately. Gap Analysis Counts were conducted of the gaps in traffic on Hamilton Avenue at the location of the proposed project driveway. Based on stopping sight distance and typical driver behavior, it is estimated that the minimum gap time required for one vehicle to exit the project driveway would be 5 seconds. During 3 minutes of the AM peak hour (7:3 AM 8: AM), 41 gaps of 5 seconds or more were counted, for an estimated 82 gaps per hour. During 3 minutes of the PM peak hour (5:23 PM 5:53 PM), 43 gaps of 5 seconds or more were counted, for an estimated 86 gaps per hour. Conservatively, a gap of at least 15 seconds can comfortably accommodate two vehicles making left turns, and a gap of at least 2 seconds can accommodate three turning vehicles. Based on the number and lengths of gaps observed, it is estimated that approximately 116 left turning vehicles in the AM peak hour and 96 left turning vehicles in the PM peak hour could exit the project driveway onto Hamilton Avenue. As shown in Figure 8, an estimated 43 vehicles in the morning and 45 vehicles in the afternoon will make left turns or through movements out of the driveway. In addition, an estimated 45 vehicles in the morning and 47 vehicles in the afternoon will make left turns from westbound Hamilton Avenue into the driveway. Some minor on-site vehicle queuing is to be expected due to a combination of the inherent unpredictability of vehicle arrivals at the driveway and the random occurrence of gaps in traffic that exists on Hamilton Page 28
30 15 Hamilton Avenue Primrose Daycare Center TIA January 16, 215 Avenue. However, it can be concluded that there would be a sufficient number of gaps in traffic and on-site vehicle storage to accommodate the estimated outbound vehicle trips at the project driveway during both AM and PM peak hours under existing plus project conditions. Signal Warrants A peak hour signal warrant check (MUTCD 21 Edition, Part 4, Warrant 3) was performed for the unsignalized study intersection of Hamilton Avenue and Cherrydale Drive to determine whether signalization currently is justified or would be justified on the basis of project peak hour traffic volumes. The signal warrant was checked for existing and existing plus project scenarios. At the intersection of Hamilton Avenue and Cherrydale Drive, the signal warrant was not met under either scenario. The signal warrant worksheets are included in Appendix C. Vehicle Queuing The analysis of intersection level of service was supplemented with an analysis of traffic operations for the intersections of Hamilton Avenue & Cherrydale Drive and Hamilton Avenue & Meridian Avenue, where the project would add a significant number of left turns. The operations analysis is based on vehicle queuing for high demand left-turn movements at intersections. Vehicle queues were estimated using a Poisson probability distribution, which estimates the probability of n vehicles for a vehicle movement using the following formula: P (x n) n e ( ) n! Where: P (x n) probability of n vehicles in queue per lane n number of vehicles in the queue per lane Average number of vehicles in the queue per lane (vehicles per hour per lane/movement delays per hour) The basis of the analysis is as follows: (1) The Poisson probability distribution is used to estimate the 95 th percentile maximum number of queued vehicles per movement delay for a particular movement; (2) the estimated maximum number of vehicles in the queue is translated into a queue length, assuming 25 feet per vehicle; and (3) the estimated maximum queue length is compared to the existing or planned storage capacity for the movement. This analysis thus provides a basis for estimating future left-turn storage requirements at an intersection. The 95 th percentile queue length value indicates that during the peak hour, a queue of this length or less would occur on 95 percent of the movements. Or a queue length larger than the 95 th percentile queue would only occur on 5 percent of the movements (for a signalized intersection, about 3 cycles during the peak hour for a signal with a 6-second cycle length). Therefore, left-turn storage pocket designs based on the 95 th percentile queue length would ensure that storage space would be exceeded only 5 percent of the time. The 95 th percentile queue length is also known as the design queue length. The vehicle queue estimates and a tabulated summary of the findings are provided in Table 6. Hamilton Avenue and Cherrydale Drive Westbound Turns: The proposed project would add this turning movement, which is not present under existing conditions. The queuing analysis indicates that the 95 th percentile vehicle queue for the westbound left-turn movement at this intersection would be one vehicle. Currently the westbound approach is striped with a painted median, which would provide sufficient storage if restriped as a left-turn pocket. Without restriping, the proposed project may adverseley affect vehicle queuing at the westbound leg of the Hamilton/Cherrydale intersection. The project applicant should develop a restriping plan for this intersection to create a left-turn pocket to accommodate the new movement. Page 29
31 15 Hamilton Avenue Primrose Daycare Center TIA January 16, 215 Hamilton Avenue and Meridian Avenue Westbound Turns: The proposed project would add 4 vehicles during the AM peak hour and 5 vehicles during the PM peak hour to this movement. The queuing analysis indicates that the 95 th percentile vehicle queue for the westbound left-turn movement would not exceed the available storage length with the project. Southbound Turns: The proposed project would add 18 vehicles to this turning movement during both the AM and PM peak hours. The queuing analysis indicates that the 95 th percentile vehicle queue exceeds the turn pocket length both with and without the project. However, the striped turn pocket is backed by a two-way left turn lane that provides additional storage. Therefore, the left turn queues would not block through traffic. Page 3
32 15 Hamilton Avenue Primrose Daycare Center TIA January 16, 215 Table 6 Vehicle Queuing and -Turn Pocket Storage Analysis Hamilton Av & Cherrydale Dr Hamilton Av & Meridian Av Movem ent: WBL SBL WBL Peak Hour Period: AM PM AM PM AM PM Existing Cycle/Delay 1 (sec) Volume (vphpl ) Avg. Queue (veh/ln.) Avg. Queue 2 (ft./ln) th %. Queue (veh/ln.) th %. Queue (ft./ln) Storage (ft./ ln.) Adequate (Y/N) Y 3 Y 3 Y Y Existing Plus Project Cycle/Delay 1 (sec) Volume (vphpl ) Avg. Queue (veh/ln.) Avg. Queue 2 (ft./ln) th %. Queue (veh/ln.) th %. Queue (ft./ln) Storage (ft./ ln.) Adequate (Y/N) N N Y 3 Y 3 Y Y Notes: 1 Vehicle queue calculations based on cycle length for signalized intersections; movement delay for unsignalized intersections. 2 Assumes 25 feet per vehicle queued. 3 Although there is only about 2 feet of striping for the left-turn pocket, the two-way center left-turn lane provides adequate overflow storage. Unsignalized Intersection Operations Analysis Intersection operations were analyzed at both unsignalized study intersections under both Existing and Existing/Background plus Project conditions. Under existing conditions, neither intersection experiences any operational issues. Minor approach volumes on Hamilton Way and Cherrydale Drive are extremely low and include few left-turn movements. turn pockets are present at both intersections for vehicles making left turns off of Hamilton Avenue. During field observations, traffic on Hamilton Avenue flowed in well-defined platoons from the signalized intersections at Meridian Avenue and Hicks Avenue, providing ample gap times for left turns. With the addition of a new left-turn pocket on westbound Hamilton Avenue at Cherrydale Drive, the proposed project would not significantly impact either intersection. Transit Facilities Analysis As previously discussed, it is assumed that most parents are dropping-off/picking-up their children en route to/from their work places. Possible new transit riders related to the project could be generated by staff and parents who take transit to work. The existing transit facilities are adequate to meet this increased demand. Page 31
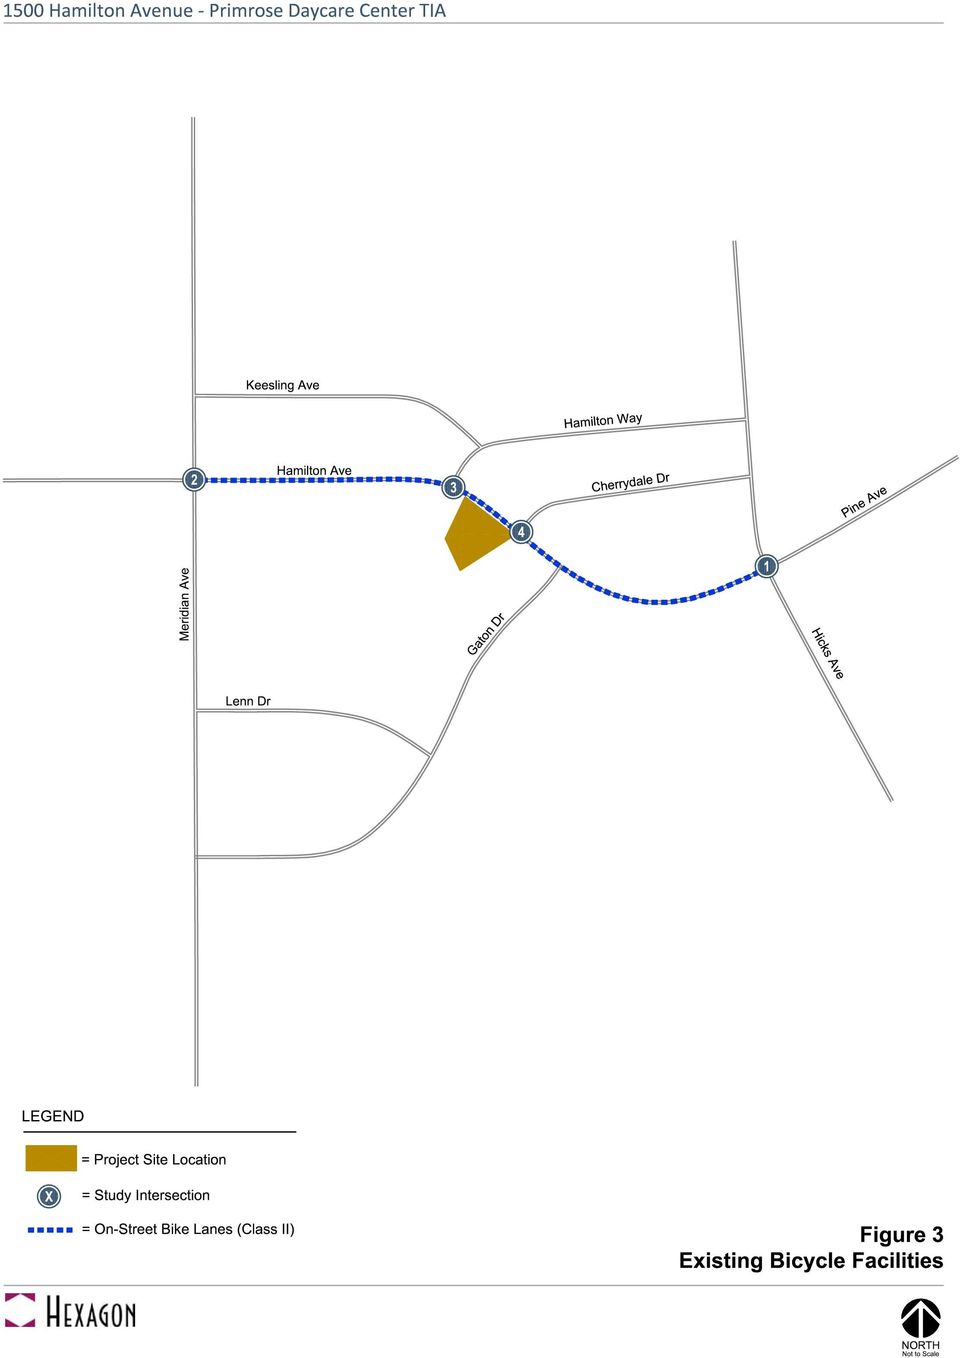
33 15 Hamilton Avenue Primrose Daycare Center TIA January 16, 215 Pedestrian and Bicycle Facilities Analysis Sidewalks are present along both sides of Hamilton Avenue, with crosswalks across the minor street approaches at Hamilton Drive and Gaton Drive and a high visibility crosswalk across Hamilton Avenue within 1 feet of the project site. While the residential streets near the study area are acceptable for bicycle use, only the segment of Hamilton Avenue between Meridian Avenue and Hicks Avenue has designated Class II bike lanes. This segment provides direct access to the project site. None of the other surrounding major streets provide bicycle facilities. Most students are assumed to be dropped-off and picked-up by car, but pedestrian/bicycle volumes could be generated by staff or parents who live and work close by. The existing bicycle and pedestrian facilities are adequate to meet increased demand. If bicycle facilities were improved on Hamilton Avenue and Meridian Avenue, a larger proportion of these individuals may choose to commute by bicycle. To further the goals of City of San Jose General Plan 24, the existing high-visibility crosswalk at Hamilton Way is planned to be modified to add Rectangular Rapid Flash Beacons (RRFB) to enhance pedestrian crossing and alert motorists. The project has agreed to install the planned beacons. Page 32
34 15 Hamilton Avenue Primrose Daycare Center TIA January 16, Conclusions This study was conducted for the purpose of identifying the potential traffic impacts related to the Primrose daycare center at 15 Hamilton Avenue in San Jose, California. The impacts of the project were evaluated following the standards and methodologies set forth by the City of San Jose. Project impacts on other transportation categories, such as site access, on-site circulation, parking, vehicle queuing, as well as impact on transit, pedestrian and bicycle facilities were determined on the basis of engineering judgment. Intersection Levels of Service The results of the intersection level of service analysis show that the study intersection at Hamilton Avenue and Meridian Avenue is expected to continue to operate at an unacceptable LOS E under project conditions and will not experience a significant impact. The other signalized intersection at Hamilton Avenue and Hicks Avenue will continue to operate at LOS B or better. Other Transportation Issues Hexagon has performed a detailed review of the proposed site plan as shown in Figure 2. Based on standard engineering judgment, we have analyzed the proposed project with regard to site access and circulation, signal warrants, vehicle queuing, and impacts on transit, pedestrian, and bicycle facilities. Site Access The project has proposed one driveway on Hamilton Avenue, opposite Cherrydale Drive. Hexagon has determined that this driveway provides sufficient vehicular site access. An alternate right-in/out driveway design would eliminate left turning movements into and out of the project site, reducing queuing at the expense of inconveniencing some drivers. Hexagon recommends that a full access driveway be provided. The full access driveway would operate without queuing or safety issues and would eliminate the need for u-turns to access the site. The proposed driveway and the surrounding landscaping should provide sufficient sight distance in accordance with the Caltrans stopping sight distance standards. Hexagon has recommended the applicant to set-back any planned vegetation at the outer edges of the sidewalks or install only low-growing plants. On-site Circulation Hexagon has reviewed the site plan and determined that fire trucks and garbage trucks would experience no onsite circulation issues. Page 33
35 15 Hamilton Avenue Primrose Daycare Center TIA January 16, 215 Hexagon has reviewed the on-site parking dimensions and determined that the 8 parking spaces on the northern parking section meet the minimal parking stall dimensions for compact cars, and the 26 parking spaces on the southern parking section meet the minimal parking stall dimensions for full size cars, if planned overhang length is taken into account. Hexagon has recommended that the applicant coordinate with City staff to confirm that the planned overhang is acceptable. Hexagon has determined that the on-site parking drive aisle width does not meet the City standards but is unlikely to generate significant on-site circulation issues. Hexagon has recommended that the applicant coordinate with City staff to confirm that the planned aisle width is acceptable. Student Drop-off/Pick-up Operations Hexagon has determined that there are no on-site queuing issues related to the drop-off and pick-up operations. Hexagon has determined that there is adequate facility to assist pedestrian on-site circulation. Parking Evaluation Hexagon has reviewed the proposed site plan and determined that the 36 parking spaces proposed by the project meets the City Parking Code. Signal Warrants Based on the result of the signal warrant analysis, the unsignalized intersection at Hamilton Avenue and Cherrydale Drive is not warranted for a traffic signal under either study scenario. Vehicle Queuing Hexagon has conducted a queuing analysis at the intersection of Hamilton Avenue and Cherrydale Drive. Currently, the intersection does not include a westbound left-turn movement, and does not provide a left-turn pocket. The project applicant should develop a restriping plan to convert the existing painted median to a left-turn pocket to accommodate the new movement. Transit, Pedestrian, and Bicycle Facilities Analysis The project may produce some transit trips from staff and parents who take transit to work. Some bicycle and pedestrian trips would likely be produced by staff and parents who live nearby. The existing transit and bicycle facilities are adequate to meet this increased demand. The City would like to enhance pedestrian access in the area by adding Rectangular Rapid Flash Beacons (RRFB) to the pedestrian crossing at Hamilton Way. The project has agreed to install the planned beacons. Page 34
36 15 Hamilton Avenue Primrose Daycare Center TIA Technical Appendices
37 Appendix A Traffic Counts and Approved Trip Inventory
38 All Traffic Data Services 2187 Kingsbury Cir Santa Clara, CA, File Name : #1 MERIDIAN&HAMILTONAM Site Code : 1 Start Date : 5/21/214 Page No : 1 Groups Printed- ALL VEHICLES MERIDIAN AVE Southbound Westbound MERIDIAN AVE Northbound Eastbound Start Time Int. Total 7: AM :15 AM :3 AM :45 AM Total : AM :15 AM :3 AM :45 AM Total Grand Total Apprch % Total % MERIDIAN AVE North 5/21/214 7: AM 5/21/214 8:45 AM ALL VEHICLES MERIDIAN AVE
39 All Traffic Data Services 2187 Kingsbury Cir Santa Clara, CA, File Name : #1 MERIDIAN&HAMILTONAM Site Code : 1 Start Date : 5/21/214 Page No : 2 MERIDIAN AVE Southbound Westbound MERIDIAN AVE Northbound Eastbound Start Time App. Total App. Total App. Total App. Total Int. Total Peak Hour Analysis From 7: AM to 8:45 AM - Peak 1 of 1 Peak Hour for Entire Intersection Begins at 7:45 AM 7:45 AM : AM :15 AM :3 AM Total Volume % App. Total PHF MERIDIAN AVE Peak Hour Data North Peak Hour Begins at 7:45 AM ALL VEHICLES MERIDIAN AVE
40 File Name: C:\Users\Nathan\Desktop\ATD\PETRA\HEXAGON\ PRIMROSE DAYCARE 5-214\2 HOUR\#1 MERIDIAN&HAMILTONAM.ppd Start Date: 5/21/214 Start Time: 7:: AM Site Code: 1 Comment 1: Comment 2: Comment 3: Comment 4: MERIDIAN AVE MERIDIAN AVE Southbound Westbound Northbound Eastbound Start Time 7: AM 1 2 7:15 AM 1 7:3 AM 7:45 AM : AM 1 8:15 AM 8:3 AM 3 3 8:45 AM
41 All Traffic Data Services 2187 Kingsbury Cir Santa Clara, CA, File Name : #1 MERIDIAN&HAMILTONPM Site Code : 1 Start Date : 5/21/214 Page No : 1 Groups Printed- ALL VEHICLES MERIDIAN AVE Southbound Westbound MERIDIAN AVE Northbound Eastbound Start Time Int. Total 4: PM :15 PM :3 PM :45 PM Total : PM :15 PM :3 PM :45 PM Total Grand Total Apprch % Total % MERIDIAN AVE North 5/21/214 4: PM 5/21/214 5:45 PM ALL VEHICLES MERIDIAN AVE
42 All Traffic Data Services 2187 Kingsbury Cir Santa Clara, CA, File Name : #1 MERIDIAN&HAMILTONPM Site Code : 1 Start Date : 5/21/214 Page No : 2 MERIDIAN AVE Southbound Westbound MERIDIAN AVE Northbound Eastbound Start Time App. Total App. Total App. Total App. Total Int. Total Peak Hour Analysis From 4: PM to 5:45 PM - Peak 1 of 1 Peak Hour for Entire Intersection Begins at 5: PM 5: PM :15 PM :3 PM :45 PM Total Volume % App. Total PHF MERIDIAN AVE Peak Hour Data North Peak Hour Begins at 5: PM ALL VEHICLES MERIDIAN AVE
43 File Name: C:\Users\Nathan\Desktop\ATD\PETRA\HEXAGON\ PRIMROSE DAYCARE 5-214\2 HOUR\#1 MERIDIAN&HAMILTONPM.ppd Start Date: 5/21/214 Start Time: 4:: PM Site Code: 1 Comment 1: Comment 2: Comment 3: Comment 4: MERIDIAN AVE MERIDIAN AVE Southbound Westbound Northbound Eastbound Start Time 4: PM 1 4:15 PM 1 4:3 PM 4:45 PM 1 1 5: PM 1 1 5:15 PM 1 1 5:3 PM 2 5:45 PM
44 All Traffic Data Services 2187 Kingsbury Cir Santa Clara, CA, File Name : #2 HAMILTONWAY&HAMILTONAM Site Code : 2 Start Date : 5/21/214 Page No : 1 Groups Printed- ALL VEHICLES HAMILTON WAY Southbound Westbound HAMILTON WAY Northbound Eastbound Start Time Int. Total 7: AM :15 AM :3 AM :45 AM Total : AM :15 AM :3 AM :45 AM Total Grand Total Apprch % Total % HAMILTON WAY North 5/21/214 7: AM 5/21/214 8:45 AM ALL VEHICLES HAMILTON WAY
45 All Traffic Data Services 2187 Kingsbury Cir Santa Clara, CA, File Name : #2 HAMILTONWAY&HAMILTONAM Site Code : 2 Start Date : 5/21/214 Page No : 2 HAMILTON WAY Southbound Westbound HAMILTON WAY Northbound Eastbound Start Time App. Total App. Total App. Total App. Total Int. Total Peak Hour Analysis From 7: AM to 8:45 AM - Peak 1 of 1 Peak Hour for Entire Intersection Begins at 8: AM 8: AM :15 AM :3 AM :45 AM Total Volume % App. Total PHF HAMILTON WAY Peak Hour Data North Peak Hour Begins at 8: AM ALL VEHICLES HAMILTON WAY
46 File Name: C:\Users\Nathan\Desktop\ATD\PETRA\HEXAGON\ PRIMROSE DAYCARE 5-214\2 HOUR\#2 HAMILTONWAY&HAMILTONAM.ppd Start Date: 5/21/214 Start Time: 7:: AM Site Code: 2 Comment 1: Comment 2: Comment 3: Comment 4: HAMILTON WAY HAMILTON WAY Southbound Westbound Northbound Eastbound Start Time 7: AM 1 7:15 AM 7:3 AM 1 7:45 AM 1 2 8: AM 8:15 AM 1 8:3 AM :45 AM 1 1 1
47 All Traffic Data Services 2187 Kingsbury Cir Santa Clara, CA, File Name : #2 HAMILTONWAY&HAMILTONPM Site Code : 2 Start Date : 5/21/214 Page No : 1 Groups Printed- ALL VEHICLES HAMILTON WAY Southbound Westbound HAMILTON WAY Northbound Eastbound Start Time Int. Total 4: PM :15 PM :3 PM :45 PM Total : PM :15 PM :3 PM :45 PM Total Grand Total Apprch % Total % HAMILTON WAY North 5/21/214 4: PM 5/21/214 5:45 PM ALL VEHICLES HAMILTON WAY
48 All Traffic Data Services 2187 Kingsbury Cir Santa Clara, CA, File Name : #2 HAMILTONWAY&HAMILTONPM Site Code : 2 Start Date : 5/21/214 Page No : 2 HAMILTON WAY Southbound Westbound HAMILTON WAY Northbound Eastbound Start Time App. Total App. Total App. Total App. Total Int. Total Peak Hour Analysis From 4: PM to 5:45 PM - Peak 1 of 1 Peak Hour for Entire Intersection Begins at 5: PM 5: PM :15 PM :3 PM :45 PM Total Volume % App. Total PHF HAMILTON WAY Peak Hour Data North Peak Hour Begins at 5: PM ALL VEHICLES HAMILTON WAY
49 File Name: C:\Users\Nathan\Desktop\ATD\PETRA\HEXAGON\ PRIMROSE DAYCARE 5-214\2 HOUR\#2 HAMILTONWAY&HAMILTONPM.ppd Start Date: 5/21/214 Start Time: 4:: PM Site Code: 2 Comment 1: Comment 2: Comment 3: Comment 4: HAMILTON WAY HAMILTON WAY Southbound Westbound Northbound Eastbound Start Time 4: PM 3 4:15 PM 1 4:3 PM 4:45 PM 1 5: PM 5:15 PM 5:3 PM 1 5:45 PM 1 1
50 All Traffic Data Services 2187 Kingsbury Cir Santa Clara, CA, File Name : #3 CHERRYDALE&HAMILTONAM Site Code : 3 Start Date : 5/21/214 Page No : 1 Groups Printed- ALL VEHICLES CHERRYDALE DR Southbound Westbound CHERRYDALE DR Northbound Eastbound Start Time Int. Total 7: AM :15 AM :3 AM :45 AM Total : AM :15 AM :3 AM :45 AM Total Grand Total Apprch % Total % CHERRYDALE DR North 5/21/214 7: AM 5/21/214 8:45 AM ALL VEHICLES CHERRYDALE DR
51 All Traffic Data Services 2187 Kingsbury Cir Santa Clara, CA, File Name : #3 CHERRYDALE&HAMILTONAM Site Code : 3 Start Date : 5/21/214 Page No : 2 CHERRYDALE DR Southbound Westbound CHERRYDALE DR Northbound Eastbound Start Time App. Total App. Total App. Total App. Total Int. Total Peak Hour Analysis From 7: AM to 8:45 AM - Peak 1 of 1 Peak Hour for Entire Intersection Begins at 7:15 AM 7:15 AM :3 AM :45 AM : AM Total Volume % App. Total PHF CHERRYDALE DR Peak Hour Data North Peak Hour Begins at 7:15 AM ALL VEHICLES CHERRYDALE DR
52 File Name: C:\Users\Nathan\Desktop\ATD\PETRA\HEXAGON\ PRIMROSE DAYCARE 5-214\2 HOUR\#3 CHERRYDALE&HAMILTONAM.ppd Start Date: 5/21/214 Start Time: 7:: AM Site Code: 3 Comment 1: Comment 2: Comment 3: Comment 4: CHERRYDALE DR CHERRYDALE DR Southbound Westbound Northbound Eastbound Start Time 7: AM 7:15 AM 3 7:3 AM 7:45 AM 2 8: AM 8:15 AM 1 8:3 AM 1 8:45 AM 1
53 All Traffic Data Services 2187 Kingsbury Cir Santa Clara, CA, File Name : #3 CHERRYDALE&HAMILTONPM Site Code : 3 Start Date : 5/21/214 Page No : 1 Groups Printed- ALL VEHICLES CHERRYDALE DR Southbound Westbound CHERRYDALE DR Northbound Eastbound Start Time Int. Total 4: PM :15 PM :3 PM :45 PM Total : PM :15 PM :3 PM :45 PM Total Grand Total Apprch % Total % CHERRYDALE DR North 5/21/214 4: PM 5/21/214 5:45 PM ALL VEHICLES CHERRYDALE DR
54 All Traffic Data Services 2187 Kingsbury Cir Santa Clara, CA, File Name : #3 CHERRYDALE&HAMILTONPM Site Code : 3 Start Date : 5/21/214 Page No : 2 CHERRYDALE DR Southbound Westbound CHERRYDALE DR Northbound Eastbound Start Time App. Total App. Total App. Total App. Total Int. Total Peak Hour Analysis From 4: PM to 5:45 PM - Peak 1 of 1 Peak Hour for Entire Intersection Begins at 5: PM 5: PM :15 PM :3 PM :45 PM Total Volume % App. Total PHF CHERRYDALE DR Peak Hour Data North Peak Hour Begins at 5: PM ALL VEHICLES CHERRYDALE DR
55 File Name: C:\Users\Nathan\Desktop\ATD\PETRA\HEXAGON\ PRIMROSE DAYCARE 5-214\2 HOUR\#3 CHERRYDALE&HAMILTONPM.ppd Start Date: 5/21/214 Start Time: 4:: PM Site Code: 3 Comment 1: Comment 2: Comment 3: Comment 4: CHERRYDALE DR CHERRYDALE DR Southbound Westbound Northbound Eastbound Start Time 4: PM 3 4:15 PM 1 2 4:3 PM 4:45 PM 1 5: PM 1 2 5:15 PM 2 5:3 PM 5:45 PM 1
56 All Traffic Data Services 2187 Kingsbury Cir Santa Clara, CA, File Name : #6 HICKS&PINEAM Site Code : 6 Start Date : 5/21/214 Page No : 1 Groups Printed- ALL VEHICLES HICKS AVE Southbound PINE AVE Westbound HICKS AVE Northbound PINE AVE Eastbound Start Time Int. Total 7: AM :15 AM :3 AM :45 AM Total : AM :15 AM :3 AM :45 AM Total Grand Total Apprch % Total % HICKS AVE PINE AVE North 5/21/214 7: AM 5/21/214 8:45 AM ALL VEHICLES PINE AVE HICKS AVE
57 All Traffic Data Services 2187 Kingsbury Cir Santa Clara, CA, File Name : #6 HICKS&PINEAM Site Code : 6 Start Date : 5/21/214 Page No : 2 HICKS AVE Southbound PINE AVE Westbound HICKS AVE Northbound PINE AVE Eastbound Start Time App. Total App. Total App. Total App. Total Int. Total Peak Hour Analysis From 7: AM to 8:45 AM - Peak 1 of 1 Peak Hour for Entire Intersection Begins at 7:15 AM 7:15 AM :3 AM :45 AM : AM Total Volume % App. Total PHF HICKS AVE Peak Hour Data PINE AVE North Peak Hour Begins at 7:15 AM ALL VEHICLES PINE AVE HICKS AVE
58 File Name: C:\Users\Nathan\Desktop\ATD\PETRA\HEXAGON\ PRIMROSE DAYCARE 5-214\2 HOUR\#6 HICKS&PINEAM.ppd Start Date: 5/21/214 Start Time: 7:: AM Site Code: 6 Comment 1: Comment 2: Comment 3: Comment 4: HICKS AVE PINE AVE HICKS AVE PINE AVE Southbound Westbound Northbound Eastbound Start Time 7: AM 2 7:15 AM 1 7:3 AM 2 7:45 AM 1 1 8: AM 1 8:15 AM 1 8:3 AM 2 8:45 AM
59 All Traffic Data Services 2187 Kingsbury Cir Santa Clara, CA, File Name : #6 HICKS&PINEPM Site Code : 6 Start Date : 5/21/214 Page No : 1 Groups Printed- ALL VEHICLES HICKS AVE Southbound PINE AVE Westbound HICKS AVE Northbound PINE AVE Eastbound Start Time Int. Total 4: PM :15 PM :3 PM :45 PM Total : PM :15 PM :3 PM :45 PM Total Grand Total Apprch % Total % HICKS AVE PINE AVE North 5/21/214 4: PM 5/21/214 5:45 PM ALL VEHICLES PINE AVE HICKS AVE
60 All Traffic Data Services 2187 Kingsbury Cir Santa Clara, CA, File Name : #6 HICKS&PINEPM Site Code : 6 Start Date : 5/21/214 Page No : 2 HICKS AVE Southbound PINE AVE Westbound HICKS AVE Northbound PINE AVE Eastbound Start Time App. Total App. Total App. Total App. Total Int. Total Peak Hour Analysis From 4: PM to 5:45 PM - Peak 1 of 1 Peak Hour for Entire Intersection Begins at 5: PM 5: PM :15 PM :3 PM :45 PM Total Volume % App. Total PHF HICKS AVE Peak Hour Data PINE AVE North Peak Hour Begins at 5: PM ALL VEHICLES PINE AVE HICKS AVE
61 File Name: C:\Users\Nathan\Desktop\ATD\PETRA\HEXAGON\ PRIMROSE DAYCARE 5-214\2 HOUR\#6 HICKS&PINEPM.ppd Start Date: 5/21/214 Start Time: 4:: PM Site Code: 6 Comment 1: Comment 2: Comment 3: Comment 4: HICKS AVE PINE AVE HICKS AVE PINE AVE Southbound Westbound Northbound Eastbound Start Time 4: PM :15 PM 4:3 PM 1 4:45 PM 3 5: PM :15 PM 2 5:3 PM 2 5:45 PM
62 ATTACHMENT A STUDY INTERSECTIONS FOR 8 W SAN CARLOS STREET NODE # INTERSECTION PEAK Date New Count Req'd 3566 HAMILTON / HICKS AM 3/19/29 X PM 3/19/29 X 3568 HAMILTON / MERIDIAN AM 1/27/29 X PM 1/27/29 X CMP ATI COMMENTS NA NO APPROVED AM/PM TRIPS NA NO APPROVED AM/PM TRIPS X-Indicates required or included. (Anal.: analysis, Ex.: existing counts, ATI: approved trips inventory, CMP: congestion management program) Page 1 7/1/214
63 Location: Hamilton Way W/O Hicks Ave Date Range: 1/21/214 to 1/23/214 Site Code: 1 Tuesday Wednesday Thursday Friday Saturday Sunday Monday 1/21/214 1/22/214 1/23/214 1/24/214 1/25/214 1/26/214 1/27/214 Mid-Week Average Time EB WB Total EB WB Total EB WB Total EB WB Total EB WB Total EB WB Total EB WB Total EB WB Total 12: AM : AM : AM : AM : AM : AM : AM : AM : AM : AM : AM : AM : PM : PM : PM : PM : PM : PM : PM : PM : PM : PM : PM : PM Total 598 1,131 1, ,78 1, ,144 1, ,118 1,683 Percent 35% 65% - 34% 66% - 32% 68% % 66% - 1. Mid-week average includes data between Tuesday and Thursday. Mark Skaggs: [email protected] 1
64 Location: Cherrydale Dr W/O Hicks Dr Date Range: 1/21/214 to 1/23/214 Site Code: 2 Tuesday Wednesday Thursday Friday Saturday Sunday Monday 1/21/214 1/22/214 1/23/214 1/24/214 1/25/214 1/26/214 1/27/214 Mid-Week Average Time EB WB Total EB WB Total EB WB Total EB WB Total EB WB Total EB WB Total EB WB Total EB WB Total 12: AM : AM : AM : AM : AM : AM : AM : AM : AM : AM : AM : AM : PM : PM : PM : PM : PM : PM : PM : PM : PM : PM : PM : PM Total Percent 47% 53% - 44% 56% - 4% 6% % 57% - 1. Mid-week average includes data between Tuesday and Thursday. Mark Skaggs: [email protected] 1

65 Location: Gaton Dr S/O Lenn Dr Date Range: 1/21/214 to 1/23/214 Site Code: 3 Tuesday Wednesday Thursday Friday Saturday Sunday Monday 1/21/214 1/22/214 1/23/214 1/24/214 1/25/214 1/26/214 1/27/214 Mid-Week Average Time NB SB Total NB SB Total NB SB Total NB SB Total NB SB Total NB SB Total NB SB Total NB SB Total 12: AM : AM : AM : AM : AM : AM : AM : AM : AM : AM : AM : AM : PM : PM : PM : PM : PM : PM : PM : PM : PM : PM : PM : PM Total Percent 43% 57% - 42% 58% - 42% 58% % 58% - 1. Mid-week average includes data between Tuesday and Thursday. Mark Skaggs: [email protected] 1
66 Appendix B Intersection Level of Service Calculations
67 COMPARE Thu Jul 31 11:14:4 214 Page 3-26 Intersection #3566: HAMILTON/HICKS Primrose Daycare Center Peak Hour Conditions Hexagon Transportation Associates, Inc. Level Of Service Computation Report 2 HCM Operations (Future Volume Alternative) Existing (AM) Signal=Permit/s=Include Final Vol: Lanes: 1 1 Signal=Permit Signal=Permit Final Vol: Lanes: s=include Vol Cnt Date: 5/21/214 s=include Lanes: Final Vol: 22 1 Cycle Time (sec): Loss Time (sec): Critical V/C: *** Avg Crit Del (sec/veh): Avg Delay (sec/veh): LOS: B+ Lanes: 1 1 Final Vol: *** 18 Signal=Permit/s=Include Approach: North Bound South Bound East Bound West Bound Movement: L - T - R L - T - R L - T - R L - T - R Min. Green: Y+R: Volume Module: >> Count Date: 21 May 214 << 7:15-8:15AM Base Vol: Growth Adj: Initial Bse: Added Vol: ATI: Initial Fut: User Adj: PHF Adj: PHF Volume: Reduct Vol: Reduced Vol: PCE Adj: MLF Adj: FinalVolume: Saturation Flow Module: Sat/Lane: Adjustment: Lanes: Final Sat.: Capacity Analysis Module: Vol/Sat: Crit Moves: **** **** Green Time: Volume/Cap: Delay/Veh: User DelAdj: AdjDel/Veh: LOS by Move: A A A A A A B+ B B B+ B B+ HCM2kAvgQ: Note: Queue reported is the number of cars per lane. Traffix Copyright (c) 28 Dowling Associates, Inc. Licensed to Hexagon Trans., San Jose
68 COMPARE Thu Jul 31 11:14:4 214 Page 3-27 Intersection #3566: HAMILTON/HICKS Primrose Daycare Center Peak Hour Conditions Hexagon Transportation Associates, Inc. Level Of Service Computation Report 2 HCM Operations (Future Volume Alternative) Existing + Project (AM) Signal=Permit/s=Include Final Vol: Lanes: 1 1 Signal=Permit Signal=Permit Final Vol: Lanes: s=include Vol Cnt Date: 5/21/214 s=include Lanes: Final Vol: 27 1 Cycle Time (sec): Loss Time (sec): Critical V/C: *** Avg Crit Del (sec/veh): Avg Delay (sec/veh): LOS: B+ Lanes: 1 1 Final Vol: *** 18 Signal=Permit/s=Include Approach: North Bound South Bound East Bound West Bound Movement: L - T - R L - T - R L - T - R L - T - R Min. Green: Y+R: Volume Module: >> Count Date: 21 May 214 << 7:15-8:15AM Base Vol: Growth Adj: Initial Bse: Added Vol: ATI: Initial Fut: User Adj: PHF Adj: PHF Volume: Reduct Vol: Reduced Vol: PCE Adj: MLF Adj: FinalVolume: Saturation Flow Module: Sat/Lane: Adjustment: Lanes: Final Sat.: Capacity Analysis Module: Vol/Sat: Crit Moves: **** **** Green Time: Volume/Cap: Delay/Veh: User DelAdj: AdjDel/Veh: LOS by Move: A A A A A A B+ B B B+ B B+ HCM2kAvgQ: Note: Queue reported is the number of cars per lane. Traffix Copyright (c) 28 Dowling Associates, Inc. Licensed to Hexagon Trans., San Jose
69 COMPARE Thu Jul 31 11:14:4 214 Page 3-29 Intersection #3568: HAMILTON/MERIDIAN Primrose Daycare Center Peak Hour Conditions Hexagon Transportation Associates, Inc. Level Of Service Computation Report 2 HCM Operations (Future Volume Alternative) Existing (AM) Signal=Protect/s=Include Final Vol: 276*** Lanes: Signal=Protect Signal=Protect Final Vol: Lanes: s=include Vol Cnt Date: 5/21/214 s=include Lanes: Final Vol: 196*** 1 Cycle Time (sec): Loss Time (sec): Critical V/C: *** Avg Crit Del (sec/veh): Avg Delay (sec/veh): LOS: E+ Lanes: Final Vol: 577*** Signal=Protect/s=Include Approach: North Bound South Bound East Bound West Bound Movement: L - T - R L - T - R L - T - R L - T - R Min. Green: Y+R: Volume Module: >> Count Date: 21 May 214 << 7:45-8:45 AM Base Vol: Growth Adj: Initial Bse: Added Vol: ATI: Initial Fut: User Adj: PHF Adj: PHF Volume: Reduct Vol: Reduced Vol: PCE Adj: MLF Adj: FinalVolume: Saturation Flow Module: Sat/Lane: Adjustment: Lanes: Final Sat.: Capacity Analysis Module: Vol/Sat: Crit Moves: **** **** **** **** Green Time: Volume/Cap: Delay/Veh: User DelAdj: AdjDel/Veh: LOS by Move: D- C- C- F E F F D D E E E HCM2kAvgQ: Note: Queue reported is the number of cars per lane. Traffix Copyright (c) 28 Dowling Associates, Inc. Licensed to Hexagon Trans., San Jose
70 COMPARE Thu Jul 31 11:14:4 214 Page 3-3 Intersection #3568: HAMILTON/MERIDIAN Primrose Daycare Center Peak Hour Conditions Hexagon Transportation Associates, Inc. Level Of Service Computation Report 2 HCM Operations (Future Volume Alternative) Existing + Project (AM) Signal=Protect/s=Include Final Vol: 276*** Lanes: Signal=Protect Signal=Protect Final Vol: Lanes: s=include Vol Cnt Date: 5/21/214 s=include Lanes: Final Vol: 196*** 1 Cycle Time (sec): Loss Time (sec): Critical V/C: *** Avg Crit Del (sec/veh): Avg Delay (sec/veh): LOS: E+ Lanes: Final Vol: 577*** Signal=Protect/s=Include Approach: North Bound South Bound East Bound West Bound Movement: L - T - R L - T - R L - T - R L - T - R Min. Green: Y+R: Volume Module: >> Count Date: 21 May 214 << 7:45-8:45 AM Base Vol: Growth Adj: Initial Bse: Added Vol: ATI: Initial Fut: User Adj: PHF Adj: PHF Volume: Reduct Vol: Reduced Vol: PCE Adj: MLF Adj: FinalVolume: Saturation Flow Module: Sat/Lane: Adjustment: Lanes: Final Sat.: Capacity Analysis Module: Vol/Sat: Crit Moves: **** **** **** **** Green Time: Volume/Cap: Delay/Veh: User DelAdj: AdjDel/Veh: LOS by Move: E+ D+ D+ F E F F D D E E E HCM2kAvgQ: Note: Queue reported is the number of cars per lane. Traffix Copyright (c) 28 Dowling Associates, Inc. Licensed to Hexagon Trans., San Jose
71 COMPARE Thu Jul 31 11:8:3 214 Page 3-26 Intersection #3566: HAMILTON/HICKS Primrose Daycare Center Peak Hour Conditions Hexagon Transportation Associates, Inc. Level Of Service Computation Report 2 HCM Operations (Future Volume Alternative) Existing (PM) Signal=Permit/s=Include Final Vol: Lanes: 1 1 Signal=Permit Signal=Permit Final Vol: Lanes: s=include Vol Cnt Date: 5/21/214 s=include Lanes: Final Vol: 27 1 Cycle Time (sec): Loss Time (sec): 6 622*** 1 Critical V/C: Avg Crit Del (sec/veh): Avg Delay (sec/veh): LOS: A Lanes: 1 1 Final Vol: 13 85*** 3 Signal=Permit/s=Include Approach: North Bound South Bound East Bound West Bound Movement: L - T - R L - T - R L - T - R L - T - R Min. Green: Y+R: Volume Module: >> Count Date: 21 May 214 << 5:-6: PM Base Vol: Growth Adj: Initial Bse: Added Vol: ATI: Initial Fut: User Adj: PHF Adj: PHF Volume: Reduct Vol: Reduced Vol: PCE Adj: MLF Adj: FinalVolume: Saturation Flow Module: Sat/Lane: Adjustment: Lanes: Final Sat.: Capacity Analysis Module: Vol/Sat: Crit Moves: **** **** Green Time: Volume/Cap: Delay/Veh: User DelAdj: AdjDel/Veh: LOS by Move: C+ C+ B- C+ C+ B- A A A A A A HCM2kAvgQ: Note: Queue reported is the number of cars per lane. Traffix Copyright (c) 28 Dowling Associates, Inc. Licensed to Hexagon Trans., San Jose
72 COMPARE Thu Jul 31 11:8:3 214 Page 3-27 Intersection #3566: HAMILTON/HICKS Primrose Daycare Center Peak Hour Conditions Hexagon Transportation Associates, Inc. Level Of Service Computation Report 2 HCM Operations (Future Volume Alternative) Existing + Project (PM) Signal=Permit/s=Include Final Vol: Lanes: 1 1 Signal=Permit Signal=Permit Final Vol: Lanes: s=include Vol Cnt Date: 5/21/214 s=include Lanes: Final Vol: 33 1 Cycle Time (sec): Loss Time (sec): 6 64*** 1 Critical V/C: Avg Crit Del (sec/veh): Avg Delay (sec/veh): LOS: A Lanes: 1 1 Final Vol: *** 3 Signal=Permit/s=Include Approach: North Bound South Bound East Bound West Bound Movement: L - T - R L - T - R L - T - R L - T - R Min. Green: Y+R: Volume Module: >> Count Date: 21 May 214 << 5:-6: PM Base Vol: Growth Adj: Initial Bse: Added Vol: ATI: Initial Fut: User Adj: PHF Adj: PHF Volume: Reduct Vol: Reduced Vol: PCE Adj: MLF Adj: FinalVolume: Saturation Flow Module: Sat/Lane: Adjustment: Lanes: Final Sat.: Capacity Analysis Module: Vol/Sat: Crit Moves: **** **** Green Time: Volume/Cap: Delay/Veh: User DelAdj: AdjDel/Veh: LOS by Move: C+ C+ B- C+ C+ B- A A A A A A HCM2kAvgQ: Note: Queue reported is the number of cars per lane. Traffix Copyright (c) 28 Dowling Associates, Inc. Licensed to Hexagon Trans., San Jose
73 COMPARE Thu Jul 31 11:8:3 214 Page 3-29 Intersection #3568: HAMILTON/MERIDIAN Primrose Daycare Center Peak Hour Conditions Hexagon Transportation Associates, Inc. Level Of Service Computation Report 2 HCM Operations (Future Volume Alternative) Existing (PM) Signal=Protect/s=Include Final Vol: *** 224 Lanes: Signal=Protect Signal=Protect Final Vol: Lanes: s=include Vol Cnt Date: 5/21/214 s=include Lanes: Final Vol: 31 1 Cycle Time (sec): Loss Time (sec): Critical V/C: Avg Crit Del (sec/veh): *** 1 Avg Delay (sec/veh): *** LOS: E+ Lanes: Final Vol: 22*** Signal=Protect/s=Include Approach: North Bound South Bound East Bound West Bound Movement: L - T - R L - T - R L - T - R L - T - R Min. Green: Y+R: Volume Module: >> Count Date: 21 May 214 << 5:-6:PM Base Vol: Growth Adj: Initial Bse: Added Vol: ATI: Initial Fut: User Adj: PHF Adj: PHF Volume: Reduct Vol: Reduced Vol: PCE Adj: MLF Adj: FinalVolume: Saturation Flow Module: Sat/Lane: Adjustment: Lanes: Final Sat.: Capacity Analysis Module: Vol/Sat: Crit Moves: **** **** **** **** Green Time: Volume/Cap: Delay/Veh: User DelAdj: AdjDel/Veh: LOS by Move: F D- D- E D- D E+ D E+ F E E HCM2kAvgQ: Note: Queue reported is the number of cars per lane. Traffix Copyright (c) 28 Dowling Associates, Inc. Licensed to Hexagon Trans., San Jose
74 COMPARE Thu Jul 31 11:8:3 214 Page 3-3 Intersection #3568: HAMILTON/MERIDIAN Primrose Daycare Center Peak Hour Conditions Hexagon Transportation Associates, Inc. Level Of Service Computation Report 2 HCM Operations (Future Volume Alternative) Existing + Project (PM) Signal=Protect/s=Include Final Vol: *** 242 Lanes: Signal=Protect Signal=Protect Final Vol: Lanes: s=include Vol Cnt Date: 5/21/214 s=include Lanes: Final Vol: 31 1 Cycle Time (sec): Loss Time (sec): Critical V/C: Avg Crit Del (sec/veh): *** 1 Avg Delay (sec/veh): *** LOS: E+ Lanes: Final Vol: 22*** Signal=Protect/s=Include Approach: North Bound South Bound East Bound West Bound Movement: L - T - R L - T - R L - T - R L - T - R Min. Green: Y+R: Volume Module: >> Count Date: 21 May 214 << 5:-6:PM Base Vol: Growth Adj: Initial Bse: Added Vol: ATI: Initial Fut: User Adj: PHF Adj: PHF Volume: Reduct Vol: Reduced Vol: PCE Adj: MLF Adj: FinalVolume: Saturation Flow Module: Sat/Lane: Adjustment: Lanes: Final Sat.: Capacity Analysis Module: Vol/Sat: Crit Moves: **** **** **** **** Green Time: Volume/Cap: Delay/Veh: User DelAdj: AdjDel/Veh: LOS by Move: F D- D- E D- D E D E+ F E E HCM2kAvgQ: Note: Queue reported is the number of cars per lane. Traffix Copyright (c) 28 Dowling Associates, Inc. Licensed to Hexagon Trans., San Jose
75 Appendix C Signal Warrant Worksheets
76 Existing Existing Background Existing + Proj Background + Proj Background Existing + Proj Background + Proj 8/5/214 Hamilton/Cherrydale TRAFFIC SIGNAL WARRANTS WORKSHEET Analyst: RP date: 7/15/14 Major Street: Hamilton Critical Approach Speed* (mph) 35 Minor Street: Cherrydale/ Driveway Critical Approach Speed* (mph) 25 *Posted Speed. Critical speed of major street traffic > 5 mph (64 km/h) In built up area of isolated community of < 1, population Warrant 3 - Peak Hour PART A (All parts 1, 2, and 3 below must be satisfied) AM PEAK PERIOD or Rural (R) Urban (U) AM PEAK PERIOD Minor Street Approach Direction w/ Highest Delay SB SB NB NB Highest Minor Street Average Delay (sec/veh) Corresponding Minor Street Approach Volume (veh/hr) Minor Street Total Delay (veh-hrs) The total delay experienced for traffic on one minor street approach controlled by a STOP sign equals or exceeds 4 vehicle-hours for a 1- lane approach and 5 vehicle-hours for a 2-lane approach; AND No No No No The volume on the same minor street approach equals or exceeds 1 vph for 1 moving lane of traffic or 15 vph for 2 moving lanes; AND The total entering volume serviced during the hour equals or exceeds 8 vph for intersections with 4 or more approaches or 65 vph for intersections with 3 approaches. No No No No No No No No Signal Warranted based on Part A? No No No No PART B AM PEAK PERIOD Approach Lanes 2 or One More Major Street - Both Approaches Hamilton X Minor Street - Highest Approach Cherrydale/ Driveway X Signal Warranted based on Part B? No No No No The Warrant is satisfied if the plotted point for vehicles per hour on the major street (both approaches) and the corresponding per hour higher vehicle volume minor street approach (one direction only) for one hour (any four consecutive 15-minute periods) fall above the applicable curves in California MUTCD Figure 4C-3 or 4C-4. Source: California Manual on Uniform Traffic Control Devices for Streets and Highways (FHWA's MUTCD 21 Edition, as amended for use in California). Notes: File: Signal Warrants.xls Tab: Signal Warrants 3 (AM)
77 Existing Background Existing + Proj Background + Proj Minor Street - Highest Approach (vph) Background Existing Existing Background + Proj + Proj 8/5/214 Hamilton/Cherrydale Hamilton Avenue & Cherrydale Drive AM PEAK PERIOD Warrant 3, Part B - Peak-Hour Vehicular Volume or more lanes & 2 or more lanes 2 or more lanes & 1 lane 1 lane & 1 lane 3 2 *15 1 * Major Street - Total of Both Approaches (vph) Source: Figure 4C-3 California Manual on Uniform Traffic Control Devices for Streets and Highways (FHWA's MUTCD 21 Edition, as amended for use in California). * Note: 15 vph applies as the lower threshold volume for a minor-street approach with two or more lanes and 1 vph applies as the lower threshold volume for a minor-street approach with one lane. Warrant 3, Part B - Peak-Hour Vehicular Volume Approach Lanes 2 or One More AM PEAK PERIOD Major Street - Both Approaches Hamilton X Minor Street - Highest Approach Cherrydale/ Driveway X Signal Warranted Based on Part B - Peak-Hour Volumes? No No No No *Warrant is satisfied if plotted points fall above the appropriate curve in graph above. File: Signal Warrants.xls Tab: Warrant 3, Part B-Graph (AM)
78 Existing Background Existing + Proj Background + Proj Existing Background Existing + Proj Background + Proj 8/5/214 Hamilton/Cherrydale TRAFFIC SIGNAL WARRANTS WORKSHEET Analyst: RP date: 7/15/14 Major Street: Hamilton Critical Approach Speed* (mph) 35 Minor Street: Cherrydale/ Driveway Critical Approach Speed* (mph) 25 *Posted Speed. Critical speed of major street traffic > 5 mph (64 km/h) In built up area of isolated community of < 1, population Warrant 3 - Peak Hour PART A (All parts 1, 2, and 3 below must be satisfied) PM PEAK HOUR or Rural (R) Urban (U) PM PEAK HOUR PART B Minor Street Approach Direction w/ Highest Delay SB SB NB NB Highest Minor Street Average Delay (sec/veh) Corresponding Minor Street Approach Volume (veh/hr) Minor Street Total Delay (veh-hrs) The total delay experienced for traffic on one minor street approach controlled by a STOP sign equals or exceeds 4 vehicle-hours for a 1- lane approach and 5 vehicle-hours for a 2-lane approach; AND The volume on the same minor street approach equals or exceeds 1 vph for 1 moving lane of traffic or 15 vph for 2 moving lanes; AND The total entering volume serviced during the hour equals or exceeds 8 vph for intersections with 4 or more approaches or 65 vph for intersections with 3 approaches. No No No No No No No No No No No No Signal Warranted based on Part A? No No No No PM PEAK HOUR Approach Lanes 2 or One More Major Street - Both Approaches Hamilton X Minor Street - Highest Approach Cherrydale/ Driveway X Signal Warranted based on Part B? No No No No The Warrant is satisfied if the plotted point for vehicles per hour on the major street (both approaches) and the corresponding per hour higher vehicle volume minor street approach (one direction only) for one hour (any four consecutive 15-minute periods) fall above the applicable curves in California MUTCD Figure 4C-3 or 4C-4. Source: California Manual on Uniform Traffic Control Devices for Streets and Highways (FHWA's MUTCD 21 Edition, as amended for use in California). Notes: File: Signal Warrants.xls Tab: Signal Warrants 3 (PM)
79 Existing Background Existing + Proj Background + Proj Minor Street - Highest Approach (vph) Background Existing Existing Background + Proj + Proj 8/5/214 Hamilton/Cherrydale Hamilton Avenue & Cherrydale Drive PM PEAK HOUR Warrant 3, Part B - Peak-Hour Vehicular Volume or more lanes & 2 or more lanes or more lanes & 1 lane 1 lane & 1 lane 2 1 *15 * Major Street - Total of Both Approaches (vph) Source: Figure 4C-3 California Manual on Uniform Traffic Control Devices for Streets and Highways (FHWA's MUTCD 21 Edition, as amended for use in California). * Note: 15 vph applies as the lower threshold volume for a minor-street approach with two or more lanes and 1 vph applies as the lower threshold volume for a minor-street approach with one lane. Warrant 3, Part B - Peak-Hour Vehicular Volume Approach Lanes One 2 or More PM PEAK HOUR Major Street - Both Approaches Hamilton X Minor Street - Highest Approach Cherrydale/ Driveway X Signal Warranted Based on Part B - Peak-Hour Volumes? No No No No *Warrant is satisfied if plotted points fall above the appropriate curve in graph above. File: Signal Warrants.xls Tab: Warrant 3, Part B-Graph (PM)
9988 REDWOOD AVENUE PROJECT TRAFFIC IMPACT ANALYSIS. April 24, 2015
 9988 REDWOOD AVENUE PROJECT TRAFFIC IMPACT ANALYSIS April 24, 2015 Kunzman Associates, Inc. 9988 REDWOOD AVENUE PROJECT TRAFFIC IMPACT ANALYSIS April 24, 2015 Prepared by: Bryan Crawford Carl Ballard,
TRAFFIC IMPACT ANALYSIS HANDBOOK VOLUME I METHODOLOGIES & REQUIREMENTS
 TRAFFIC IMPACT ANALYSIS HANDBOOK VOLUME I METHODOLOGIES & REQUIREMENTS Downtown panoramic photo provided by 1stACT Silicon Valley (blank below this line) Volume I Methodologies and Requirements TABLE OF
Goals & Objectives. Chapter 9. Transportation
 Goals & Objectives Chapter 9 Transportation Transportation MISSION STATEMENT: TO PROVIDE A TRANSPORTATION NETWORK CAPABLE OF MOVING PEOPLE AND GOODS EFFICIENTLY AND SAFELY. T he transportation system
Traffic Impact Study for the 3817-45 North Broadway Mixed-Use Development Chicago, Illinois. Prepared by
 Traffic Impact Study for the Chicago, Illinois repared by March 30, 2015 1. Introduction This report summarizes the methodologies, results and findings of a traffic impact study conducted by Kenig, Lindgren,
CAPACITY AND LEVEL-OF-SERVICE CONCEPTS
 CHAPTER 2 CAPACITY AND LEVEL-OF-SERVICE CONCEPTS CONTENTS I. INTRODUCTION...2-1 II. CAPACITY...2-2 III. DEMAND...2-2 IV. QUALITY AND LEVELS OF SERVICE...2-2 Service Flow Rates...2-3 Performance Measures...2-3
Accident Analysis of Sheridan Road between Isabella Street and South Boulevard
 Accident Analysis of Sheridan Road between Isabella Street and South Boulevard Prepared for TranSystems Corporation for the City of Evanston Submitted by Regina Webster & Associates, Inc. Date: 08/15/2008
Downtown Tampa Transportation Vision
 Downtown Tampa Transportation Vision Executive Summary August 1, 2006 Hillsborough County Metropolitan Planning Organization County Center, 18 th Floor Tampa, Florida 33602 813-272-5940 www.hillsboroughmpo.org
MEMORANDUM. Robert Nichols, Acting Corridor Design Manager Northgate Link Extension
 MEMORANDUM DATE: September 23, 2014 TO: Robert Nichols, Acting Corridor Design Manager Northgate Link Extension FROM: SUBJECT: COPIES: Katherine Casseday, PE, PTOE, Casseday Consulting Tony Lo, PE, Parsons
Near Westside Neighborhood and University Avenue Corridor Transportation Study. Public Workshop #2. September 12 and 23, 2013
 Near Westside Neighborhood and University Avenue Corridor Transportation Study Public Workshop #2 September 12 and 23, 2013 Presentation Outline: Brief Review of Study Scope, Background, and Current Conditions
 Walkable Communities Florida Department of Transportation State Safety Office Pedestrian and Bicycle Program April 1995 www.dot.state.fl.us/safety Twelve Steps for an Effective Program Page 1 Twelve Steps
APPENDIX J TRAFFIC STUDY
 APPENDIX J TRAFFIC STUDY May 7, 2014 Ms. Leianne Humble Denise Duffy and Associates, Inc. 947 Cass Street, Suite 5 Monterey, CA 93940 Re: Traffic Study for the Heritage Oaks Memorial Park in San Jose,
Guidelines for the Preparation of Transportation Impact Studies 8 th Revision
 Guidelines for the Preparation of Transportation Impact Studies 8 th Revision Halifax Regional Municipality Traffic and Right of Way Transportation and Public Works P.O. Box 1749 Halifax, Nova Scotia B3J
Appendix E Traffic Impact Analysis
 Appendix E Traffic Impact Analysis 2010 Facility Master Plan Factoria Recycling and Transfer Station November 2010 2010 Facility Master Plan Factoria Recycling and Transfer Station November 2010 Department
The partnership has selected three intersections where enforcement, education, and engineering initiatives are being implemented to improve safety:
 Hamilton-Finn Suite 310 Tel. (403) 207-6000 Road Safety 3016 5th Avenue N.E. Fax. (403) 273-3440 Consultants Ltd. Calgary, Alberta dawatt.dawatt.com www.hamiltonfinn.ca January 19, 2005 Mr. Don Szarko,
Executive Summary. Transportation Needs CHAPTER. Existing Conditions
 CHAPTER 1 Executive Summary The City of Forest Grove Transportation System Plan (TSP) was updated to keep it consistent with recent growth trends in the city and other transportation planning efforts in
BEFORE-AND-AFTER STUDY OF THE EFFECTIVENESS OF RECTANGULAR RAPID-FLASHING BEACONS USED WITH SCHOOL SIGN IN GARLAND, TEXAS
 BEFORE-AND-AFTER STUDY OF THE EFFECTIVENESS OF RECTANGULAR RAPID-FLASHING BEACONS USED WITH SCHOOL SIGN IN GARLAND, TEXAS Marcus A. Brewer (corresponding author) Associate Research Engineer Texas Transportation
TRANSPORTATION IMPACT ANALYSIS (TIA) Guidelines
 Guidelines") TRANSPORTATION IMPACT ANALYSIS (TIA) Guidelines Methodology For Development Applications Requiring a TIA in Volusia County, Florida TIA Guidelines As adopted on November 24, 2009 (The Volusia Transportation
TRANSPORTATION IMPACT ANALYSIS (TIA) Guidelines Methodology For Development Applications Requiring a TIA in Volusia County, Florida TIA Guidelines As adopted on November 24, 2009 (The Volusia Transportation
Disputed Red Light Accidents: A Primer on Signal Control. Jon B. Landerville, MSME, PE Edward C. Fatzinger, MSME, PE Philip S.
 Disputed Red Light Accidents: A Primer on Signal Control Jon B. Landerville, MSME, PE Edward C. Fatzinger, MSME, PE Philip S. Wang, MSME Intersection Accident Statistics Intersection accidents occur on
TABLE OF CONTENTS TABLES FIGURES
 TABLE OF CONTENTS Introduction...1 1. On-Site Stacking...2 2. Number of School Driveways...2 3. School Driveway Standards...3 3A. Driveway Spacing...3 3B. Driveway Location...4 3C. Driveway Lane Widths
Mobility Management Plan Study of the Busch Boulevard Corridor
 Mobility Management Plan Study of the Busch Boulevard Corridor March 2000 Hillsborough County Metropolitan Planning Organization 601 E. Kennedy, 18th Floor Tampa, Florida 33602-5117 813/272-5940 FAX NO:
Stone Way N Rechannelization: Before and After Study. N 34th Street to N 50th Street
 City of Seattle Department of Transportation Stone Way N Rechannelization: Before and After Study N 34th Street to N 50th Street May, 2010 INTRODUCTION Population density in Seattle is increasing within
TRAFFIC IMPACT ANALYSIS (TIA)
") GUIDELINES FOR TRAFFIC IMPACT ANALYSIS (TIA) FOR REZONING APPLICATIONS AND OTHER DEVELOPMENT APPROVALS REQUIRING TRANSPORTATION IMPACT ANALYSIS IN SUMTER COUNTY, FLORIDA July 17, 2007 PURPOSE AND APPLICABILITY
GUIDELINES FOR TRAFFIC IMPACT ANALYSIS (TIA) FOR REZONING APPLICATIONS AND OTHER DEVELOPMENT APPROVALS REQUIRING TRANSPORTATION IMPACT ANALYSIS IN SUMTER COUNTY, FLORIDA July 17, 2007 PURPOSE AND APPLICABILITY
1. REPORT CONTEXT Description of the development (include all of the following that are known at the time of the application):
:") Transportation Assessment and Management Study Guidelines for Consultants INTRODUCTION This document is intended to provide guidelines for transportation consultants who produce Transportation reports
Transportation Assessment and Management Study Guidelines for Consultants INTRODUCTION This document is intended to provide guidelines for transportation consultants who produce Transportation reports
ENGINEERING SOLUTIONS FOR DESIGNING YOUR SAFE ROUTES
 How to Get Started ENGINEERING SOLUTIONS FOR DESIGNING YOUR SAFE ROUTES Design Elements Selecting appropriate design treatments for school neighborhoods creates environments that address the needs of all
U.S. Department of Homeland Security Nebraska Avenue Complex Master Plan DRAFT ENVIRONMENTAL IMPACT STATEMENT APPENDIX C
 U.S. Department of Homeland Security Nebraska Avenue Complex Master Plan DRAFT ENVIRONMENTAL IMPACT STATEMENT APPENDIX C January 14, 2011 This page intentionally left blank Transportation Management Plan
Appendix J Santa Monica Travel Demand Forecasting Model Trip Generation Rates
 Appendix J Santa Monica Travel Demand Forecasting Model Trip Generation Rates SANTA MONICA TRAVEL DEMAND FORECASTING MODEL TRIP GENERATION RATES SUBMITTED BY: 201 Santa Monica Blvd., Suite 500 Santa Monica,
Transportation Impact Assessment Guidelines
 Transportation Impact Assessment Guidelines Preface The following TIA Guidelines have been developed jointly by the City s Planning and Growth Management and Public Works and Services departments in an
Overview... Bus Options... Carpooling, Biking or Walking to School... Driving to Campus: The Loop... The Queue: Managing Lincoln Ave Traffic...
 Overview... Bus Options... Carpooling, Biking or Walking to School... Driving to Campus: The Loop... The Queue: Managing Lincoln Ave Traffic... 2 3 4 5 6 What is the Queue?... 7 How the Queue and Loop
Lincoln Downtown Master Plan Update
 Lincoln Downtown Master Plan Update Table of Contents Executive Summary........................................... 1 Complete Streets Framework.................................... 3 Promenade Creating
Comment #1: Provide an interchange at Route 7 and Farm Market Road/White Gate Road. This was studied in the late 1990 s.
 Proposed Truck Climbing Lane Route 7 Westbound Between West Market Street and Route 9 UPC# 58599, Project # 6007-053-133, P101 Date of Meeting: August 24, 2010 Time: 6:00PM to 8:00PM Location: Rust Library
Elwood and Joliet, Illinois. June 2015. Village of Elwood. Prepared for:
 Truck Routing Study Elwood and Joliet, Illinois June 2015 Prepared for: Village of Elwood INTRODUCTION Kimley-Horn and Associates, Inc. (Kimley-Horn) was retained by the Village of Elwood to evaluate the
TRANSPORTATION IMPACT ANALYSIS PROCEDURES MANUAL
 TRANSPORTATION IMPACT ANALYSIS PROCEDURES MANUAL INTRODUCTION The Town of Harrisburg is committed to establishing an interconnected, multimodal transportation system that increases mobility, safety, connectivity,
TRANSPORTATION IMPACT ASSESSMENT (TIA) GUIDELINES. Section 1 Introduction
 GUIDELINES. Section 1 Introduction") TRANSPORTATION IMPACT ASSESSMENT (TIA) GUIDELINES Section 1 Introduction MassDOT s mission is to deliver excellent customer service to people who travel in the Commonwealth, and to provide our nation's
TRANSPORTATION IMPACT ASSESSMENT (TIA) GUIDELINES Section 1 Introduction MassDOT s mission is to deliver excellent customer service to people who travel in the Commonwealth, and to provide our nation's
City of Kamloops Notre Dame Corridor Access Plan
 FINAL REPORT This report is prepared for the sole use of ICBC. No representations of any kind are made by Urban Systems Ltd. or its employees to any party with whom Urban Systems Ltd. does not have a contract.
Advantages and Disadvantages of One Way Streets October 30, 2007
 Advantages and Disadvantages of One Way Streets October 30, 2007 0 P age Background As the revitalization of the Central Waterfront area moves forward, one issue that might need closer analysis is the
Route Development Plan
 WSDOT Northwest Washington Division, Planning and Policy Office Route Development Plan State Route 99 North/Aurora Avenue North From the North end of the Battery Street Tunnel (Mile Post 32.44) to N. 145th
TRAFFIC IMPACT ANALYSIS
 TRAFFIC IMPACT ANALYSIS Presenter Gerry Harter, PE, Area Traffic Engineer Acting Transportation and Land Use Director Why a TIA? Roads are a critical public resource and a major investment of public funds
2013 QUALITY/ LEVEL OF SERVICE HANDBOOK
 2013 QUALITY/ LEVEL OF SERVICE HANDBOOK STATE OF FLORIDA DEPARTMENT OF TRANSPORTATION 2013 TABLE OF CONTENTS 1 Executive Summary... 1 2 Q/LOS Handbook Purpose and Scope... 3 2.1. Levels of Analysis...4
This section summarizes the relevant transportation policies, laws, and regulations that apply to the proposed project.
 6. Transportation 6.1 OVERVIEW This chapter describes the existing transportation conditions in the Southwest Fresno Specific Plan Area. This includes the existing roadway, transit, bicycle, and pedestrian
Chapter Forty-seven. RURAL TWO-LANE/MULTILANE STATE HIGHWAYS (New Construction/Reconstruction) BUREAU OF DESIGN AND ENVIRONMENT MANUAL
 BUREAU OF DESIGN AND ENVIRONMENT MANUAL") Chapter Forty-seven RURAL TWO-LANE/MULTILANE STATE HIGHWAYS (New Construction/Reconstruction) BUREAU OF DESIGN AND ENVIRONMENT MANUAL Illinois RURAL TWO-LANE/MULTILANE STATE HIGHWAYS December 2009 2 Illinois
Chapter Forty-seven RURAL TWO-LANE/MULTILANE STATE HIGHWAYS (New Construction/Reconstruction) BUREAU OF DESIGN AND ENVIRONMENT MANUAL Illinois RURAL TWO-LANE/MULTILANE STATE HIGHWAYS December 2009 2 Illinois
Temporary Traffic Control for Building and Maintaining Single and Multi-Lane Roundabouts
 Purpose and Background Temporary Traffic Control for Building and Maintaining Single and Multi-Lane Roundabouts Although roundabouts have recently gained popularity and use in the United States, minimal
SECTION 6: TRANSPORTATION
 6.0 INTRODUCTION SECTION 6: TRANSPORTATION This section covers the design of the transportation system including but not limited to roadways, lanes, sidewalks and pathways located within road right of
Light Rail Transit in Phoenix
 4. Presentation and Discussion: Phoenix Light Rail Implementation Wulf Grote Planning and Development Director, Phoenix Valley Metro Light Rail Transit in Phoenix Broadway Citizen s Task Force February
Traffic Volume Counts
 Traffic Volume Counts Prepare 1. Communicate with other staff/departments 2. Review historical data trends 3. Review citizen input 4. Request traffic control Select Location 1. Select the proper location
ENGINEERING REPORT. College Street: Interstate 85 to Donahue Drive Traffic Signal System Feasibility Study Auburn, Alabama
 ENGINEERING REPORT College Street: Interstate 85 to Donahue Drive Traffic Signal System Feasibility Study Auburn, Alabama Prepared for: The City of Auburn Prepared by: 3644 Vann Road Suite 100 Birmingham,
SEMINOLE PRATT WHITNEY ROAD & NORTHLAKE BLVD. FREQUENTLY ASKED QUESTIONS
 UPDATED: 01/31/14 SEMINOLE PRATT WHITNEY ROAD & NORTHLAKE BLVD. FREQUENTLY ASKED QUESTIONS Q. 1. What are the County s plans for Seminole Pratt Whitney Road between SR 80 (Southern Blvd) and the Bee Line
ORANGE COUNTY TRANSPORTATION AUTHORITY. Final Long-Range Transportation Plan - Destination 2035. Attachment A
 ORANGE COUNTY TRANSPORTATION AUTHORITY Final Long-Range Transportation Plan - Destination 2035 Attachment A DESTINATION 2035 DESTINATION 2035 EXECUTIVE SUMMARY ATTACHMENT A Moving Toward a Greener Tomorrow
8+ %!0"% 8+1!%"'$%,$"$
 8+ 8+ %!0"% The next step in developing recommendations for improvements to Grand Avenue was to identify, develop and evaluate alternatives to address the issues and needs identified in the previous chapter.
CHAPTER 2B. REGULATORY SIGNS
 December 2000 Page 2B-1 CHAPTER 2B. REGULATORY SIGNS Section 2B.01 Application of Regulatory Signs Regulatory signs shall be used to inform road users of selected traffic laws or regulations and indicate
In 2005, the City of Pasadena, CA, USA, with the support of consultants,
 Creating a Citywide Safe Routes to School Program: Pasadena, CA, USA s Step-by-Step Approach In 2005, the City of Pasadena, CA, USA, initiated development of a comprehensive Safe Routes to School Program.
Neighborhood Traffic Management Program Community Handbook
 Neighborhood Traffic Management Program Community Handbook Education Engineering Enforcement PUBLIC WORKS - TRAFFIC ENGINEERING 1 March 2012 Table of Contents I. Introduction & Message to the Public......2
KENTUCKY TRANSPORTATION CABINET. Department of Rural and Municipal Aid. Office of Local Programs
 KENTUCKY TRANSPORTATION CABINET Department of Rural and Municipal Aid Office of Local Programs Office of Local Programs Transportation Enhancements Safe Routes to School Congestion Mitigation and Air Quality
EPA Technical Assistance for Sustainable Communities Building Blocks
 EPA Technical Assistance for Sustainable Communities Technical Assistance Tool: Complete Streets Deerfield Beach, Florida February 16, 2012 To: CC: Amanda Martinez, City of Deerfield Beach Roger Millar,
Safe Routes to School Guide
 Safe Routes to School Guide Student Drop-off and Pick-up Created February 2007 SafeRoutes National Center for Safe Routes to School This guide was developed by the Pedestrian and Bicycle Information Center
Section 6 Traffic Analysis
 Section 6 Traffic Analysis Traffic Operations of the Preferred Network Alternative After the Preferred Network was identified and confirmed by local policy makers and area residents, detailed traffic analysis
Needs Analysis. Long Beach Bicycle Master Plan. Bicycle Commuter Needs. LONG BEACH BICYCLE MASTER PLAN Needs Analysis
 Long Beach Bicycle Master Plan Needs Analysis The purpose of reviewing the needs of commuter and recreational bicyclists is twofold: (1) it is instrumental when planning a system which must serve both
Protected Bicycle Lanes in NYC
 Protected Bicycle Lanes in NYC New York City Department of Transportation Polly Trottenberg, Commissioner September 2014 NEW YORK CITY DEPARTMENT OF TRANSPORTATION 1 Overview Since 2007, the New York City
Retooling School Drop-off/Pick-up Zones to Meet Demand Keith B. Higgins, PE, TE
 Abstract Retooling School Drop-off/Pick-up Zones to Meet Demand Keith B. Higgins, PE, TE Student drop-off and pick-up activity at school sites throughout the country have increased in recent years as a
APPENDIX E TASK 5 TECHNICAL MEMORANDUM: TRAVEL DEMAND FORECASTING PROCESS
 APPENDIX E TASK 5 TECHNICAL MEMORANDUM: TRAVEL DEMAND FORECASTING PROCESS INTRODUCTION The purpose of this Technical Memorandum is to describe the methodologies and assumptions used in estimating travel
TRAFFIC MANAGEMENT PLAN (TMP) FRENCH-AMERICAN SCHOOL OF NEW YORK
 FRENCH-AMERICAN SCHOOL OF NEW YORK") Environmental and Planning Consultants 34 South Broadway Suite 401 White Plains, NY 10601 tel: 914 949-7336 fax: 914 949-7559 www.akrf.com TRAFFIC MANAGEMENT PLAN (TMP) *************************************************************
Environmental and Planning Consultants 34 South Broadway Suite 401 White Plains, NY 10601 tel: 914 949-7336 fax: 914 949-7559 www.akrf.com TRAFFIC MANAGEMENT PLAN (TMP) *************************************************************
PREFERRED ALTERNATIVE RECOMMENDATION FOR THE COLLEGE AVENUE SAFETY ENHANCEMENT (CASE) PROJECT COLUMBIA, MISSOURI
 PROJECT COLUMBIA, MISSOURI") PREFERRED ALTERNATIVE RECOMMENDATION FOR THE COLLEGE AVENUE SAFETY ENHANCEMENT (CASE) PROJECT COLUMBIA, MISSOURI Prepared For: Columbia Public Works 701 East Broadway Columbia, Missouri Prepared By: Engineering
PREFERRED ALTERNATIVE RECOMMENDATION FOR THE COLLEGE AVENUE SAFETY ENHANCEMENT (CASE) PROJECT COLUMBIA, MISSOURI Prepared For: Columbia Public Works 701 East Broadway Columbia, Missouri Prepared By: Engineering
Document Name: Driving Skills. Purpose: To outline necessary driving skills required to maximize driving safety.
 Document Name: Driving Skills Date Created: 8 October 2013 Date Reviewed: 4 February 2014 Date Approved: 29 July 2015 Purpose: To outline necessary driving skills required to maximize driving safety. Overview:
North Avenue Corridor Study. Advisory Committee Meeting #5 June 11, 2014
 North Avenue Corridor Study Advisory Committee Meeting #5 June 11, 2014 Agenda Welcome and introductions Concept refinement and evaluation: Public meeting and web survey General cross-section concepts
TEST ON Driving Safely Among Bicyclists and Pedestrians
 TEST ON Driving Safely Among Bicyclists and Pedestrians Next you will take a 16 question test about driving safely among bicyclists and pedestrians. Please take out a sheet of paper to mark down and score
TRAFFIC IMPACT ANALYSIS
 TRANSPORTATION Section 6-1 TRAFFIC IMPACT ANALYSIS The Town Of Buckeye Arizona Engineering Design Standards Section 6-1 Adopted December 2012 TABLE OF CONTENTS 6-1.000 GENERAL INFORMATION:...3 6-1.001
Topic 2 11/28/2012 Blocks & Street Network
 TOPIC 2 Blocks & Street Network Implementation Note: 1. Some recommendations are summarized in the tables herein. For complete recommendation language, please see the. 2. Recommendations referenced in
Measuring the Street:
 Measuring the Street: New Metrics for 21st Century Streets 1 Measuring the Street: New Metrics for 21st Century Streets New York City s streets are constantly called on to the meet new and varied needs
Lawson Outline Plan External Traffic Analysis Working Paper
 Total Lawson Development ACTPLA 16 January 2009 Document No.: Prepared for ACTPLA Prepared by Maunsell Australia Pty Ltd Level 2, 60 Marcus Clarke Street, Canberra ACT 2600, Australia T +61 2 6201 3000
Access Management Manual
 Access Management Manual July 2011 2011 by Texas Department of Transportation (512) 302-2453 all rights reserved Manual Notice 2011-1 From: Manual: Mark A Marek, P.E. Access Management Manual Effective
Comprehensive Plan Policies that support Infill and Mixed Use
 Comprehensive Plan Policies that support Infill and Mixed Use Introduction A comprehensive plan provides a broad vision for the future growth of a community. It is often formulated using community visioning
Nearly 38,000 vehicles cross the Shinnecock Canal on Sunrise Highway (NYS Route 27) daily, during peak summer months.
 daily, during peak summer months.") 2. Traffic Characteristics Traffic volumes have increased in concert with population growth in the Towns of Southampton and East Hampton. The New York State Department of Transportation (NYSDOT) maintains
2. Traffic Characteristics Traffic volumes have increased in concert with population growth in the Towns of Southampton and East Hampton. The New York State Department of Transportation (NYSDOT) maintains
City of Rockville Regional Development Impacts: Transportation Capacity Analysis. June, 2013
 City of Rockville Regional Development Impacts: Transportation Capacity Analysis June, 2013 Purpose and Need Response to Council and Public Evaluate use of more advanced traffic analysis methodology and
0.0 Curb Radii Guidelines Version 1.0.2
 Background In early 2014, Transportation Services initiated a review of the Division's design guidelines and standards to move our organization in a direction consistent with the transportation departments
REGIONAL NON-MOTORIZED TRANSPORTATION NETWORK
 Chapter 10 Bicycle and Pedestrian SAFETEA-LU legislation requires that non-motorized users be considered in the LRTP. The legislation allows for bicycle and pedestrian safety to be incorporated into the
Executive Director s Recommendation Commission Meeting: July 11, 2013
 Executive Director s Recommendation Commission Meeting: July 11, 2013 PROJECT Russell Road Widening Phase 2 United States Marine Corps Base Quantico Prince William County, Virginia SUBMITTED BY United
3.1 Historical Considerations
 3. Recommended Scope of Bridge improvements 3.1 Historical Considerations In the fall of 2000, an outside consultant, Fraser Design, suggested that the existing 4 th St. Bridge is potentially eligible
3 Tappan Zee Bridge Rehabilitation Options
 3 Tappan Zee Bridge Rehabilitation Options 3.1 Introduction This chapter describes possible options that rehabilitate and enhance the existing Tappan Zee Bridge. Four Rehabilitation Options have been developed:
ELMHURST SPEEDWAY A STUDY OF LAWBREAKING IN ELMHURST
 ELMHURST SPEEDWAY A STUDY OF LAWBREAKING IN ELMHURST INTRODUCTION TWENTY-THIRD AVENUE IS AN EAST-WEST FOUR-LANE ARTERIAL ROAD running through East Elmhurst, Queens. With two lanes of traffic in either
RESOLUTION NO. 74443
 RD:AGN:ERD RES. NO. 74443 5/27/08 RESOLUTION NO. 74443 A RESOLUTION OF THE COUNCIL OF THE CITY OF SAN JOSE APPROVING A REVISED COUNCIL POLICY 5-6 ENTITLED TRAFFIC CALMING POLICY FOR RESIDENTIAL NEIGHBORHOODS
Multi-Modal Corridor Degree of Complexity: High Cost/Benefit: High
 Multi-Modal Corridor Degree of Complexity: Cost/Benefit: Maintain the same level of service for Ensures continuous flow through the Might impact other transportation Consider road diet and/or different
Evaluation of the Shared-Use Arrow
 Evaluation of the Shared-Use Arrow Table of Contents Page Evaluation of the Shared-Use ARROW Background... 1 ARROW Design... 1 ARROW Placement... 2 Wayne E. Pein William W. Hunter J. Richard Stewart Report
SAN DIEGO - A BICYCLE FRIENDLY CITY
 SAN DIEGO - A BICYCLE FRIENDLY CITY MANY OPPORTUNITIES FOR IMPROVEMENT SUMMARY The designated bicycle paths and lanes in the City of San Diego (City) are often substandard because of their location and
Mercer County Multi-Modal Transportation Plan Year 2025 Travel Demand Model
 Mercer County Multi-Modal Transportation Plan Year 2025 Travel Demand Model Prepared For West Virginia Department of Transportation Transportation Planning Division Building 5, Room 824 1900 Kanawha Blvd.
Aerial View E Looking West
 Figure 3-9 Aerial View E Looking West 3-19 Urban Design Figure 3-10 Aerial View F Looking North West 3-20 Urban Design Figure 3-11 Skyline and Massachusetts Avenue Gateway 3-21 Urban Design 4.0 TRANSPORTATION
How To Improve Safety
 Collision Diagrams Collision diagrams are used to display and identify similar accident patterns. They provide information on the type and number of accidents; including conditions such as time of day,
FHWA Colorado Division Control of Access to the Interstate and its Right-of-Way February 2005
 FHWA Colorado Division Control of Access to the Interstate and its Right-of-Way February 2005 Background: It is in the national interest to maintain the Interstate System to provide the highest level of
Examples of Transportation Plan Goals, Objectives and Performance Measures
 Examples of Transportation Plan Goals, Objectives and Performance Measures The next step in the Long Range Transportation Plan (LRTP) process is to develop goals, objectives, and performance measures.
California Crossing Guard Training: Online Course Part 2
 California Crossing Guard Training: Online Course Part 2 Prepared by the Safe Routes to School Technical Assistance Resource Center The Safe Routes to School Technical Assistance Resource Center is a program
Technical Memorandum PERFORMANCE MEASURES. Prepared by:
 Technical Memorandum PERFORMANCE MEASURES Prepared by: March 2014 TABLE OF CONTENTS Executive Summary... 1 1. Introduction... 2 1.1 Performance Measures and the Public Sector... 2 1.2 National Focus: MAP
Is Encouraging More Bike Ridership On El Camino Real A Good Idea?
 Is Encouraging More Bike Ridership On El Camino Real A Good Idea? In the above illustration there is a shared right turn lane on southbound El Camino Real at the intersection with Santa Cruz Avenue. Turning