9988 REDWOOD AVENUE PROJECT TRAFFIC IMPACT ANALYSIS. April 24, 2015
|
|
|
- Nigel Osborne
- 9 years ago
- Views:
Transcription
1 9988 REDWOOD AVENUE PROJECT TRAFFIC IMPACT ANALYSIS April 24, 2015

2 Kunzman Associates, Inc REDWOOD AVENUE PROJECT TRAFFIC IMPACT ANALYSIS April 24, 2015 Prepared by: Bryan Crawford Carl Ballard, LEED GA William Kunzman, P.E Town & Country Road, Suite 34 Orange, California (714)

3 Table of Contents I. Introduction... 1 A. Project Description... 1 B. Study Area... 1 C. Analysis Methodology... 2 D. Definition of Deficiency and Significant Impact Definition of Deficiency Definition of Significant Impact... 4 II. Existing Conditions... 8 A. Existing Roadway System... 8 B. Existing Volumes... 8 C. Existing Level of Service... 8 D. Planned Transportation Improvements and Relationship to General Plan... 8 III. Project Trips A. Project Description B. Trip Generation C. Trip Distribution D. Trip Assignment E. Trip Contribution Test IV. Future Conditions A. Future Volumes Existing Plus Project Opening Year (2017) With Ambient Opening Year (2017) With Ambient and Project Opening Year (2017) With Ambient and Cumulative and Project B. Future Level of Service Existing Plus Project Opening Year (2017) With Ambient Opening Year (2017) With Ambient and Project Opening Year (2017) With Ambient and Cumulative and Project V. Conclusions and Recommendations A. Summary B. Existing Conditions C. Project Trips D. Future Conditions Existing Plus Project Opening Year (2017) With Ambient Opening Year (2017) With Ambient and Project Opening Year (2017) With Ambient and Cumulative and Project E. Recommendations On-Site Improvements Off-Site Improvements... 56
 With Ambient... 29 3.")
4 APPENDICES Appendix A Glossary of Transportation Terms Appendix B Traffic Count Worksheets Appendix C Future Growth Increment Calculation Worksheets Appendix D Explanation and Calculation of Intersection Delay

5 List of Tables Table 1. Existing Intersection Delay and Level of Service Table 2. Project Trip Generation Table 3. Cumulative Development Trip Generation Table 4. Existing Plus Project Intersection Delay and Level of Service Table 5. Opening Year (2017) With Ambient Intersection Delay and Level of Service Table 6. Opening Year (2017) With Ambient and Project Intersection Delay and Level of Service Table 7. Opening Year (2017) With Ambient and Cumulative and Project Intersection Delay and Level of Service Table 8. Intersection Delay and Level of Service Summary... 57
 With Ambient and Project Intersection Delay and Level of Service... 35 Table 7.")
6 List of Figures Figure 1. Project Location Map... 6 Figure 2. Site Plan... 7 Figure 3. Existing Through Travel Lanes and Intersection Controls Figure 4. Existing Average Daily Traffic Volumes Figure 5. Existing Morning Peak Hour Intersection Turning Movement Volumes Figure 6. Existing Evening Peak Hour Intersection Turning Movement Volumes Figure 7. County of San Bernardino General Plan Circulation Element Figure 8. County of San Bernardino General Plan Roadway Cross-Sections Figure 9. City of Fontana General Plan Circulation Element Figure 10. City of Fontana General Plan Roadway Cross-Sections Figure 11. Project Trip Distribution - Cars Figure 12. Project Outbound Trip Distribution - Trucks Figure 13. Project Inbound Trip Distribution - Trucks Figure 14. Project Average Daily Traffic Volumes Figure 15. Project Morning Peak Hour Intersection Turning Movement Volumes Figure 16. Project Evening Peak Hour Intersection Turning Movement Volumes Figure 17. Project Trip Contribution Test Volumes Figure 18. Cumulative Development Traffic Analysis Zone Map Figure 19. Cumulative Development Average Daily Traffic Volumes Figure 20. Cumulative Development Morning Peak Hour Intersection Turning Movement Volumes Figure 21. Cumulative Development Evening Peak Hour Intersection Turning Movement Volumes Figure 22. Existing Plus Project Average Daily Traffic Volumes Figure 23. Opening Year (2017) With Ambient Average Daily Traffic Volumes Figure 24. Opening Year (2017) With Ambient and Project Average Daily Traffic Volumes Figure 25. Opening Year (2017) With Ambient and Cumulative and Project Average Daily Traffic Volumes Figure 26. Existing Plus Project Morning Peak Hour Intersection Turning Movement Volumes Figure 27. Existing Plus Project Evening Peak Hour Intersection Turning Movement Volumes... 46

7 Figure 28. Opening Year (2017) With Ambient Morning Peak Hour Intersection Turning Movement Volumes Figure 29. Opening Year (2017) With Ambient Evening Peak Hour Intersection Turning Movement Volumes Figure 30. Opening Year (2017) With Ambient and Project Morning Peak Hour Intersection Turning Movement Volumes Figure 31. Opening Year (2017) With Ambient and Project Evening Peak Hour Intersection Turning Movement Volumes Figure 32. Opening Year (2017) With Ambient and Cumulative and Project Morning Peak Hour Intersection Turning Movement Volumes Figure 33. Opening Year (2017) With Ambient and Cumulative and Project Evening Peak Hour Intersection Turning Movement Volumes Figure 34. Circulation Recommendations... 58
 With Ambient and Project Evening Peak Hour Intersection Turning Movement Volumes... 50 Figure 32.")
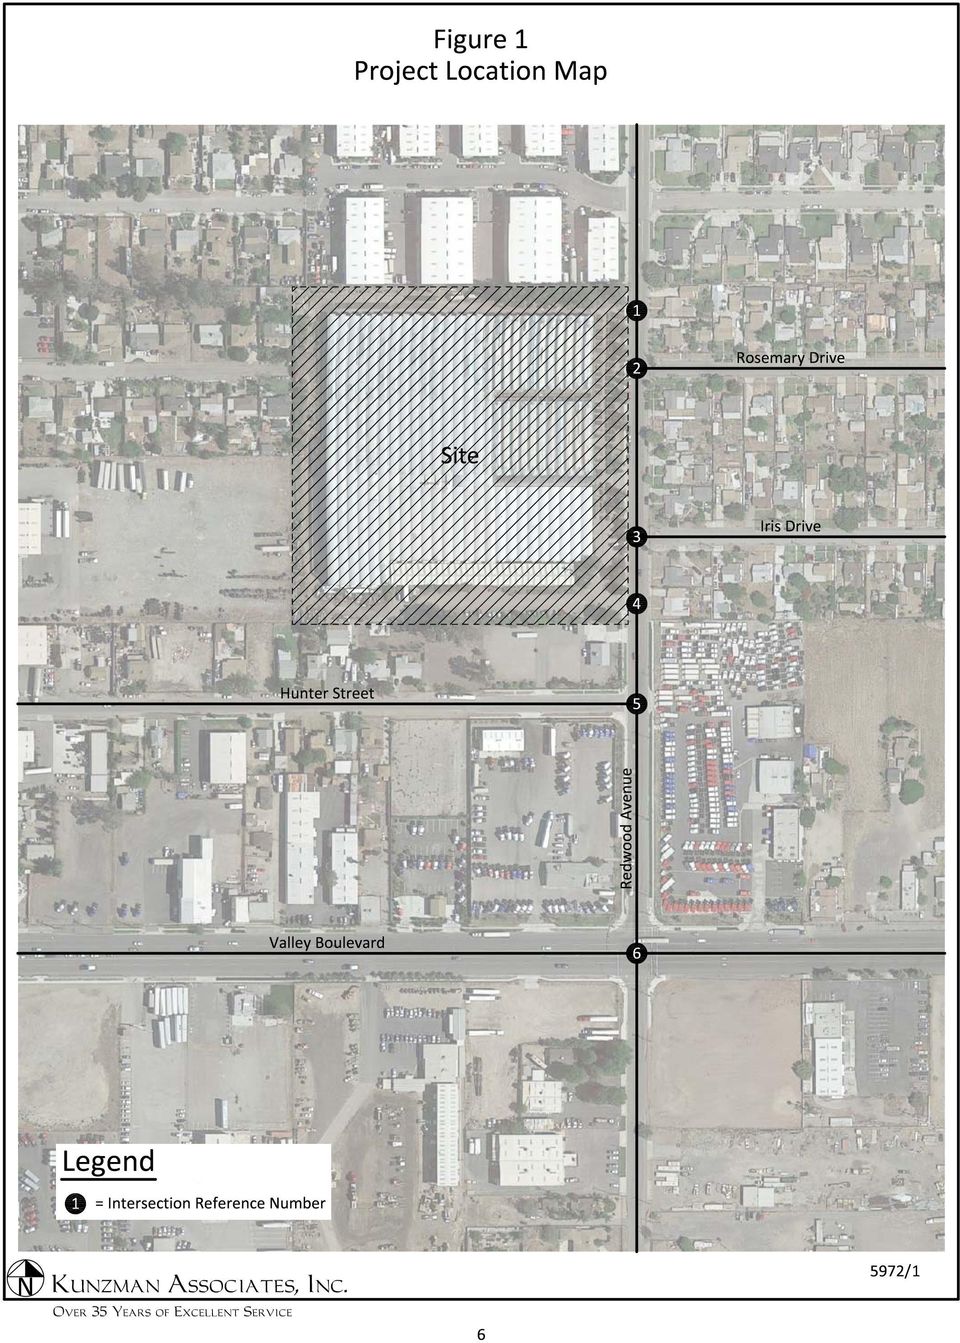
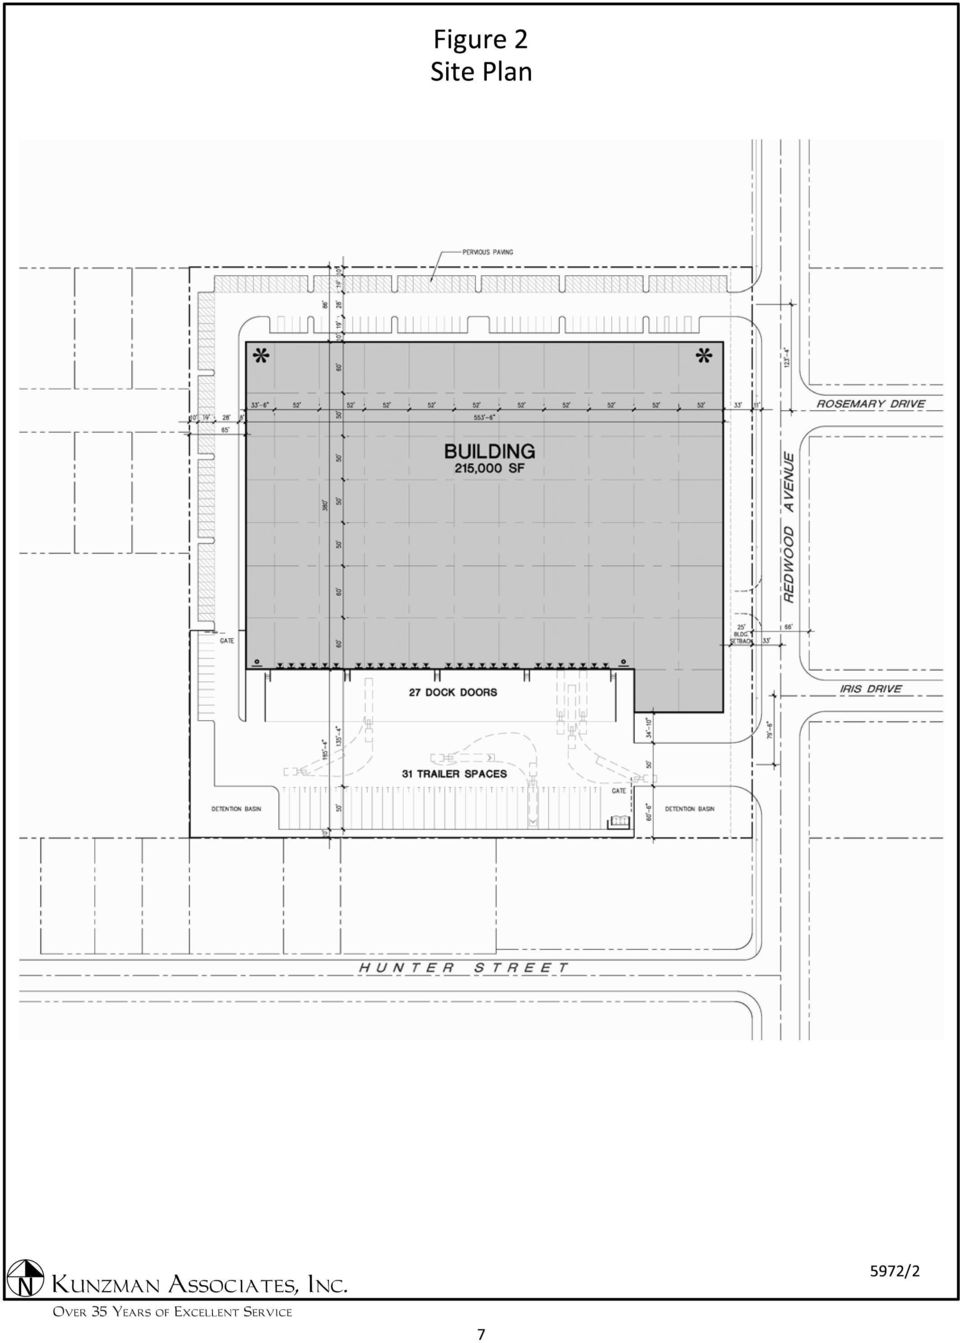
8 I. Introduction The purpose of this report is to provide an assessment of the traffic impacts resulting from the proposed development of the 9988 Redwood Avenue project, and to identify the traffic mitigation measures necessary to maintain the established Level of Service standard for the elements of the impacted roadway system. The traffic issues related to the proposed land uses and development have been evaluated in the context of the California Environmental Quality Act. The County of San Bernardino is the lead agency responsible for preparation of the traffic impact analysis, in accordance with the California Environmental Quality Act authorizing legislation. This report analyzes traffic impacts for the anticipated opening date with full occupancy of the development in Year 2017, at which time it will be generating trips at its full potential. Although this is a technical report, every effort has been made to write the report clearly and concisely. To assist the reader with those terms unique to transportation engineering, a glossary of terms is provided in Appendix A. A. Project Description The proposed development is located north of Hunter Street and west of Redwood Avenue in the County of San Bernardino. A vicinity map showing the project location is provided on Figure 1. The project site is proposed to be developed with 215,000 square feet of high-cube warehouse distribution center. Access will be provided to Redwood Avenue. Figure 2 illustrates the project site plan. B. Study Area Regional access to the project site is provided by the I-10 Freeway. Local access is provided by various roadways in the vicinity of the site. The east-west roadways expected to provide local access include Rosemary Drive, Iris Drive, Hunter Street, and Valley Boulevard. The north-south roadway expected to provide local access is Redwood Avenue. A series of scoping discussions were conducted with the County of San Bernardino to define the desired analysis locations for each future analysis year. In addition, staff from the County of San Bernardino has also been contacted to discuss the project and its associated travel patterns. No analysis is required further than 5 miles from the project site. The roadway elements that must be analyzed are dependent on both the analysis year [project Opening Year] and project generated traffic volumes. The identification of the study area, and the intersections and highway segments requiring analysis, was based on an estimate of the two-way traffic volumes on the roadway segments near the project site. All arterial segments have been included in the analysis when the anticipated project volume equals or

9 exceeds 50 two-way trips in the peak hours. The requirement is 100 two-way peak hour trips for freeways. The project does not contribute trips greater than the freeway threshold volume of 100 two-way peak hour trips. The project does not contribute trips greater than the arterial link threshold volume of 50 two-way trips in the morning and evening peak hours in the adjacent City of Fontana. C. Analysis Methodology The analysis of the traffic impacts from the proposed development and the assessment of the required mitigation measures were based on an evaluation of the existing and forecast traffic conditions in the vicinity of the site with and without the project. The following analysis years are considered in this report: Existing Conditions (2015) Existing Plus Project Conditions 1 Opening Year Conditions (2017) Existing intersection traffic conditions were established through morning and evening peak hour traffic counts obtained by Kunzman Associates, Inc. in January 2015 (see Appendix B). In addition, truck classification counts were conducted at the study area intersections. The existing percent of trucks were used in the conversion of trucks to Passenger Car Equivalent s. Project traffic volumes for all future projections were estimated using the manual approach. Trip generation has been estimated based on the Institute of Transportation Engineers, Trip Generation, 9th Edition, 2012 and the City of Fontana, Truck Trip Generation Study, August The average daily traffic volume forecasts have been determined using the growth increment approach on the San Bernardino Transportation Analysis Model (SBTAM) Traffic Model Year 2008 and Year 2035 average daily traffic volume forecasts (see Appendix C). This difference defines the growth in traffic over the 35 year period. The incremental growth in average daily traffic volume has been factored to reflect the forecast growth between Year 2015 and Year For this purpose, linear growth between the Year 2008 base condition and the forecast Year 2035 condition was assumed. Since the increment between Year 2015 and Year 2035 is 20 years of the 35 year time frame, a factor of 0.57 (i.e., 20/35) was used. The Buildout Year (2035) daily roadway segment volume forecasts have been determined using the growth increment approach on the SBTAM Traffic Model Year 2008 and Year 2035 volumes. The growth increment calculation worksheet is shown in Appendix C. Being that 1 The existing plus project conditions has been analyzed to comply with the Sunnyvale West Neighborhood Association v. City of Sunnyvale CEQA court case. This scenario assumes the full development of the proposed project and full absorption of the proposed project trips on the circulation system at the present time. This scenario is provided for informational purposes only, and will not be used for impact determinations or mitigation. 2

10 the SBTAM model only has traffic volumes for Valley Boulevard and does not have Redwood Avenue, Rosemary Drive, Iris Drive, or Hunter Street within its network, a growth rate was formulated for Opening Year (2017) traffic conditions. The Existing and Opening Year (2017) average daily traffic volumes for Valley Boulevard were used to determine the growth rate. The formula used is: (((2017 ADT - Existing ADT) / Existing ADT) / 2 years). Using the ADT data as shown In Appendix C, the annual growth rate is 2.14% (((19,500-18,700) / 18700) / 2). Opening Year (2017) traffic volumes consist of Existing traffic volumes with an annual ambient growth rate of 2.14% applied over a two year period (1.0214^2 = ). The County of San Bernardino staff stated that there are no cumulative developments within the study area to be included in this analysis. The City of Fontana provided a list of cumulative development in the study area. Cumulative development has been added to Opening Year (2017) traffic conditions. Project traffic volumes were then added to the SBTAM Traffic Model traffic volumes. Quality control checks and forecast adjustments were performed as necessary to ensure that all future traffic volume forecasts reflect a minimum of 10% growth over existing traffic volumes for Buildout Year (2035) traffic volumes. The Opening Year (2017) traffic volumes have been interpolated from the Buildout Year (2035) traffic volumes based upon a portion of the future growth increment. The result of this traffic forecasting procedure is a series of traffic volumes suitable for traffic operations analysis. The technique used to assess the capacity needs of an intersection is known as the Intersection Delay Method (see Appendix C) based on the Highway Capacity Manual Transportation Research Board Special Report 209. To calculate delay, the volume of traffic using the intersection is compared with the capacity of the intersection. It should be noted that the signalized intersections are considered deficient (Level of Service F) if the overall intersection critical volume to capacity ratio equals or exceeds 1.0, even if the level of service defined by the delay value is below the defined Level of Service standard. The volume to capacity ratio is defined as the critical volumes divided by the intersection capacity. A volume to capacity ratio greater than 1.0 implies that the traffic volume demand is greater than the capacity of the intersection and as a result traffic may begin to queue during the analyzed peak hour. The Level of Service analysis for signalized intersections has been performed using optimized signal timing. This analysis has included an assumed lost time of two seconds per phase. Signal timing optimization has considered pedestrian safety and signal coordination requirements. Appropriate time for pedestrian crossings has also been considered in the signalized intersection analysis. The following formula has been used to calculate the pedestrian minimum times for all Highway Capacity Manual runs: [(Curb to curb distance) / (3.5 feet/second)] + 7 seconds. For existing/existing plus project/opening Year (2017) traffic conditions, saturation flow rates of 1,800 vehicles per hour of green for through and right turn lanes and 1,700 vehicles 3
 traffic volumes consist of Existing traffic volumes with an annual ambient growth rate of 2.14% applied over a two year period (1.0214^2 = 1.0428).")
11 per lane for single left turn lanes, 1,600 vehicles per lane for dual left turn lanes and 1,500 vehicles per lane for triple left turn lanes have been assumed for the capacity analysis. The peak hour traffic volumes have been adjusted to peak 15 minute volumes for analysis purposes using the existing observed peak 15 minute to peak hour factors for all scenarios analyzed. Where feasible improvements in accordance with the local jurisdiction s General Plan and which result in acceptable operations cannot be identified. D. Definition of Deficiency and Significant Impact The following definitions of deficiencies and significant impacts have been developed in accordance with the County of San Bernardino requirements. 1. Definition of Deficiency The definition of an intersection deficiency has been obtained from the County of San Bernardino General Plan. The General Plan states that peak hour intersection operations of Level of Service D or better are generally acceptable. Therefore, any intersection operating at Level of Service E or F will be considered deficient. The definition of an intersection deficiency has also been obtained from the City of Fontana General Plan. The General Plan states that peak hour intersection operations of Level of Service D or better are generally acceptable. Therefore, any intersection operating at Level of Service E to F will be considered deficient. 2. Definition of Significant Impact The identification of significant impacts is a requirement of the California Environmental Quality Act. The County of San Bernardino General Plan and Circulation Element have been adopted in accordance with California Environmental Quality Act requirements, and any roadway improvements within the County of San Bernardino that are consistent with these documents are not considered a significant impact, so long as the project contributes its fair share funding for improvements. 4

12 A traffic impact is considered significant if the project both: i) contributes measurable traffic to and ii) substantially and adversely changes the Level of Service at any off-site location projected to experience deficient operations under foreseeable cumulative conditions, where feasible improvements consistent with the County of San Bernardino General Plan cannot be constructed. 5

13
14
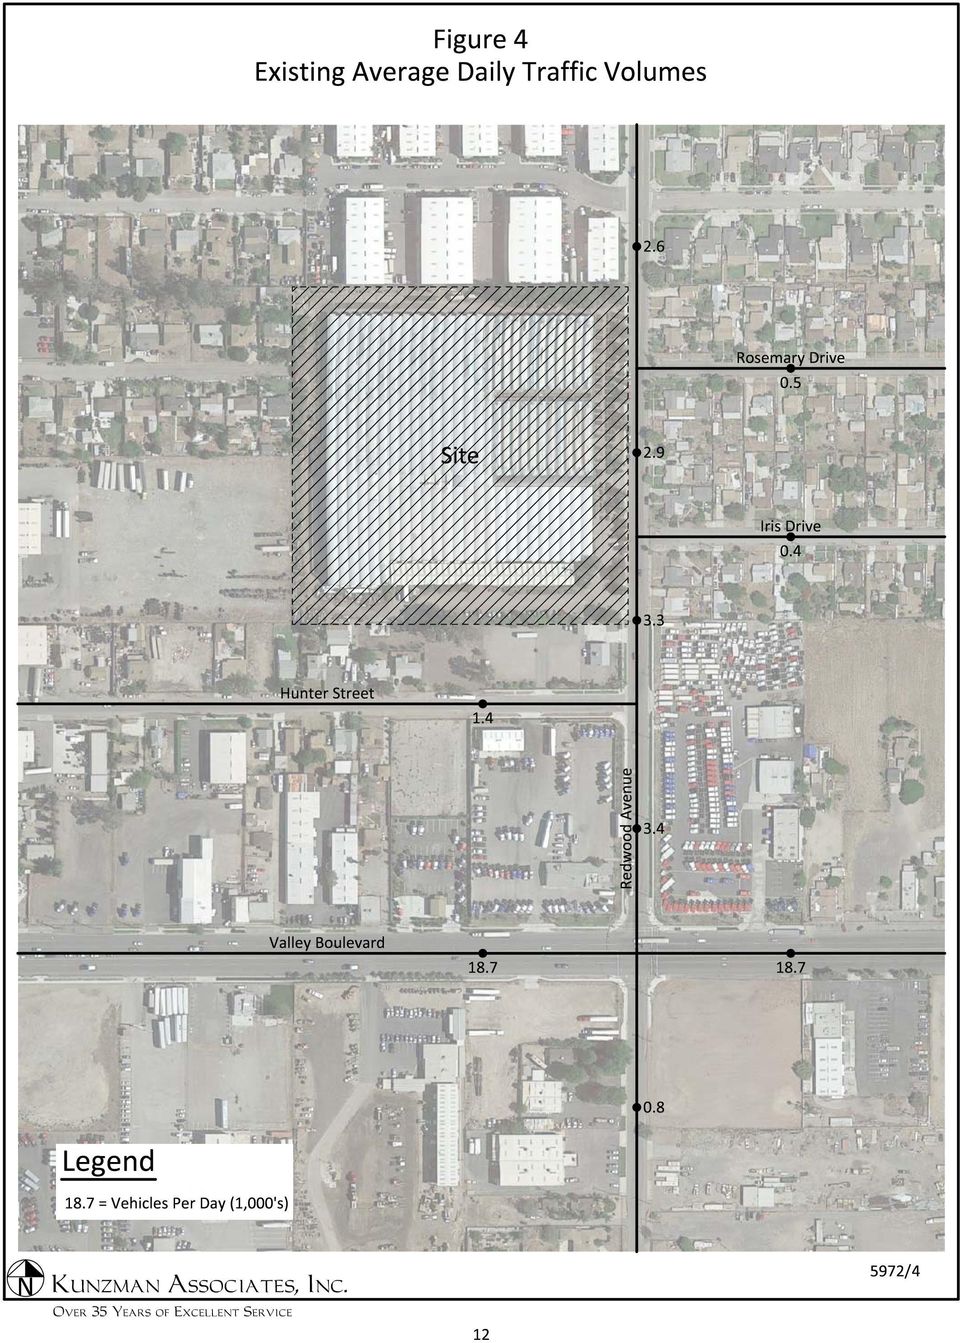
15 II. Existing Conditions A. Existing Roadway System Figure 3 identifies the existing conditions for study area roadways. The number of through lanes for existing roadways and the existing intersection controls are identified. Regional access to the project site is provided by the I-10 Freeway. Local access is provided by various roadways in the vicinity of the site. The east-west roadways expected to provide local access include Rosemary Drive, Iris Drive, Hunter Street, and Valley Boulevard. The north-south roadway expected to provide local access is Redwood Avenue. B. Existing Volumes Figure 4 depicts the existing average daily traffic volumes. The existing average daily traffic volumes were obtained and factored from peak hour counts (see Appendix B) by Kunzman Associates, Inc. using the following formula for each intersection leg: PM Peak Hour (Approach + Exit Volume) x 11.5 = Daily Leg Volume. This is a conservative estimate and may over estimate the average daily traffic volumes. Existing intersection traffic conditions were established through morning and evening peak hour traffic counts obtained by Kunzman Associates, Inc. from January 2015 (see Appendix B) and shown on Figures 5 and 6, respectively. Explicit peak hour factors have been calculated using the data collected for this effort as well. The morning and evening peak hour traffic volumes were identified by counting the two-hour periods from 7:00 AM 9:00 AM and 4:00 PM 6:00 PM. In addition, truck classification counts were conducted at the study area intersections. The existing percent of trucks were used in the conversion of trucks to Passenger Car Equivalent s (see Appendix B). C. Existing Level of Service The Existing delay and Level of Service for intersections in the vicinity of the project are shown in Table 1. For Existing traffic conditions, the study area intersections currently operate within acceptable Levels of Service during the peak hours. Existing delay worksheets are provided in Appendix D. D. Planned Transportation Improvements and Relationship to General Plan The County of San Bernardino General Plan Circulation Element is shown on Figure 7. Existing and future roadways are included in the Circulation Element of the General Plan and are graphically depicted on Figure 7. This figure shows the nature and extent of arterial highways that are needed to adequately serve the ultimate development depicted by the 8

16 Land Use Element of the General Plan. The County of San Bernardino General Plan roadway cross-sections are shown on Figure 8. The City of Fontana General Plan Circulation Element is shown on Figure 9. Existing and future roadways are included in the Circulation Element of the General Plan and are graphically depicted on Figure 9. This figure shows the nature and extent of arterial highways that are needed to adequately serve the ultimate development depicted by the Land Use Element of the General Plan. The City of Fontana General Plan roadway crosssections are shown on Figure 10. 9

17 Table 1 Existing Intersection Delay and Level of Service Intersection Approach Lanes 1 Peak Hour Traffic Northbound Southbound Eastbound Westbound Delay-LOS 2 Intersection Jurisdiction Control 3 L T R L T R L T R L T R Morning Evening Redwood Avenue (NS) at: Rosemary Drive (EW) - #2 County of SB CSS A 9.8-A Iris Drive (EW) - #3 County of SB CSS B 9.9-A Hunter Street (EW) - #5 County of SB CSS B 10.3-B Valley Boulevard (EW) - #6 County of SB/City of Fontana TS d d 1 2 d 1 2 d 18.1-B 18.0-B 1 When a right turn lane is designated, the lane can either be striped or unstriped. To function as a right turn lane there must be sufficient width for right turning vehicles to travel outside the through lanes. L = Left; T = Through; R = Right; d = De Facto Right Turn 2 Delay and level of service has been calculated using the following analysis software: Traffix, Version (2008). Per the Highway Capacity Manual, overall average intersection delay and level of service are shown for intersections with traffic signal or all way stop control. For intersections with cross street stop control, the delay and level of service for the individual movement (or movements sharing a single lane) are shown. 3 CSS = Cross Street Stop; TS = Traffic Signal 10

18

19
20

21
22
23
24
25
26 III. Project Trips A. Project Description The project site is proposed to be developed with 215,000 square feet of high-cube warehouse distribution center. The project will have access to Redwood Avenue. B. Trip Generation The trips generated by the project are determined by multiplying an appropriate trip generation rate by the quantity of land use. Trip generation rates are predicated on the assumption that energy costs, the availability of roadway capacity, the availability of vehicles to drive, and life styles remain similar to what are known today. A major change in these variables may affect trip generation rates. Trip generation rates were determined for daily trips, morning peak hour inbound and outbound trips, and evening peak hour inbound and outbound trips for the proposed land use. By multiplying the trip generation rates by the land use quantity, the traffic volumes are determined. Table 2 shows the project trip generation based upon rates obtained from the Institute of Transportation Engineers, Trip Generation, 9th Edition, and the City of Fontana, Truck Trip Generation Study, August As shown in Table 2, the proposed development is projected to generate approximately 474 daily vehicle trips in Passenger Car Equivalent's, 32 of which will occur during the morning peak hour in Passenger Car Equivalent's and 34 of which will occur during the evening peak hour in Passenger Car Equivalent's. C. Trip Distribution Figures 11 to 13 contain the directional distribution of the project trips for the proposed land use. To determine the trip distributions for the proposed project, peak hour traffic counts of the existing directional distribution of traffic for existing areas in the vicinity of the site and other additional information on future development and traffic impacts in the area were reviewed. D. Trip Assignment Based on the identified trip generation and distributions, project average daily traffic volumes have been calculated and shown on Figure 14. Morning and evening peak hour intersection turning movement volumes expected from the project are shown on Figures 15 and 16, respectively. E. Trip Contribution Test No analysis is required further than 5 miles from the project site. The roadway elements that must be analyzed are dependent on both the analysis year [project Opening Year) and 19
27 project generated traffic volumes. The identification of the study area, and the intersections and highway segments requiring analysis, was based on an estimate of the two-way traffic volumes on the roadway segments near the project site. All arterial segments have been included in the analysis when the anticipated project volume equals or exceeds 50 two-way trips in the peak hours. The requirement is 100 two-way peak hour trips for freeways. Figure 17 graphically depicts the project trip contribution test volumes on all of the roadway segments adjacent to the potential intersection analysis locations until the project volume contribution has clearly dropped below the 50 trip threshold and 100 trip threshold. The project does not contribute trips greater than the freeway threshold volume of 100 two-way peak hour trips. The project does not contribute trips greater than the arterial link threshold volume of 50 two-way trips in the morning and evening peak hours in the adjacent City of Fontana. 20
28 Table 2 Project Trip Generation 1 Type of Vehicle Passenger 2 Axle 3 Axle 4+ Axle Total Descriptor Quantity Units 2 Car Truck Truck Truck Trucks Total Land Use: High Cube TSF 79.57% 3.46% 4.64% 12.33% 20.43% 100% Traffic Generation Rates in trips per TSF Daily Morning Peak Hour Evening Peak Hour Traffic Generation in Vehicles Daily Morning Peak Hour Inbound Outbound Total Evening Peak Hour Inbound Outbound Total Passenger Car Equivalent's (PCE'S) Factor Traffic Generation in PCE's Daily Morning Peak Hour Inbound Outbound Total Evening Peak Hour Inbound Outbound Total Source: Institute of Transportation Engineers, Trip Generation, 9th Edition, 2012, Land Use Category 152 and City of Fontana, Truck Trip Generation Study, August TSF = Thousand Square Feet 3 Passenger Car Equivalent factors are recommended by San Bernardino Associated Governments (SANBAG). 21
29
30
31
32
33
34
35
36 IV. Future Conditions A. Future Volumes As described within Section I.C., the Buildout Year (2035) average daily traffic volume forecasts with the project are developed using a growth increment process based on volumes predicted by the SBTAM Traffic Model Year 2008 and Year 2035 traffic models. The growth increment for Buildout Year (2035) on each roadway segment is the increase in SBTAM Traffic Model volumes from existing Year 2015 to Year The final Buildout Year (2035) roadway segment volume used for analysis purposes is then determined by adding the Buildout Year (2035) growth increment volume to the existing counted volume. Being that the SBTAM traffic model only has traffic volumes for Valley Boulevard and does not have Redwood Avenue, Rosemary Drive, Iris Drive, or Hunter Street within its network, a growth rate was formulated for Opening Year (2017) traffic conditions. The Existing and Opening Year (2017) average daily traffic volumes for Valley Boulevard were used to determine the growth rate. The formula used is: (((2017 ADT - Existing ADT) / Existing ADT) / 2 years). Using the ADT data as shown In Appendix C, the annual growth rate is 2.14% (((19,500-18,700) / 18700) / 2). Opening Year (2017) traffic volumes consist of Existing traffic volumes with an annual ambient growth rate of 2.14% applied over a two year period (1.0214^2 = ). The County of San Bernardino staff stated that there are no cumulative developments within the study area to be included in this analysis. The City of Fontana provided a list of cumulative development in the study area. Cumulative development in the study area that are within the unincorporated County of San Bernardino and City of Fontana are shown in Figure 18. Cumulative development has been added to Opening Year (2017) traffic conditions. Table 3 shows the cumulative development daily and peak hour trip generation. Figure 19 shows the cumulative development average daily traffic volumes. Cumulative development morning and evening peak hour intersection turning movement volumes are shown on Figures 20 and 21, respectively. 1. Existing Plus Project The average daily traffic volumes for Existing Plus Project traffic conditions have been determined. Existing Plus Project average daily traffic volumes are shown on Figure Opening Year (2017) With Ambient The average daily traffic volumes for Opening Year (2017) With Ambient traffic conditions have been determined as described above using the growth interpolation process (see Section I.C.). Opening Year (2017) With Ambient average daily traffic volumes are shown on Figure
37 3. Opening Year (2017) With Ambient and Project The average daily traffic volumes for Opening Year (2017) With Ambient and Project traffic conditions have been determined as described above using the volume addition process (see Section I.C.). Opening Year (2017) With Ambient and Project average daily traffic volumes are shown on Figure Opening Year (2017) With Ambient and Cumulative and Project The average daily traffic volumes for Opening Year (2017) With Ambient and Cumulative and Project traffic conditions have been determined as described above using the volume addition process (see Section I.C.). Opening Year (2017) With Ambient and Cumulative and Project average daily traffic volumes are shown on Figure 25. B. Future Level of Service 1. Existing Plus Project The Existing Plus Project delay and Level of Service for the study area roadway network are shown in Table 4. Table 4 shows delay values based on the geometrics at the study area intersections without and with improvements. Existing Plus Project delay calculation worksheets are provided in Appendix D. Existing Plus Project morning and evening peak hour intersection turning movement volumes are shown on Figures 26 and 27, respectively. For Existing Plus Project traffic conditions, the study area intersections are projected to operate within acceptable Levels of Service during the peak hours, with improvements. 2. Opening Year (2017) With Ambient The Opening Year (2017) With Ambient delay and Level of Service for the study area roadway network are shown in Table 5. Table 5 shows delay values based on the existing geometrics at the study area intersections. Opening Year (2017) With Ambient delay calculation worksheets are provided in Appendix D. Opening Year (2017) With Ambient morning and evening peak hour intersection turning movement volumes are shown on Figures 28 and 29, respectively. For Opening Year (2017) With Ambient traffic conditions, the study area intersections are projected to operate within acceptable Levels of Service during the peak hours. 3. Opening Year (2017) With Ambient and Project The Opening Year (2017) With Ambient and Project delay and Level of Service for the study area roadway network are shown in Table 6. Table 6 shows delay values based on the geometrics at the study area intersections without and with improvements. Opening Year (2017) With Ambient and Project delay calculation worksheets are 30
38 provided in Appendix D. Opening Year (2017) With Ambient and Project morning and evening peak hour intersection turning movement volumes are shown on Figures 30 and 31, respectively. For Opening Year (2017) With Ambient and Project traffic conditions, the study area intersections are projected to operate within acceptable Levels of Service during the peak hours, with improvements. 4. Opening Year (2017) With Ambient and Cumulative and Project The Opening Year (2017) With Ambient and Cumulative and Project delay and Level of Service for the study area roadway network are shown in Table 7. Table 7 shows delay values based on the geometrics at the study area intersections without and with improvements. Opening Year (2017) With Ambient and Cumulative and Project delay calculation worksheets are provided in Appendix D. Opening Year (2017) With Ambient and Cumulative and Project morning and evening peak hour intersection turning movement volumes are shown on Figures 32 and 33, respectively. For Opening Year (2017) With Ambient and Cumulative and Project traffic conditions, the study area intersections are projected to operate within acceptable Levels of Service during the peak hours, with improvements. 31
39 Table 3 Other Development Trip Generation 1 Traffic Peak Hour Analysis Zone Name Land Use Quantity Units 2 Inbound Morning Outbound Total Inbound Evening Outbound Total Daily 1 ASP '13-43 Medical Office TSF DRP '14-11 Light Industrial - Cars TSF Light Industrial - Trucks TSF DRP '14-12 Light Industrial - Cars TSF ,768 Light Industrial - Trucks TSF ,088 ASP '13-24 Auto Repair Center TSF ASP '13-47 Donation Center TSF ,742 Total ,220 1 Source: City of Fontana Development List 2 TSF = Thousand Square Feet 3 Source: Institute of Transportation Engineers, Trip Generation, 9th Edition, 2012, Land Use Categories 110, 720, 815, and 942. City of Fontana, Truck Trip Generation Study, August San Diego Association of Governments, Brief Guide of Vehicular Traffic Generation Rates for the San Diego Region, April
40 Table 4 Existing Plus Project Intersection Delay and Level of Service Intersection Approach Lanes 1 Peak Hour Traffic Northbound Southbound Eastbound Westbound Delay-LOS 2 Intersection Jurisdiction Control 3 L T R L T R L T R L T R Morning Evening Redwood Avenue (NS) at: Project North Access (EW) - #1 County of SB CSS A 9.2-A Rosemary Drive (EW) - #2 County of SB CSS A 9.9-A Iris Drive (EW) - #3 County of SB CSS B 10.0-A Project South Access (EW) - #4 County of SB CSS A 8.9-A Hunter Street (EW) - #5 County of SB CSS B 10.6-B Valley Boulevard (EW) - #6 County of SB/City of Fontana TS d d 1 2 d 1 2 d 18.3-B 18.3-B 1 When a right turn lane is designated, the lane can either be striped or unstriped. To function as a right turn lane there must be sufficient width for right turning vehicles to travel outside the through lanes. L = Left; T = Through; R = Right; d = De Facto Right Turn; 1 = Improvement 2 Delay and level of service has been calculated using the following analysis software: Traffix, Version (2008). Per the Highway Capacity Manual, overall average intersection delay and level of service are shown for intersections with traffic signal or all way stop control. For intersections with cross street stop control, the delay and level of service for the individual movement (or movements sharing a single lane) are shown. 3 CSS = Cross Street Stop; TS = Traffic Signal 33
41 Table 5 Opening Year (2017) With Ambient Intersection Delay and Level of Service Intersection Approach Lanes 1 Peak Hour Traffic Northbound Southbound Eastbound Westbound Delay-LOS 2 Intersection Jurisdiction Control 3 L T R L T R L T R L T R Morning Evening Redwood Avenue (NS) at: Rosemary Drive (EW) - #2 County of SB CSS A 9.9-A Iris Drive (EW) - #3 County of SB CSS B 10.0-A Hunter Street (EW) - #5 County of SB CSS B 10.5-B Valley Boulevard (EW) - #6 County of SB/City of Fontana TS d d 1 2 d 1 2 d 18.2-B 18.2-B 1 When a right turn lane is designated, the lane can either be striped or unstriped. To function as a right turn lane there must be sufficient width for right turning vehicles to travel outside the through lanes. L = Left; T = Through; R = Right; d = De Facto Right Turn 2 Delay and level of service has been calculated using the following analysis software: Traffix, Version (2008). Per the Highway Capacity Manual, overall average intersection delay and level of service are shown for intersections with traffic signal or all way stop control. For intersections with cross street stop control, the delay and level of service for the individual movement (or movements sharing a single lane) are shown. 3 CSS = Cross Street Stop; TS = Traffic Signal 34
42 Table 6 Opening Year (2017) With Ambient and Project Intersection Delay and Level of Service Intersection Approach Lanes 1 Peak Hour Traffic Northbound Southbound Eastbound Westbound Delay-LOS 2 Intersection Jurisdiction Control 3 L T R L T R L T R L T R Morning Evening Redwood Avenue (NS) at: Project North Access (EW) - #1 County of SB CSS A 9.2-A Rosemary Drive (EW) - #2 County of SB CSS A 9.9-A Iris Drive (EW) - #3 County of SB CSS B 10.1-B Project South Access (EW) - #4 County of SB CSS A 8.9-A Hunter Street (EW) - #5 County of SB CSS B 10.7-B Valley Boulevard (EW) - #6 County of SB/City of Fontana TS d d 1 2 d 1 2 d 18.4-B 18.5-B 1 When a right turn lane is designated, the lane can either be striped or unstriped. To function as a right turn lane there must be sufficient width for right turning vehicles to travel outside the through lanes. L = Left; T = Through; R = Right; d = De Facto Right Turn; 1 = Improvement 2 Delay and level of service has been calculated using the following analysis software: Traffix, Version (2008). Per the Highway Capacity Manual, overall average intersection delay and level of service are shown for intersections with traffic signal or all way stop control. For intersections with cross street stop control, the delay and level of service for the individual movement (or movements sharing a single lane) are shown. 3 CSS = Cross Street Stop; TS = Traffic Signal 35
43 Table 7 Opening Year (2017) With Ambient and Cumulative and Project Intersection Delay and Level of Service Intersection Approach Lanes 1 Peak Hour Traffic Northbound Southbound Eastbound Westbound Delay-LOS 2 Intersection Jurisdiction Control 3 L T R L T R L T R L T R Morning Evening Redwood Avenue (NS) at: Project North Access (EW) - #1 County of SB CSS A 9.2-A Rosemary Drive (EW) - #2 County of SB CSS A 9.9-A Iris Drive (EW) - #3 County of SB CSS B 10.1-B Project South Access (EW) - #4 County of SB CSS A 8.9-A Hunter Street (EW) - #5 County of SB CSS B 10.7-B Valley Boulevard (EW) - #6 County of SB/City of Fontana TS d d 1 2 d 1 2 d 18.5-B 18.6-B 1 When a right turn lane is designated, the lane can either be striped or unstriped. To function as a right turn lane there must be sufficient width for right turning vehicles to travel outside the through lanes. L = Left; T = Through; R = Right; d = De Facto Right Turn; 1 = Improvement 2 Delay and level of service has been calculated using the following analysis software: Traffix, Version (2008). Per the Highway Capacity Manual, overall average intersection delay and level of service are shown for intersections with traffic signal or all way stop control. For intersections with cross street stop control, the delay and level of service for the individual movement (or movements sharing a single lane) are shown. 3 CSS = Cross Street Stop; TS = Traffic Signal 36
44
45
46
47
48
49
50
51
52
53
54
55
56
57
58
59
60 V. Conclusions and Recommendations A. Summary The traffic issues related to the proposed land use and development have been evaluated in the context of the California Environmental Quality Act. The County of San Bernardino is the lead agency responsible for preparation of the traffic impact analysis, in accordance with the California Environmental Quality Act authorizing legislation. This report analyzes traffic impacts for the anticipated opening date with full occupancy of the development in Year 2017, at which time it will be generating trips at its full potential. A series of scoping discussions were conducted with the County of San Bernardino to define the desired analysis locations for each future analysis year. In addition, staff from the County of San Bernardino has also been contacted to discuss the project and its associated travel patterns. No analysis is required further than 5 miles from the project site. The roadway elements that must be analyzed are dependent on both the analysis year (project Opening Year) and project generated traffic volumes. The identification of the study area, and the intersections and highway segments requiring analysis, was based on an estimate of the two-way traffic volumes on the roadway segments near the project site. All arterial segments have been included in the analysis when the anticipated project volume equals or exceeds 50 two-way trips in the peak hours. The requirement is 100 two-way peak hour trips for freeways. The project does not contribute trips greater than the freeway threshold volume of 100 two-way peak hour trips. The project does not contribute trips greater than the arterial link threshold volume of 50 two-way trips in the morning and evening peak hours in the adjacent City of Fontana. The average daily traffic volume forecasts have been determined using the growth increment approach on the San Bernardino Transportation Analysis Model (SBTAM) traffic model Year 2008 and Year 2035 average daily traffic volume forecasts (see Appendix C). This difference defines the growth in traffic over the 35 year period. The incremental growth in average daily traffic volume has been factored to reflect the forecast growth between Year 2015 and Year For this purpose, linear growth between the Year 2008 base condition and the forecast Year 2035 condition was assumed. Since the increment between Year 2015 and Year 2035 is 20 years of the 35 year time frame, a factor of 0.57 (i.e., 20/35) was used. The Buildout Year (2035) daily roadway segment volume forecasts have been determined using the growth increment approach on the SBTAM traffic model Year 2008 and Year 2035 volumes. The growth increment calculation worksheet is shown in Appendix C. Being that the SBTAM model only has traffic volumes for Valley Boulevard and does not have Redwood 53
61 Avenue, Rosemary Drive, Iris Drive, or Hunter Street within its network, a growth rate was formulated for Opening Year (2017) traffic conditions. The Existing and Opening Year (2017) average daily traffic volumes for Valley Boulevard were used to determine the growth rate. The formula used is: (((2017 ADT - Existing ADT) / Existing ADT) / 2 years). Using the ADT data as shown In Appendix C, the annual growth rate is 2.14% (((19,500-18,700) / 18700) / 2). Opening Year (2017) traffic volumes consist of Existing traffic volumes with an annual ambient growth rate of 2.14% applied over a two year period (1.0214^2 = ). The County of San Bernardino staff stated that there are no cumulative developments within the study area to be included in this analysis. The City of Fontana provided a list of cumulative development in the study area. Cumulative development has been added to Opening Year (2017) traffic conditions. Project traffic volumes were then added to the SBTAM traffic model traffic volumes. Quality control checks and forecast adjustments were performed as necessary to ensure that all future traffic volume forecasts reflect a minimum of 10% growth over existing traffic volumes for Buildout Year (2035) traffic volumes. The Opening Year (2017) traffic volumes have been interpolated from the Buildout Year (2035) traffic volumes based upon a portion of the future growth increment. The result of this traffic forecasting procedure is a series of traffic volumes suitable for traffic operations analysis. B. Existing Conditions Regional access to the project site is provided by the I-10 Freeway. Local access is provided by various roadways in the vicinity of the site. The east-west roadways expected to provide local access include Rosemary Drive, Iris Drive, Hunter Street, and Valley Boulevard. The north-south roadway expected to provide local access is Redwood Avenue. For Existing traffic conditions, the study area intersections currently operate within acceptable Levels of Service during the peak hours. C. Project Trips Trip generation rates were determined for daily trips, morning peak hour inbound and outbound trips, and evening peak hour inbound and outbound trips for the proposed land use. By multiplying the trip generation rates by the land use quantity, the traffic volumes are determined. Table 2 shows the project trip generation based upon rates obtained from the Institute of Transportation Engineers, Trip Generation, 9th Edition, and the City of Fontana, Truck Trip Generation Study, August The proposed development is projected to generate approximately 474 daily vehicle trips in Passenger Car Equivalent's, 32 of which will occur during the morning peak hour in Passenger Car Equivalent's and 34 of which will occur during the evening peak hour in Passenger Car Equivalent's. 54
62 To determine the trip distributions for the proposed project, peak hour traffic counts of the existing directional distribution of traffic for existing areas in the vicinity of the site and other additional information on future development and traffic impacts in the area were reviewed. D. Future Conditions An Existing Plus Project and Opening Year (2017) analysis are included in this report. The traffic operations analyses are summarized in Table Existing Plus Project For Existing Plus Project traffic conditions, the study area intersections are projected to operate within acceptable Levels of Service during the peak hours, with improvements. 2. Opening Year (2017) With Ambient For Opening Year (2017) With Ambient traffic conditions, the study area intersections are projected to operate within acceptable Levels of Service during the peak hours. 3. Opening Year (2017) With Ambient and Project For Opening Year (2017) With Ambient and Project traffic conditions, the study area intersections are projected to operate within acceptable Levels of Service during the peak hours, with improvements. 4. Opening Year (2017) With Ambient and Cumulative and Project For Opening Year (2017) With Ambient and Cumulative and Project traffic conditions, the study area intersections are projected to operate within acceptable Levels of Service during the peak hours, with improvements. E. Recommendations The recommendations in this section address on-site improvements, off-site improvements and the phasing of all necessary study area transportation improvements. 1. On-Site Improvements On-site improvements and improvements adjacent to the site will be required in conjunction with the proposed development to ensure adequate circulation within the project itself (see Figure 34). Construct Redwood Avenue from the north project boundary to the south project boundary at its ultimate half-section width including landscaping and parkway improvements in conjunction with development, as necessary. 55
63 Sight distance at project accesses should be reviewed with respect to California Department of Transportation/County of San Bernardino standards in conjunction with the preparation of final grading, landscaping, and street improvement plans. The final grading, landscaping, and street improvement plans shall demonstrate that sight distance standards are met. Such plans must be reviewed by the County and approved as consistent with this measure prior to issue of grading permits. On-site traffic signing and striping should be implemented in conjunction with detailed construction plans for the project. The site should provide sufficient parking spaces to meet County of San Bernardino parking code requirements in order to service on-site parking demand. 2. Off-Site Improvements As is the case for any roadway design, the County of San Bernardino should periodically review traffic operations in the vicinity of the project once the project is constructed to assure that the traffic operations are satisfactory. 56
64 Table 8 Intersection Delay and Level of Service Summary Peak Hour Delay-LOS Opening Year (2017) With Ambient and With Ambient and Cumulative and Existing Existing Plus Project With Ambient Project Project Intersection Jurisdiction Morning Evening Morning Evening Morning Evening Morning Evening Morning Evening Redwood Avenue (NS) at: Project North Access (EW) - #1 County of SB A 9.2-A A 9.2-A 9.1-A 9.2-A Rosemary Drive (EW) - #2 County of SB 9.8-A 9.8-A 9.9-A 9.9-A 9.9-A 9.9-A 10.0-A 9.9-A 10.0-A 9.9-A Iris Drive (EW) - #3 County of SB 10.0-B 9.9-A 10.2-B 10.0-A 10.1-B 10.0-A 10.3-B 10.1-B 10.3-B 10.1-B Project South Access (EW) - #4 County of SB A 8.9-A A 8.9-A 8.9-A 8.9-A Hunter Street (EW) - #5 County of SB 10.2-B 10.3-B 10.5-B 10.6-B 10.3-B 10.5-B 10.6-B 10.7-B 10.6-B 10.7-B Valley Boulevard (EW) - #6 County of SB/City of Fontana 18.1-B 18.0-B 18.3-B 18.3-B 18.2-B 18.2-B 18.4-B 18.5-B 18.5-B 18.6-B 57
65
66 Appendices Appendix A Glossary of Transportation Terms Appendix B Traffic Count Worksheets Appendix C Future Growth Increment Calculation Worksheets Appendix D Explanation and Calculation of Intersection Delay
67 APPENDIX A Glossary of Transportation Terms
68 COMMON ABBREVIATIONS GLOSSARY OF TRANSPORTATION TERMS AC: ADT: Caltrans: DU: ICU: LOS: TSF: V/C: VMT: Acres Average Daily Traffic California Department of Transportation Dwelling Unit Intersection Capacity Utilization Level of Service Thousand Square Feet Volume/Capacity Vehicle Miles Traveled TERMS AVERAGE DAILY TRAFFIC: The total volume during a year divided by the number of days in a year. Usually only weekdays are included. BANDWIDTH: The number of seconds of green time available for through traffic in a signal progression. BOTTLENECK: A constriction along a travelway that limits the amount of traffic that can proceed downstream from its location. CAPACITY: The maximum number of vehicles that can be reasonably expected to pass over a given section of a lane or a roadway in a given time period. CHANNELIZATION: The separation or regulation of conflicting traffic movements into definite paths of travel by the use of pavement markings, raised islands, or other suitable means to facilitate the safe and orderly movements of both vehicles and pedestrians. CLEARANCE INTERVAL: Nearly same as yellow time. If there is an all red interval after the end of a yellow, then that is also added into the clearance interval. CORDON: An imaginary line around an area across which vehicles, persons, or other items are counted (in and out). CYCLE LENGTH: The time period in seconds required for one complete signal cycle. CUL DE SAC STREET: A local street open at one end only, and with special provisions for turning around.
69 DAILY CAPACITY: The daily volume of traffic that will result in a volume during the peak hour equal to the capacity of the roadway. DELAY: The time consumed while traffic is impeded in its movement by some element over which it has no control, usually expressed in seconds per vehicle. DEMAND RESPONSIVE SIGNAL: Same as traffic actuated signal. DENSITY: The number of vehicles occupying in a unit length of the through traffic lanes of a roadway at any given instant. Usually expressed in vehicles per mile. DETECTOR: A device that responds to a physical stimulus and transmits a resulting impulse to the signal controller. DESIGN SPEED: A speed selected for purposes of design. Features of a highway, such as curvature, superelevation, and sight distance (upon which the safe operation of vehicles is dependent) are correlated to design speed. DIRECTIONAL SPLIT: The percent of traffic in the peak direction at any point in time. DIVERSION: The rerouting of peak hour traffic to avoid congestion. FORCED FLOW: Opposite of free flow. FREE FLOW: Volumes are well below capacity. Vehicles can maneuver freely and travel is unimpeded by other traffic. GAP: Time or distance between successive vehicles in a traffic stream, rear bumper to front bumper. HEADWAY: Time or distance spacing between successive vehicles in a traffic stream, front bumper to front bumper. INTERCONNECTED SIGNAL SYSTEM: A number of intersections that are connected to achieve signal progression. LEVEL OF SERVICE: A qualitative measure of a number of factors, which include speed and travel time, traffic interruptions, freedom to maneuver, safety, driving comfort and convenience, and operating costs. LOOP DETECTOR: A vehicle detector consisting of a loop of wire embedded in the roadway, energized by alternating current and producing an output circuit closure when passed over by a vehicle.
70 MINIMUM ACCEPTABLE GAP: Smallest time headway between successive vehicles in a traffic stream into which another vehicle is willing and able to cross or merge. MULTI MODAL: More than one mode; such as automobile, bus transit, rail rapid transit, and bicycle transportation modes. OFFSET: The time interval in seconds between the beginning of green at one intersection and the beginning of green at an adjacent intersection. PLATOON: A closely grouped component of traffic that is composed of several vehicles moving, or standing ready to move, with clear spaces ahead and behind. ORIGIN DESTINATION SURVEY: A survey to determine the point of origin and the point of destination for a given vehicle trip. PASSENGER CAR EQUIVALENTS (PCE): One car is one Passenger Car Equivalent. A truck is equal to 2 or 3 Passenger Car Equivalents in that a truck requires longer to start, goes slower, and accelerates slower. Loaded trucks have a higher Passenger Car Equivalent than empty trucks. PEAK HOUR: The 60 consecutive minutes with the highest number of vehicles. PRETIMED SIGNAL: A type of traffic signal that directs traffic to stop and go on a predetermined time schedule without regard to traffic conditions. Also, fixed time signal. PROGRESSION: A term used to describe the progressive movement of traffic through several signalized intersections. SCREEN LINE: An imaginary line or physical feature across which all trips are counted, normally to verify the validity of mathematical traffic models. SIGNAL CYCLE: The time period in seconds required for one complete sequence of signal indications. SIGNAL PHASE: movements. The part of the signal cycle allocated to one or more traffic STARTING DELAY: The delay experienced in initiating the movement of queued traffic from a stop to an average running speed through a signalized intersection. TRAFFIC ACTUATED SIGNAL: A type of traffic signal that directs traffic to stop and go in accordance with the demands of traffic, as registered by the actuation of detectors.
71 TRIP: The movement of a person or vehicle from one location (origin) to another (destination). For example, from home to store to home is two trips, not one. TRIP END: One end of a trip at either the origin or destination; i.e. each trip has two trip ends. A trip end occurs when a person, object, or message is transferred to or from a vehicle. TRIP GENERATION RATE: The quantity of trips produced and/or attracted by a specific land use stated in terms of units such as per dwelling, per acre, and per 1,000 square feet of floor space. TRUCK: A vehicle having dual tires on one or more axles, or having more than two axles. UNBALANCED FLOW: Heavier traffic flow in one direction than the other. On a daily basis, most facilities have balanced flow. During the peak hours, flow is seldom balanced in an urban area. VEHICLE MILES OF TRAVEL: A measure of the amount of usage of a section of highway, obtained by multiplying the average daily traffic by length of facility in miles.
72 APPENDIX B Traffic Count Worksheets
73
74
75
76
77
78
79
80
81
82
83
84
85
86
87
88
89
90
91
92
93
94
95
96
97
98
99
100
101
102
103
104
105 APPENDIX C Future Growth Increment Calculation Worksheets
106
107 APPENDIX D Explanation and Calculation of Intersection Delay
108 EXPLANATION AND CALCULATION OF INTERSECTION LEVEL OF SERVICE USING DELAY METHODOLOGY The levels of service at the unsignalized and signalized intersections are calculated using the delay methodology in the Highway Capacity Manual. This methodology views an intersection as consisting of several lane groups. A lane group is a set of lanes serving a movement. If there are two northbound left turn lanes, then the lane group serving the northbound left turn movement has two lanes. Similarly, there may be three lanes in the lane group serving the northbound through movement, one lane in the lane group serving the northbound right turn movement, and so forth. It is also possible for one lane to serve two lane groups. A shared lane might result in there being 1.5 lanes in the northbound left turn lane group and 2.5 lanes in the northbound through lane group. For each lane group, there is a capacity. That capacity is calculated by multiplying the number of lanes in the lane group times a theoretical maximum lane capacity per lane time s 12 adjustment factors. Each of the 12 adjustment factors has a value of approximately A value less than 1.00 is generally assigned when a less than desirable condition occurs. The 12 adjustment factors are as follows: 1. Peak hour factor (to account for peaking within the peak hour) 2. Lane utilization factor (to account for not all lanes loading equally) 3. Lane width 4. Percent of heavy trucks 5. Approach grade 6. Parking 7. Bus stops at intersections 8. Area type (CBD or other) 9. Right turns 10. Left turns
109 11. Pedestrian activity 12. Signal progression The maximum theoretical lane capacity and the 12 adjustment factors for it are all unknowns for which approximate estimates have been recommended in the Highway Capacity Manual. For the most part, the recommended values are not based on statistical analysis but rather on educated estimates. However, it is possible to use the delay method and get reasonable results as will be discussed below. Once the lane group volume is known and the lane group capacity is known, a volume to capacity ratio can be calculated for the lane group. With a volume to capacity ratio calculated, average delay per vehicle in a lane group can be estimated. The average delay per vehicle in a lane group is calculated using a complex formula provided by the Highway Capacity Manual, which can be simplified and described as follows: Delay per vehicle in a lane group is a function of the following: 1. Cycle length 2. Amount of red time faced by a lane group 3. Amount of yellow time for that lane group 4. The volume to capacity ratio of the lane group The average delay per vehicle for each lane group is calculated, and eventually an overall average delay for all vehicles entering the intersection is calculated. This average delay per vehicle is then used to judge Level of Service. The Level of Services are defined in the table that follows this discussion. Experience has shown that when a maximum lane capacity of 1,900 vehicles per hour is used (as recommended in the Highway Capacity Manual), little or no yellow time penalty is used, and none of the 12 penalty factors are applied, calculated delay is realistic. The delay calculation for instance assumes that yellow time is totally unused. Yet experience shows that most of the yellow time is used. An idiosyncrasy of the delay methodology is that it is possible to add traffic to an intersection and reduce the average total delay per vehicle. If the average total delay is 30 seconds per vehicle for all vehicles traveling through an intersection, and traffic is added to a movement that has an average total delay of 15 seconds per vehicle, then the overall average total delay is reduced.
110 The delay calculation for a lane group is based on a concept that the delay is a function of the amount of unused capacity available. As the volume approaches capacity and there is no more unused capacity available, then the delay rapidly increases. Delay is not proportional to volume, but rather increases rapidly as the unused capacity approaches zero. Because delay is not linearly related to volumes, the delay does not reflect how close an intersection is to overloading. If an intersection is operating at Level of Service C and has an average total delay of 18 seconds per vehicle, you know very little as to what percent the traffic can increase before Level of Service E is reached.
111 LEVEL OF SERVICE DESCRIPTION 1 Level Of Service A B C D E F Description Level of Service A occurs when progression is extremely favorable and most vehicles arrive during the green phase. Most vehicles do not stop at all. Short cycle lengths may also contribute to low delay. Level of Service B generally occurs with good progression and/or short cycle lengths. More vehicles stop than for Level of Service A, causing higher levels of average total delay. Level of Service C generally results when there is fair progression and/or longer cycle lengths. Individual cycle failures may begin to appear in this level. The number of vehicles stopping is significant at this level, although many still pass through the intersection without stopping. Level of Service D generally results in noticeable congestion. Longer delays may result from some combination of unfavorable progression, long cycle lengths, or high volume to capacity ratios. Many vehicles stop, and the proportion of vehicles not stopping declines. Individual cycle failures are noticeable. Level of Service E is considered to be the limit of acceptable delay. These high delay values generally indicate poor progression, long cycle lengths, and high volume to capacity ratios. Individual cycle failures are frequent occurrences. Level of Service F is considered to be unacceptable to most drivers. This condition often occurs with oversaturation, i.e., when arrival flow rates exceed the capacity of the intersection. It may also occur at high volume to capacity ratios below 1.00 with many individual cycle failures. Poor progression and long cycle lengths may also be major contributing causes to such delay levels. Average Total Delay Per Vehicle (Seconds) Signalized Unsignalized 0 to to to to to to to to to to and up and up 1 Source: Highway Capacity Manual Special Report 209, Transportation Research Board, National Research Council, Washington, D.C., 2000.
112 Existing
113
114
115
116
117
118
119
120
121 Existing Plus Project
122
123
124
125
126
127
128
129
130
131
132
133
134 Opening Year (2017) With Ambient
135
136
137
138
139
140
141
142
143 Opening Year (2017) With Ambient and Project
144
145
146
147
148
149
150
151
152
153
154
155
156 Opening Year (2017) With Ambient and Cumulative and Project
157
158
159
160
161
162
163
164
165
166
167
168
169 1111 Town & Country Road, Suite 34 Orange, California (714)
Appendix E Traffic Impact Analysis
 Appendix E Traffic Impact Analysis 2010 Facility Master Plan Factoria Recycling and Transfer Station November 2010 2010 Facility Master Plan Factoria Recycling and Transfer Station November 2010 Department
ENGINEERING REPORT. College Street: Interstate 85 to Donahue Drive Traffic Signal System Feasibility Study Auburn, Alabama
 ENGINEERING REPORT College Street: Interstate 85 to Donahue Drive Traffic Signal System Feasibility Study Auburn, Alabama Prepared for: The City of Auburn Prepared by: 3644 Vann Road Suite 100 Birmingham,
TRAFFIC IMPACT ANALYSIS (TIA)
") GUIDELINES FOR TRAFFIC IMPACT ANALYSIS (TIA) FOR REZONING APPLICATIONS AND OTHER DEVELOPMENT APPROVALS REQUIRING TRANSPORTATION IMPACT ANALYSIS IN SUMTER COUNTY, FLORIDA July 17, 2007 PURPOSE AND APPLICABILITY
GUIDELINES FOR TRAFFIC IMPACT ANALYSIS (TIA) FOR REZONING APPLICATIONS AND OTHER DEVELOPMENT APPROVALS REQUIRING TRANSPORTATION IMPACT ANALYSIS IN SUMTER COUNTY, FLORIDA July 17, 2007 PURPOSE AND APPLICABILITY
Disputed Red Light Accidents: A Primer on Signal Control. Jon B. Landerville, MSME, PE Edward C. Fatzinger, MSME, PE Philip S.
 Disputed Red Light Accidents: A Primer on Signal Control Jon B. Landerville, MSME, PE Edward C. Fatzinger, MSME, PE Philip S. Wang, MSME Intersection Accident Statistics Intersection accidents occur on
1. REPORT CONTEXT Description of the development (include all of the following that are known at the time of the application):
:") Transportation Assessment and Management Study Guidelines for Consultants INTRODUCTION This document is intended to provide guidelines for transportation consultants who produce Transportation reports
Transportation Assessment and Management Study Guidelines for Consultants INTRODUCTION This document is intended to provide guidelines for transportation consultants who produce Transportation reports
1500 Hamilton Avenue Primrose Daycare Center Project
 15 Hamilton Avenue Primrose Daycare Center Project Traffic Impact Analysis Prepared for: Denise Duffy & Associates, Inc. January 16, 215 Hexagon Transportation Consultants, Inc. Hexagon Office: 111 W.
Section 6 Traffic Analysis
 Section 6 Traffic Analysis Traffic Operations of the Preferred Network Alternative After the Preferred Network was identified and confirmed by local policy makers and area residents, detailed traffic analysis
CAPACITY AND LEVEL-OF-SERVICE CONCEPTS
 CHAPTER 2 CAPACITY AND LEVEL-OF-SERVICE CONCEPTS CONTENTS I. INTRODUCTION...2-1 II. CAPACITY...2-2 III. DEMAND...2-2 IV. QUALITY AND LEVELS OF SERVICE...2-2 Service Flow Rates...2-3 Performance Measures...2-3
TRAFFIC IMPACT ANALYSIS HANDBOOK VOLUME I METHODOLOGIES & REQUIREMENTS
 TRAFFIC IMPACT ANALYSIS HANDBOOK VOLUME I METHODOLOGIES & REQUIREMENTS Downtown panoramic photo provided by 1stACT Silicon Valley (blank below this line) Volume I Methodologies and Requirements TABLE OF
Accident Analysis of Sheridan Road between Isabella Street and South Boulevard
 Accident Analysis of Sheridan Road between Isabella Street and South Boulevard Prepared for TranSystems Corporation for the City of Evanston Submitted by Regina Webster & Associates, Inc. Date: 08/15/2008
TRANSPORTATION IMPACT ANALYSIS PROCEDURES MANUAL
 TRANSPORTATION IMPACT ANALYSIS PROCEDURES MANUAL INTRODUCTION The Town of Harrisburg is committed to establishing an interconnected, multimodal transportation system that increases mobility, safety, connectivity,
Goals & Objectives. Chapter 9. Transportation
 Goals & Objectives Chapter 9 Transportation Transportation MISSION STATEMENT: TO PROVIDE A TRANSPORTATION NETWORK CAPABLE OF MOVING PEOPLE AND GOODS EFFICIENTLY AND SAFELY. T he transportation system
Traffic Impact Study for the 3817-45 North Broadway Mixed-Use Development Chicago, Illinois. Prepared by
 Traffic Impact Study for the Chicago, Illinois repared by March 30, 2015 1. Introduction This report summarizes the methodologies, results and findings of a traffic impact study conducted by Kenig, Lindgren,
MEMORANDUM. Robert Nichols, Acting Corridor Design Manager Northgate Link Extension
 MEMORANDUM DATE: September 23, 2014 TO: Robert Nichols, Acting Corridor Design Manager Northgate Link Extension FROM: SUBJECT: COPIES: Katherine Casseday, PE, PTOE, Casseday Consulting Tony Lo, PE, Parsons
APPENDIX J TRAFFIC STUDY
 APPENDIX J TRAFFIC STUDY May 7, 2014 Ms. Leianne Humble Denise Duffy and Associates, Inc. 947 Cass Street, Suite 5 Monterey, CA 93940 Re: Traffic Study for the Heritage Oaks Memorial Park in San Jose,
Lawson Outline Plan External Traffic Analysis Working Paper
 Total Lawson Development ACTPLA 16 January 2009 Document No.: Prepared for ACTPLA Prepared by Maunsell Australia Pty Ltd Level 2, 60 Marcus Clarke Street, Canberra ACT 2600, Australia T +61 2 6201 3000
Mobility Management Plan Study of the Busch Boulevard Corridor
 Mobility Management Plan Study of the Busch Boulevard Corridor March 2000 Hillsborough County Metropolitan Planning Organization 601 E. Kennedy, 18th Floor Tampa, Florida 33602-5117 813/272-5940 FAX NO:
The partnership has selected three intersections where enforcement, education, and engineering initiatives are being implemented to improve safety:
 Hamilton-Finn Suite 310 Tel. (403) 207-6000 Road Safety 3016 5th Avenue N.E. Fax. (403) 273-3440 Consultants Ltd. Calgary, Alberta dawatt.dawatt.com www.hamiltonfinn.ca January 19, 2005 Mr. Don Szarko,
ORANGE COUNTY TRANSPORTATION AUTHORITY. Final Long-Range Transportation Plan - Destination 2035. Attachment A
 ORANGE COUNTY TRANSPORTATION AUTHORITY Final Long-Range Transportation Plan - Destination 2035 Attachment A DESTINATION 2035 DESTINATION 2035 EXECUTIVE SUMMARY ATTACHMENT A Moving Toward a Greener Tomorrow
Transportation Management Plan Template
 DATE: TO: FROM: SUBJECT: Date Name Position Transportation Service Center Name Position Transportation Service Center Transportation Management Plan Job Number(s) Control Section(s) Route Details County
TRAFFIC IMPACT ANALYSIS
 TRANSPORTATION Section 6-1 TRAFFIC IMPACT ANALYSIS The Town Of Buckeye Arizona Engineering Design Standards Section 6-1 Adopted December 2012 TABLE OF CONTENTS 6-1.000 GENERAL INFORMATION:...3 6-1.001
Traffic Volume Counts
 Traffic Volume Counts Prepare 1. Communicate with other staff/departments 2. Review historical data trends 3. Review citizen input 4. Request traffic control Select Location 1. Select the proper location
FHWA Colorado Division Control of Access to the Interstate and its Right-of-Way February 2005
 FHWA Colorado Division Control of Access to the Interstate and its Right-of-Way February 2005 Background: It is in the national interest to maintain the Interstate System to provide the highest level of
0.0 Curb Radii Guidelines Version 1.0.2
 Background In early 2014, Transportation Services initiated a review of the Division's design guidelines and standards to move our organization in a direction consistent with the transportation departments
Transportation Impact Assessment Guidelines
 Transportation Impact Assessment Guidelines Preface The following TIA Guidelines have been developed jointly by the City s Planning and Growth Management and Public Works and Services departments in an
Technical Memorandum PERFORMANCE MEASURES. Prepared by:
 Technical Memorandum PERFORMANCE MEASURES Prepared by: March 2014 TABLE OF CONTENTS Executive Summary... 1 1. Introduction... 2 1.1 Performance Measures and the Public Sector... 2 1.2 National Focus: MAP
Elwood and Joliet, Illinois. June 2015. Village of Elwood. Prepared for:
 Truck Routing Study Elwood and Joliet, Illinois June 2015 Prepared for: Village of Elwood INTRODUCTION Kimley-Horn and Associates, Inc. (Kimley-Horn) was retained by the Village of Elwood to evaluate the
Comment #1: Provide an interchange at Route 7 and Farm Market Road/White Gate Road. This was studied in the late 1990 s.
 Proposed Truck Climbing Lane Route 7 Westbound Between West Market Street and Route 9 UPC# 58599, Project # 6007-053-133, P101 Date of Meeting: August 24, 2010 Time: 6:00PM to 8:00PM Location: Rust Library
Nearly 38,000 vehicles cross the Shinnecock Canal on Sunrise Highway (NYS Route 27) daily, during peak summer months.
 daily, during peak summer months.") 2. Traffic Characteristics Traffic volumes have increased in concert with population growth in the Towns of Southampton and East Hampton. The New York State Department of Transportation (NYSDOT) maintains
2. Traffic Characteristics Traffic volumes have increased in concert with population growth in the Towns of Southampton and East Hampton. The New York State Department of Transportation (NYSDOT) maintains
Advantages and Disadvantages of One Way Streets October 30, 2007
 Advantages and Disadvantages of One Way Streets October 30, 2007 0 P age Background As the revitalization of the Central Waterfront area moves forward, one issue that might need closer analysis is the
TRAFFIC IMPACT ANALYSIS
 TRAFFIC IMPACT ANALYSIS Presenter Gerry Harter, PE, Area Traffic Engineer Acting Transportation and Land Use Director Why a TIA? Roads are a critical public resource and a major investment of public funds
Guidelines for the Preparation of Transportation Impact Studies 8 th Revision
 Guidelines for the Preparation of Transportation Impact Studies 8 th Revision Halifax Regional Municipality Traffic and Right of Way Transportation and Public Works P.O. Box 1749 Halifax, Nova Scotia B3J
A Short Course on Techniques for Determining Construction Related Road User Costs
 TEXAS TRANSPORTATION INSTITUTE A Short Course on Techniques for Determining Construction Related Road User Costs prepared by TEXAS TRANSPORTATION INSTITUTE THE TEXAS A&M UNIVERSITY SYSTEM 701 NORTH POST
Access Management Manual
 Access Management Manual July 2011 2011 by Texas Department of Transportation (512) 302-2453 all rights reserved Manual Notice 2011-1 From: Manual: Mark A Marek, P.E. Access Management Manual Effective
This section summarizes the relevant transportation policies, laws, and regulations that apply to the proposed project.
 6. Transportation 6.1 OVERVIEW This chapter describes the existing transportation conditions in the Southwest Fresno Specific Plan Area. This includes the existing roadway, transit, bicycle, and pedestrian
HERS_IN. HIGHWAY ECONOMIC REQUIREMENTS SYSTEM (for) INDIANA. AASHTO Transportation Estimator Association Conference October 16, 2001
 INDIANA. AASHTO Transportation Estimator Association Conference October 16, 2001") AASHTO Transportation Estimator Association Conference October 16, 2001 HERS_IN HIGHWAY ECONOMIC REQUIREMENTS SYSTEM (for) INDIANA OVERVIEW HERS Background System Planning Tool Development HERS_IN Structure
AASHTO Transportation Estimator Association Conference October 16, 2001 HERS_IN HIGHWAY ECONOMIC REQUIREMENTS SYSTEM (for) INDIANA OVERVIEW HERS Background System Planning Tool Development HERS_IN Structure
Chapter Forty-seven. RURAL TWO-LANE/MULTILANE STATE HIGHWAYS (New Construction/Reconstruction) BUREAU OF DESIGN AND ENVIRONMENT MANUAL
 BUREAU OF DESIGN AND ENVIRONMENT MANUAL") Chapter Forty-seven RURAL TWO-LANE/MULTILANE STATE HIGHWAYS (New Construction/Reconstruction) BUREAU OF DESIGN AND ENVIRONMENT MANUAL Illinois RURAL TWO-LANE/MULTILANE STATE HIGHWAYS December 2009 2 Illinois
Chapter Forty-seven RURAL TWO-LANE/MULTILANE STATE HIGHWAYS (New Construction/Reconstruction) BUREAU OF DESIGN AND ENVIRONMENT MANUAL Illinois RURAL TWO-LANE/MULTILANE STATE HIGHWAYS December 2009 2 Illinois
TRANSPORTATION IMPACT ANALYSIS (TIA) Guidelines
 Guidelines") TRANSPORTATION IMPACT ANALYSIS (TIA) Guidelines Methodology For Development Applications Requiring a TIA in Volusia County, Florida TIA Guidelines As adopted on November 24, 2009 (The Volusia Transportation
TRANSPORTATION IMPACT ANALYSIS (TIA) Guidelines Methodology For Development Applications Requiring a TIA in Volusia County, Florida TIA Guidelines As adopted on November 24, 2009 (The Volusia Transportation
Caledon Transportation Needs Study. Study Report
 Caledon Transportation Needs Study Study Report March 2009 PROJECT SUMMARY PROJECT NAME:...CALEDON TRANSPORTATION NEEDS STUDY UPDATE CLIENT:... THE TOWN OF CALEDON & THE REGIONAL MUNICIPALITY OF PEEL CALEDON
Intersection Cost Comparison Spreadsheet User Manual ROUNDABOUT GUIDANCE VIRGINIA DEPARTMENT OF TRANSPORTATION
 Intersection Cost Comparison Spreadsheet User Manual ROUNDABOUT GUIDANCE VIRGINIA DEPARTMENT OF TRANSPORTATION Version 2.5 i Virginia Department of Transportation Intersection Cost Comparison Spreadsheet
Executive Summary. Transportation Needs CHAPTER. Existing Conditions
 CHAPTER 1 Executive Summary The City of Forest Grove Transportation System Plan (TSP) was updated to keep it consistent with recent growth trends in the city and other transportation planning efforts in
City of Rockville Regional Development Impacts: Transportation Capacity Analysis. June, 2013
 City of Rockville Regional Development Impacts: Transportation Capacity Analysis June, 2013 Purpose and Need Response to Council and Public Evaluate use of more advanced traffic analysis methodology and
Surface Transportation Program (STP) Projects
 Projects") Toledo Metropolitan Area Council of Governments American Reinvestment and Recovery Act (Economic Stimulus Program) Application Packet for: Surface Transportation Program (STP) Projects APPLICATIONS DUE
Toledo Metropolitan Area Council of Governments American Reinvestment and Recovery Act (Economic Stimulus Program) Application Packet for: Surface Transportation Program (STP) Projects APPLICATIONS DUE
Median Bus Lane Design in Vancouver, BC: The #98 B-Line
 Li 1 Median Bus Lane Design in Vancouver, BC: The #98 B-Line Simon Li, P.Eng. PTOE Acting Program Manager, Road and Bridge Projects TransLink (Greater Vancouver Transportation Authority) 1600 4720 Kingsway
Stone Way N Rechannelization: Before and After Study. N 34th Street to N 50th Street
 City of Seattle Department of Transportation Stone Way N Rechannelization: Before and After Study N 34th Street to N 50th Street May, 2010 INTRODUCTION Population density in Seattle is increasing within
Ohio Department of Transportation
 Ohio Department of Transportation Office of Technical Services Ohio Certified Traffic Manual June 2007 Prepared By: Ohio Certified Traffic Manual Table of Contents Chapter 1 Introduction...1 1.1 Purpose
Ohio Standard Small/Medium MPO Travel Demand Forecasting Model. Theoretical Training May 10-11, 2006 Abridged to Freight Focus Sept 2010
 Ohio Standard Small/Medium MPO Travel Demand Forecasting Model Theoretical Training May 10-11, 2006 Abridged to Freight Focus Sept 2010 Model Overview Key Features Modeling of highway and non highway modes
Mercer County Multi-Modal Transportation Plan Year 2025 Travel Demand Model
 Mercer County Multi-Modal Transportation Plan Year 2025 Travel Demand Model Prepared For West Virginia Department of Transportation Transportation Planning Division Building 5, Room 824 1900 Kanawha Blvd.
Traffic Impact Analysis Guidelines
 Updated: January 2014 Traffic Impact Analysis Guidelines B U R E A U O F T R A F F I C O P E R A T I O N S T A B L E O F C O N T E N T S Preface... A1 to A5 Important Notice...B1 Traffic Impact Analysis
Transport Construction Authority Report for Auburn Stabling Project. Traffic Impact Assessment
 Transport Construction Authority Report for Auburn Stabling Project November 2010 Contents 1. Introduction 1 2. Existing Conditions 2 2.1 Site Description 2 2.2 Existing Operations 4 2.3 Existing Road
Downtown Louisville Two-Way Street Study
 Final Draft Report Downtown Louisville Two-Way Street Study Submitted to Downtown Development Corporation Submitted by ENTRAN, PLC Submitted October 2009 Table of Contents Introduction Study Purpose...1
Informational Workshop Public Meeting Kanawha Falls Bridge Project
 Informational Workshop Public Meeting Kanawha Falls Project WV Department of Transportation Division of Highways in Cooperation with the Federal Highway Administration State Project S310-13-0.02 00 Federal
Route Development Plan
 WSDOT Northwest Washington Division, Planning and Policy Office Route Development Plan State Route 99 North/Aurora Avenue North From the North end of the Battery Street Tunnel (Mile Post 32.44) to N. 145th
City of Kamloops Notre Dame Corridor Access Plan
 FINAL REPORT This report is prepared for the sole use of ICBC. No representations of any kind are made by Urban Systems Ltd. or its employees to any party with whom Urban Systems Ltd. does not have a contract.
Massachusetts Department of Transportation, Highway Division Ten Park Plaza, Boston, MA 02116-3973. A Guide on Traffic Analysis Tools
 Massachusetts Department of Transportation, Highway Division Ten Park Plaza, Boston, MA 02116-3973 A Guide on Traffic Tools Revised October 5, 2012 1. PURPOSE The Massachusetts Department of Transportation,
The Need for Traffic Incident Management
 The Need for Traffic Incident Management With traffic incidents responsible for approximately 50-60% of the congestion delays motorists encounter on the nation s roadways every day, increased roadway capacity
Metropolitan Setting l
 Metropolitan Setting l GENERAL CHARACTERISTICS Los Angeles lies at the heart of one of the most complex metropolitan regions in the United States. As a major center of commerce, finance, and industry in
Transportation Impact Analysis and Mitigation Plan Procedures Manual
 Transportation Impact Analysis and Mitigation Plan Procedures Manual February 2011 Table of Contents 1 Overview 1 2 Applicability of Traffic Impact Analysis and Mitigation Requirements 2 21 General Applicability:2
PREFERRED ALTERNATIVE RECOMMENDATION FOR THE COLLEGE AVENUE SAFETY ENHANCEMENT (CASE) PROJECT COLUMBIA, MISSOURI
 PROJECT COLUMBIA, MISSOURI") PREFERRED ALTERNATIVE RECOMMENDATION FOR THE COLLEGE AVENUE SAFETY ENHANCEMENT (CASE) PROJECT COLUMBIA, MISSOURI Prepared For: Columbia Public Works 701 East Broadway Columbia, Missouri Prepared By: Engineering
PREFERRED ALTERNATIVE RECOMMENDATION FOR THE COLLEGE AVENUE SAFETY ENHANCEMENT (CASE) PROJECT COLUMBIA, MISSOURI Prepared For: Columbia Public Works 701 East Broadway Columbia, Missouri Prepared By: Engineering
Measuring the Street:
 Measuring the Street: New Metrics for 21st Century Streets 1 Measuring the Street: New Metrics for 21st Century Streets New York City s streets are constantly called on to the meet new and varied needs
Near Westside Neighborhood and University Avenue Corridor Transportation Study. Public Workshop #2. September 12 and 23, 2013
 Near Westside Neighborhood and University Avenue Corridor Transportation Study Public Workshop #2 September 12 and 23, 2013 Presentation Outline: Brief Review of Study Scope, Background, and Current Conditions
CHAPTER 4 EXISTING TRANSPORTATION MANAGEMENT
 CHAPTER 4 EXISTING TRANSPORTATION MANAGEMENT TRANSPORTATION MANAGEMENT SYSTEMS Prior to 1991, the Missouri Department of Transportation (MoDOT) had begun development of several independent management systems.
Web-Based Work Zone Traffic Analysis Tool Users Guide
 Oregon Department of Transportation TECHNICAL SERVICES TRAFFIC - ROADWAY SECTION TRAFFIC CONTROL PLANS UNIT Web-Based Work Zone Traffic Analysis Tool Users Guide Fall 2010 DATE: April 2010 TO: FROM: Work
5 Performance Measures
 5 Performance Measures This page left blank intentionally. 5 2 Moving Forward Monterey Bay 2035 Introduction The investments identified in the 2035 MTP/SCS are expected to result in significant benefits
Southern California International Gateway Project Description
 Southern California International Gateway Project Description Introduction This Supplemental Notice of Preparation and Initial Study is to inform Responsible, Trustee Agencies, and the public that the
SYSTEMWIDE REQUIREMENTS
 SYSTEMWIDE REQUIREMENTS for the Peninsula Rail Program San Francisco to San Jose on the Caltrain Corridor Description of the Systemwide Context for the High Speed Train Project This document provides a
TECHNIQUES FOR MANUALLY ESTIMATING ROAD USER COSTS ASSOCIATED WITH CONSTRUCTION PROJECTS
 TECHNIQUES FOR MANUALLY ESTIMATING ROAD USER COSTS ASSOCIATED WITH CONSTRUCTION PROJECTS by Ginger Daniels, P.E. Associate Research Engineer Texas Transportation Institute David R. Ellis, Ph.D. Associate
TERMINAL 91 TRAFFIC MONITORING STUDY
 REVISED DRAFT TERMINAL 9 TRAFFIC MONITORING STUDY Prepared for: Port of Seattle Prepared by: 6544 NE 6st Street, Seattle, WA 985 ph: (26) 523-3939 fx: (26) 523-4949 NOVEMBER 22, 2 TABLE OF CONTENTS. INTRODUCTION...
8+ %!0"% 8+1!%"'$%,$"$
 8+ 8+ %!0"% The next step in developing recommendations for improvements to Grand Avenue was to identify, develop and evaluate alternatives to address the issues and needs identified in the previous chapter.
Downtown Tampa Transportation Vision
 Downtown Tampa Transportation Vision Executive Summary August 1, 2006 Hillsborough County Metropolitan Planning Organization County Center, 18 th Floor Tampa, Florida 33602 813-272-5940 www.hillsboroughmpo.org
Draft Transportation Management Plan for Via Verdi Repair Project
 for Via Verdi Repair Project prepared for City of Richmond This report was prepared by: This report was reviewed by: Ryan McClain, P.E. Fehr & Peers TABLE OF CONTENTS 1.0 INTRODUCTION & PROJECT DESCRIPTION...
PROGRAM FOR ARTERIAL SYSTEM SYNCHRONIZATION (PASS) STANDARD SCOPE OF WORK, SCHEDULE AND BUDGET
 STANDARD SCOPE OF WORK, SCHEDULE AND BUDGET") PROGRAM FOR ARTERIAL SYSTEM SYNCHRONIZATION (PASS) STANDARD SCOPE OF WORK, SCHEDULE AND BUDGET The purpose of the Program for Arterial System Synchronization (PASS) is to provide technical and financial
PROGRAM FOR ARTERIAL SYSTEM SYNCHRONIZATION (PASS) STANDARD SCOPE OF WORK, SCHEDULE AND BUDGET The purpose of the Program for Arterial System Synchronization (PASS) is to provide technical and financial
TABLE OF CONTENTS TABLES FIGURES
 TABLE OF CONTENTS Introduction...1 1. On-Site Stacking...2 2. Number of School Driveways...2 3. School Driveway Standards...3 3A. Driveway Spacing...3 3B. Driveway Location...4 3C. Driveway Lane Widths
Temporary Traffic Control for Building and Maintaining Single and Multi-Lane Roundabouts
 Purpose and Background Temporary Traffic Control for Building and Maintaining Single and Multi-Lane Roundabouts Although roundabouts have recently gained popularity and use in the United States, minimal
14-97. 14-97.002 Definitions. For the purposes of this rule chapter the following definitions shall apply unless the context clearly shows otherwise:
 14-97 14-97.001 Purpose. This rule chapter sets forth an access control classification system and access management standards to implement the State Highway System Access Management Act of 1988. The implementation
INDOT 2000-2025 Long Range Plan
 Chapter 9 INDOT 2000-2025 Long Range Plan Highway Needs Analysis Overview The statewide transportation planning process provides for the identification of highway needs through a comprehensive process
2009-3. The Preservation of Local Truck Routes: A Primary Connection between Commerce and the Regional Freight Network
 2009-3 The Preservation of Local Truck Routes: A Primary Connection between Commerce and the Regional Freight Network July 2009 This Goods Movement Challenges and Opportunities Report was prepared jointly
Light Rail Transit in Phoenix
 4. Presentation and Discussion: Phoenix Light Rail Implementation Wulf Grote Planning and Development Director, Phoenix Valley Metro Light Rail Transit in Phoenix Broadway Citizen s Task Force February
Tier 1 Strategies. WV Route 14 Corridor Management Plan
 1.1 1.2 1.3 1.4 Signal timing optimization system improvements. Improve geometry traffic control at high crash intersections. Construct intersection capacity improvement projects. Widen longer sections
Mid-Coast Corridor Transit Project San Diego, California New Starts Project Development (Rating Assigned November 2014)
") Mid-Coast Corridor Transit Project San Diego, California New Starts Project Development (Rating Assigned November 2014) Summary Description Proposed Project: Light Rail Transit 10.9 Miles, 9 Stations Total
Mid-Coast Corridor Transit Project San Diego, California New Starts Project Development (Rating Assigned November 2014) Summary Description Proposed Project: Light Rail Transit 10.9 Miles, 9 Stations Total
Chapter 5. Transportation. Decatur County Comprehensive Plan. Introduction. Goals and Objectives. Goal. Objectives. Goal.
 Chapter 5 Transportation Chapter 5: Transportation Introduction The transportation system forms the backbone of a community. I-74 connects Decatur County with the large metropolitan areas of Cincinnati
TRANSPORTATION SERVICE STANDARDS ELEMENT GOALS, OBJECTIVES & POLICIES
 TRANSPORTATION SERVICE STANDARDS ELEMENT GOALS, OBJECTIVES & POLICIES Background One of the most critical public services provided by a community is the community s transportation system. An effective
Highway 138 Corridor Solutions Study Roseburg, Oregon. Technical Memorandum #4: Concept Development and Screening DRAFT
 Highway 138 Corridor Solutions Study Roseburg, Oregon Technical Memorandum #4: DRAFT Prepared for Oregon Department of Transportation, Region 3 3500 NW Stewart Parkway Roseburg, Oregon 97470 Prepared by
SECTION 6: TRANSPORTATION
 6.0 INTRODUCTION SECTION 6: TRANSPORTATION This section covers the design of the transportation system including but not limited to roadways, lanes, sidewalks and pathways located within road right of
Appendix J Santa Monica Travel Demand Forecasting Model Trip Generation Rates
 Appendix J Santa Monica Travel Demand Forecasting Model Trip Generation Rates SANTA MONICA TRAVEL DEMAND FORECASTING MODEL TRIP GENERATION RATES SUBMITTED BY: 201 Santa Monica Blvd., Suite 500 Santa Monica,
The Northwest Arkansas Travel Demand Model
 The Northwest Arkansas Travel Demand Model Creation and Results John McLarty Northwest Arkansas Regional Planning Commission Cristina Scarlat Center for Advanced Spatial Technologies What is a Travel Demand