Visualisation tools for next-generation sequencing
|
|
|
- Priscilla Turner
- 10 years ago
- Views:
Transcription

1 Visualisation tools for next-generation sequencing Simon Anders EBI is an Outstation of the European Molecular Biology Laboratory.

2 Outline Exploring and checking alignment with alignment viewers Using genome browsers Getting an overview over the whole data with Hilbert curve visualization Displaying peaks alongside feature annotation with the GenomeGraph package

 et al.")
3 Alignment Viewers: SAMtools tview Heng Li (Sanger Institute) et al.

 et al.")
4 Alignment viewers: MaqView Jue Ruan (Beijing Genomics Institute) et al.

5 Alignment Viewer: MapView Hua Bao (Sun Yat-Sen University, Guangzhou) et al.

6 SAMtools pileup format I G G ^:. CCCCC I T T CC?CC I A G GGGGG^:G^:g CCCCCC5 I G G ,^:, CCCCCC1? I T T ,,^:.^:,^:, CCCCCC3A<:; I T T ,,.,, CCCCCC>A@AA I G G ,,.,, CCCACC>A@<A I T T ,,.,, CCCCCC?ACAA I A A ,,.,, CCCCCC>ACAA I A A ,,.,,^:.^:,^:,^:. CCCCCC;ACAAC??C I C C ,,.,,.,,. CCCCCC6<<A?C=9C I C C ,,.,,.,,.^:,^!.^:T CCCCCC>ACA?C=AC< I A A ,,.,,.,,.,.. CCCCCC>ACAACAACA I A A ,,.,,.,,.,.G CCCCCC?ACAA@A?CA Fields: chromosome, position, reference base, consensus base, consensus quality, SNP quality, maximum mapping quality, coverage, base pile-up, base quality pile-up


7 Coverage vectors <-- Solexa reads, aligned to genome <-- coverage vector Figure taken from Zhang et al., PLoS Comp. Biol. 2008

8 Coverage vectors A coverage vector (or "pile-up" vector) is an integer vector with on element per base pair in a chromosome, tallying the number of reads (or fragments) mapping onto each base pair. It is the essential intermediate data type in assays like ChIPSeq or RNA-Seq Visualising coverage vectors is non-trivial, but essential for quality control hypothesis forming etc.

9 Example: Histone modifications Barski et al. (Cell, 2007) have studied histone modification in the human genome with ChIP-Seq I use their data for H3K4me1 and H3K4me3 as example data. (Each data set is from two or three Solexa lanes)

10 H3K4me3 H3K4me1 Coverage vector for a full chromosome (chr10)

11 H3K4me3 H3K4me1 Zoom in

12 Genome browser tracks Tracks may contain Features (intervals with name) without score with score vectors (continuously varying score) Standard formats for genome browser tracks BED GFF Wiggle fixedstep and variablestep

13 Displaying tracks alongside annotation Either, upload your track file to a web-base browser UCSC genome browse Ensembl genome browser or use a stand-alone browser on your desktop computer Integrated Genome Browser (IGB) [Genoviz] Argo Genome Browser [Broad Institute] Artemis [Sanger Institute] Displaying large amounts of data requires patience and lots of RAM. Not all tools handle it well.
![Integrated Genome Browser (IGB) [Genoviz] Argo Genome Browser [Broad Institute] Artemis [Sanger](/docs-images/40/13242860/images/page_13.jpg "Institute] Displaying large amounts of data requires patience and lots of RAM.")

14 IGB

15 rtracklayer rtracklayer: Bioconductor package by M. Lawrence (FHCRC) import and export BED, Wiggle, and GFF files manipulate track data and get sub-views directly interact with a genome browser (UCSC or Argo) to drive displaying of track data
 to drive")
16 Difference between the track formats Formats for feature-by-feature data: BED GFF Formats for base-by-base scores Wiggle BedGraph Wiggle has three sub-types: [BED-like] variablestep fixedstep

17 Wiggle format: variablestep and fixedstep browser position chr19: browser hide all track type=wiggle_0 name="varsteptrack" description="varstep example" \ visibility=full autoscale=off viewlimits=0.0:25.0 color=50,150,255 \ ylinemark=11.76 ylineonoff=on priority=10 variablestep chrom=chr19 span= track type=wiggle_0 name="fixedsteptrack" description="fixedstep examle" fixedstep chrom=chr19 start= step=300 span= All coordinates 1-based!

18 bedgraph format track type=bedgraph name="bedgraph Track" chr chr chr chr chr chr chr chr chr All coordinates 0-based, half-open! Specs: See UCSC Genome Browser web site

19 H3K4me3 H3K4me 1 H3K4me1 Back to the bird's eyes view

20 We need a way to get a general overview on the data without either not seeing any details not getting lost in them. A possible solution: Hilbert curve visualisation S. An.: Visualisation of genomic data with the Hilbert curve, Bioinformatics, Vol. 25 (2009) pp

21 The Hilbert curve
22 What is hidden in here?
23 Hilbert plot of the constructed example vector
24 Construction of the Hilbert curve: Level 1
25 Construction of the Hilbert curve: Level 2
26 Construction of the Hilbert curve: Level 3
27 Construction of the Hilbert curve: Level 4

28 Hilbert curve: Approaching the limit
29 H3K4me1 Coverage vector for a full chromosome (chr10) H3K4me3 chrom. 10
30 Hilbert plot of the coverage vectors H3K4me1 (mono-methylation) H3K4me3 (tri-methylation)
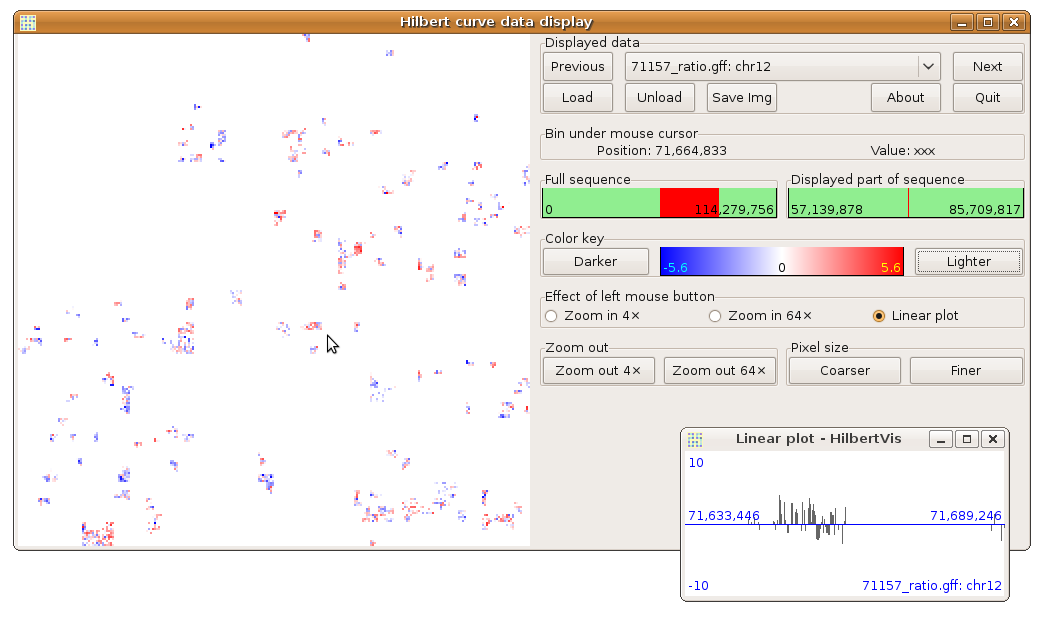
31 HilbertVis
32 HilbertVis stand-alone tool to display GFF, Wiggle, Maq map ( or Google for hilbertvis ) R package to display any long R vector either via commands for batch processing Bioconductor package HilbertVis or via GUI for exploring Bioconductor package HilbertVisGUI

33 Three-colour Hilbert plot Overlay of the previous plots and exon density red: mono-methylation green: tri-methylation blue: exons

34 Other uses: Array-CGH Log fold-changes between two Arabidopsis eco-types, chromosome 2 [Data courtesy of M. Seiffert, IPK Gatersleben

35 Other uses: Conservation scores Human chromosome 10: Comparing phastcons conservation scores with exon density

36 GenomeGraphs GenomeGraphs: Bioconductor package by S. Durrinck, UCB Load gene models from Ensembl via BiomaRt and plots them, alongside experimental data
37 GenomeGraphs: Code for sample plot library(genomegraphs) library(hilbertvis) mart < usemart("ensembl", dataset = "mmusculus_gene_ensembl") start < end < plusstrand < makegeneregion( chromosome = 10, start = start, end = end, strand = "+", biomart = mart ) minusstrand < makegeneregion( chromosome = 10, start = start, end = end, strand = " ", biomart = mart ) genomeaxis < makegenomeaxis( )
38 GenomeGraphs: Code for sample plot, cont'd track.ctcf < makebasetrack( base = seq( start, end, length.out = ), value = shrinkvector( as.vector( cov.ctcf$chr10[start:end] ), ), dp = DisplayPars( lwd = 0.5, color="red", ylim=c(0, 50) ) ) track.gfp < makebasetrack( base = seq( start, end, length.out = ), value = shrinkvector( as.vector( cov.gfp$chr10[start:end] ), ), dp = DisplayPars( lwd = 0.5, color="blue", ylim=c(0, 50) ) ) gdplot( list( `plus`=plusstrand, `CTCF`=track.ctcf, genomeaxis, `GFP`=track.gfp, `minus`=minusstrand ) )
39 *
Analysis of ChIP-seq data in Galaxy
 Analysis of ChIP-seq data in Galaxy November, 2012 Local copy: https://galaxy.wi.mit.edu/ Joint project between BaRC and IT Main site: http://main.g2.bx.psu.edu/ 1 Font Conventions Bold and blue refers
Fast. Integrated Genome Browser & DAS. Easy. Flexible. Free. bioviz.org/igb
 bioviz.org/igb Integrated Genome Browser & DAS Free tools for visualizing, sharing, and publishing genomes and genome-scale data. Easy Flexible Fast Free Funding: National Science Foundation Arabidopsis
GeneProf and the new GeneProf Web Services
 GeneProf and the new GeneProf Web Services Florian Halbritter [email protected] Stem Cell Bioinformatics Group (Simon R. Tomlinson) [email protected] December 10, 2012 Florian Halbritter
Introduction. Overview of Bioconductor packages for short read analysis
 Overview of Bioconductor packages for short read analysis Introduction General introduction SRAdb Pseudo code (Shortread) Short overview of some packages Quality assessment Example sequencing data in Bioconductor
GMQL Functional Comparison with BEDTools and BEDOPS
 GMQL Functional Comparison with BEDTools and BEDOPS Genomic Computing Group Dipartimento di Elettronica, Informazione e Bioingegneria Politecnico di Milano This document presents a functional comparison
Basic processing of next-generation sequencing (NGS) data
 data") Basic processing of next-generation sequencing (NGS) data Getting from raw sequence data to expression analysis! 1 Reminder: we are measuring expression of protein coding genes by transcript abundance
Basic processing of next-generation sequencing (NGS) data Getting from raw sequence data to expression analysis! 1 Reminder: we are measuring expression of protein coding genes by transcript abundance
Shouguo Gao Ph. D Department of Physics and Comprehensive Diabetes Center
 Computational Challenges in Storage, Analysis and Interpretation of Next-Generation Sequencing Data Shouguo Gao Ph. D Department of Physics and Comprehensive Diabetes Center Next Generation Sequencing
LifeScope Genomic Analysis Software 2.5
 USER GUIDE LifeScope Genomic Analysis Software 2.5 Graphical User Interface DATA ANALYSIS METHODS AND INTERPRETATION Publication Part Number 4471877 Rev. A Revision Date November 2011 For Research Use
Version 5.0 Release Notes
 Version 5.0 Release Notes 2011 Gene Codes Corporation Gene Codes Corporation 775 Technology Drive, Ann Arbor, MI 48108 USA 1.800.497.4939 (USA) +1.734.769.7249 (elsewhere) +1.734.769.7074 (fax) www.genecodes.com
Comparing Methods for Identifying Transcription Factor Target Genes
 Comparing Methods for Identifying Transcription Factor Target Genes Alena van Bömmel (R 3.3.73) Matthew Huska (R 3.3.18) Max Planck Institute for Molecular Genetics Folie 1 Transcriptional Regulation TF
-> Integration of MAPHiTS in Galaxy
 Enabling NGS Analysis with(out) the Infrastructure, 12:0512 Development of a workflow for SNPs detection in grapevine From Sets to Graphs: Towards a Realistic Enrichment Analy species: MAPHiTS -> Integration
RETRIEVING SEQUENCE INFORMATION. Nucleotide sequence databases. Database search. Sequence alignment and comparison
 RETRIEVING SEQUENCE INFORMATION Nucleotide sequence databases Database search Sequence alignment and comparison Biological sequence databases Originally just a storage place for sequences. Currently the
Cloud-Based Big Data Analytics in Bioinformatics
 Cloud-Based Big Data Analytics in Bioinformatics Presented By Cephas Mawere Harare Institute of Technology, Zimbabwe 1 Introduction 2 Big Data Analytics Big Data are a collection of data sets so large
Using Galaxy for NGS Analysis. Daniel Blankenberg Postdoctoral Research Associate The Galaxy Team http://usegalaxy.org
 Using Galaxy for NGS Analysis Daniel Blankenberg Postdoctoral Research Associate The Galaxy Team http://usegalaxy.org Overview NGS Data Galaxy tools for NGS Data Galaxy for Sequencing Facilities Overview
Tutorial for Windows and Macintosh. Preparing Your Data for NGS Alignment
 Tutorial for Windows and Macintosh Preparing Your Data for NGS Alignment 2015 Gene Codes Corporation Gene Codes Corporation 775 Technology Drive, Ann Arbor, MI 48108 USA 1.800.497.4939 (USA) 1.734.769.7249
FlipFlop: Fast Lasso-based Isoform Prediction as a Flow Problem
 FlipFlop: Fast Lasso-based Isoform Prediction as a Flow Problem Elsa Bernard Laurent Jacob Julien Mairal Jean-Philippe Vert September 24, 2013 Abstract FlipFlop implements a fast method for de novo transcript
When you install Mascot, it includes a copy of the Swiss-Prot protein database. However, it is almost certain that you and your colleagues will want
 1 When you install Mascot, it includes a copy of the Swiss-Prot protein database. However, it is almost certain that you and your colleagues will want to search other databases as well. There are very
org.rn.eg.db December 16, 2015 org.rn.egaccnum is an R object that contains mappings between Entrez Gene identifiers and GenBank accession numbers.
 org.rn.eg.db December 16, 2015 org.rn.egaccnum Map Entrez Gene identifiers to GenBank Accession Numbers org.rn.egaccnum is an R object that contains mappings between Entrez Gene identifiers and GenBank
Simplifying Data Interpretation with Nexus Copy Number
 Simplifying Data Interpretation with Nexus Copy Number A WHITE PAPER FROM BIODISCOVERY, INC. Rapid technological advancements, such as high-density acgh and SNP arrays as well as next-generation sequencing
The Segway annotation of ENCODE data
 The Segway annotation of ENCODE data Michael M. Hoffman Department of Genome Sciences University of Washington Overview 1. ENCODE Project 2. Semi-automated genomic annotation 3. Chromatin 4. RNA-seq Functional
UGENE Quick Start Guide
 Quick Start Guide This document contains a quick introduction to UGENE. For more detailed information, you can find the UGENE User Manual and other special manuals in project website: http://ugene.unipro.ru.
Module 1. Sequence Formats and Retrieval. Charles Steward
 The Open Door Workshop Module 1 Sequence Formats and Retrieval Charles Steward 1 Aims Acquaint you with different file formats and associated annotations. Introduce different nucleotide and protein databases.
How Sequencing Experiments Fail
 How Sequencing Experiments Fail v1.0 Simon Andrews [email protected] Classes of Failure Technical Tracking Library Contamination Biological Interpretation Something went wrong with a machine
Genome Viewing. Module 2. Using Genome Browsers to View Annotation of the Human Genome
 Module 2 Genome Viewing Using Genome Browsers to View Annotation of the Human Genome Bert Overduin, Ph.D. PANDA Coordination & Outreach EMBL - European Bioinformatics Institute Wellcome Trust Genome Campus
Analysis and Integration of Big Data from Next-Generation Genomics, Epigenomics, and Transcriptomics
 Analysis and Integration of Big Data from Next-Generation Genomics, Epigenomics, and Transcriptomics Christopher Benner, PhD Director, Integrative Genomics and Bioinformatics Core (IGC) idash Webinar,
Next Generation Sequencing: Technology, Mapping, and Analysis
 Next Generation Sequencing: Technology, Mapping, and Analysis Gary Benson Computer Science, Biology, Bioinformatics Boston University [email protected] http://tandem.bu.edu/ The Human Genome Project took
NGS Data Analysis: An Intro to RNA-Seq
 NGS Data Analysis: An Intro to RNA-Seq March 25th, 2014 GST Colloquim: March 25th, 2014 1 / 1 Workshop Design Basics of NGS Sample Prep RNA-Seq Analysis GST Colloquim: March 25th, 2014 2 / 1 Experimental
RNAseq / ChipSeq / Methylseq and personalized genomics
 RNAseq / ChipSeq / Methylseq and personalized genomics 7711 Lecture Subhajyo) De, PhD Division of Biomedical Informa)cs and Personalized Biomedicine, Department of Medicine University of Colorado School
IGV Hands-on Exercise: UI basics and data integration
 IGV Hands-on Exercise: UI basics and data integration Verhaak, R.G. et al. Integrated Genomic Analysis Identifies Clinically Relevant Subtypes of Glioblastoma Characterized by Abnormalities in PDGFRA,
IRanges, GenomicRanges, and Biostrings
 IRanges, GenomicRanges, and Biostrings Bioconductor Infrastructure Packages for Sequence Analysis Patrick Aboyoun Fred Hutchinson Cancer Research Center 7-9 June, 2010 Outline Introduction Genomic Intervals
Running a Bioinformatics Help Desk. Solved and Unsolved Problems
 2012/07/16 Running a Bioinformatics Help Desk from drawing colorful plasmid maps to working with HiSeq data Solved and Unsolved Problems Hans-Rudolf Hotz ( [email protected] ) Friedrich Miescher Institute for
Gene Models & Bed format: What they represent.
 GeneModels&Bedformat:Whattheyrepresent. Gene models are hypotheses about the structure of transcripts produced by a gene. Like all models, they may be correct, partly correct, or entirely wrong. Typically,
Nebula A web-server for advanced ChIP-seq data analysis. Tutorial. by Valentina BOEVA
 Nebula A web-server for advanced ChIP-seq data analysis Tutorial by Valentina BOEVA Content Upload data to the history pp. 5-6 Check read number and sequencing quality pp. 7-9 Visualize.BAM files in UCSC
Chapter 2. imapper: A web server for the automated analysis and mapping of insertional mutagenesis sequence data against Ensembl genomes
 Chapter 2. imapper: A web server for the automated analysis and mapping of insertional mutagenesis sequence data against Ensembl genomes 2.1 Introduction Large-scale insertional mutagenesis screening in
Searching Nucleotide Databases
 Searching Nucleotide Databases 1 When we search a nucleic acid databases, Mascot always performs a 6 frame translation on the fly. That is, 3 reading frames from the forward strand and 3 reading frames
Installation Guide for Windows
 Installation Guide for Windows Overview: Getting Ready Installing Sequencher Activating and Installing the License Registering Sequencher GETTING READY Trying Sequencher: Sequencher 5.2 and newer requires
IGV User Guide. User Interface Main Window. This guide describes the Integrative Genomics Viewer (IGV).
.") IGV User Guide This guide describes the Integrative Genomics Viewer (IGV). To start IGV, go to the IGV downloads page: http://www.broadinstitute.org/igv/download. Look at a printer-friendly HTML version
IGV User Guide This guide describes the Integrative Genomics Viewer (IGV). To start IGV, go to the IGV downloads page: http://www.broadinstitute.org/igv/download. Look at a printer-friendly HTML version
8/7/2012. Experimental Design & Intro to NGS Data Analysis. Examples. Agenda. Shoe Example. Breast Cancer Example. Rat Example (Experimental Design)
") Experimental Design & Intro to NGS Data Analysis Ryan Peters Field Application Specialist Partek, Incorporated Agenda Experimental Design Examples ANOVA What assays are possible? NGS Analytical Process
Experimental Design & Intro to NGS Data Analysis Ryan Peters Field Application Specialist Partek, Incorporated Agenda Experimental Design Examples ANOVA What assays are possible? NGS Analytical Process
BIOL 3200 Spring 2015 DNA Subway and RNA-Seq Data Analysis
 BIOL 3200 Spring 2015 DNA Subway and RNA-Seq Data Analysis By the end of this lab students should be able to: Describe the uses for each line of the DNA subway program (Red/Yellow/Blue/Green) Describe
4.2.1. What is a contig? 4.2.2. What are the contig assembly programs?
 Table of Contents 4.1. DNA Sequencing 4.1.1. Trace Viewer in GCG SeqLab Table. Box. Select the editor mode in the SeqLab main window. Import sequencer trace files from the File menu. Select the trace files
Next generation sequencing (NGS)
") Next generation sequencing (NGS) Vijayachitra Modhukur BIIT [email protected] 1 Bioinformatics course 11/13/12 Sequencing 2 Bioinformatics course 11/13/12 Microarrays vs NGS Sequences do not need to be known
Next generation sequencing (NGS) Vijayachitra Modhukur BIIT [email protected] 1 Bioinformatics course 11/13/12 Sequencing 2 Bioinformatics course 11/13/12 Microarrays vs NGS Sequences do not need to be known
FlipFlop: Fast Lasso-based Isoform Prediction as a Flow Problem
 FlipFlop: Fast Lasso-based Isoform Prediction as a Flow Problem Elsa Bernard Laurent Jacob Julien Mairal Jean-Philippe Vert May 3, 2016 Abstract FlipFlop implements a fast method for de novo transcript
BioHPC Web Computing Resources at CBSU
 BioHPC Web Computing Resources at CBSU 3CPG workshop Robert Bukowski Computational Biology Service Unit http://cbsu.tc.cornell.edu/lab/doc/biohpc_web_tutorial.pdf BioHPC infrastructure at CBSU BioHPC Web
Challenges associated with analysis and storage of NGS data
 Challenges associated with analysis and storage of NGS data Gabriella Rustici Research and training coordinator Functional Genomics Group [email protected] Next-generation sequencing Next-generation sequencing
AGILENT S BIOINFORMATICS ANALYSIS SOFTWARE
 ACCELERATING PROGRESS IS IN OUR GENES AGILENT S BIOINFORMATICS ANALYSIS SOFTWARE GENESPRING GENE EXPRESSION (GX) MASS PROFILER PROFESSIONAL (MPP) PATHWAY ARCHITECT (PA) See Deeper. Reach Further. BIOINFORMATICS
Computational Genomics. Next generation sequencing (NGS)
") Computational Genomics Next generation sequencing (NGS) Sequencing technology defies Moore s law Nature Methods 2011 Log 10 (price) Sequencing the Human Genome 2001: Human Genome Project 2.7G$, 11 years
Computational Genomics Next generation sequencing (NGS) Sequencing technology defies Moore s law Nature Methods 2011 Log 10 (price) Sequencing the Human Genome 2001: Human Genome Project 2.7G$, 11 years
GeneSifter: Next Generation Data Management and Analysis for Next Generation Sequencing
 for Next Generation Sequencing Dale Baskin, N. Eric Olson, Laura Lucas, Todd Smith 1 Abstract Next generation sequencing technology is rapidly changing the way laboratories and researchers approach the
Accessing the 1000 Genomes Data. Paul Flicek European BioinformaMcs InsMtute
 Accessing the 1000 Genomes Data Paul Flicek European BioinformaMcs InsMtute Data access General informamon File access 1000 Genomes Browser Tools Where to find help www.1000genomes.org www.1000genomes.org
Frequently Asked Questions Next Generation Sequencing
 Frequently Asked Questions Next Generation Sequencing Import These Frequently Asked Questions for Next Generation Sequencing are some of the more common questions our customers ask. Questions are divided
What s New in Pathway Studio Web 11.1
 1 1 What s New in Pathway Studio Web 11.1 Elseiver is pleased to announce the release of Pathway Studio Web 11.1 for all database subscriptions (Mammal, Mammal+ChemEffect+DiseaseFx, Plant). This release
Next Generation Sequencing: Adjusting to Big Data. Daniel Nicorici, Dr.Tech. Statistikot Suomen Lääketeollisuudessa 29.10.2013
 Next Generation Sequencing: Adjusting to Big Data Daniel Nicorici, Dr.Tech. Statistikot Suomen Lääketeollisuudessa 29.10.2013 Outline Human Genome Project Next-Generation Sequencing Personalized Medicine
Course: Visual Analytics of largescale biological data. Kay Nieselt Center for Bioinformatics Tübingen University of Tübingen
 Course: Visual Analytics of largescale biological data Kay Nieselt Center for Bioinformatics Tübingen University of Tübingen FUNDAMENTALS OF BIOLOGICAL DATA VISUALISATION 2 Presentation of known facts
Building Bioinformatics Capacity in Africa. Nicky Mulder CBIO Group, UCT
 Building Bioinformatics Capacity in Africa Nicky Mulder CBIO Group, UCT Outline What is bioinformatics? Why do we need IT infrastructure? What e-infrastructure does it require? How we are developing this
SICKLE CELL ANEMIA & THE HEMOGLOBIN GENE TEACHER S GUIDE
 AP Biology Date SICKLE CELL ANEMIA & THE HEMOGLOBIN GENE TEACHER S GUIDE LEARNING OBJECTIVES Students will gain an appreciation of the physical effects of sickle cell anemia, its prevalence in the population,
Introduction to transcriptome analysis using High Throughput Sequencing technologies (HTS)
") Introduction to transcriptome analysis using High Throughput Sequencing technologies (HTS) A typical RNA Seq experiment Library construction Protocol variations Fragmentation methods RNA: nebulization,
Introduction to transcriptome analysis using High Throughput Sequencing technologies (HTS) A typical RNA Seq experiment Library construction Protocol variations Fragmentation methods RNA: nebulization,
RNA Express. Introduction 3 Run RNA Express 4 RNA Express App Output 6 RNA Express Workflow 12 Technical Assistance
 RNA Express Introduction 3 Run RNA Express 4 RNA Express App Output 6 RNA Express Workflow 12 Technical Assistance ILLUMINA PROPRIETARY 15052918 Rev. A February 2014 This document and its contents are
Scalable Cloud Computing Solutions for Next Generation Sequencing Data
 Scalable Cloud Computing Solutions for Next Generation Sequencing Data Matti Niemenmaa 1, Aleksi Kallio 2, André Schumacher 1, Petri Klemelä 2, Eija Korpelainen 2, and Keijo Heljanko 1 1 Department of
Subread/Rsubread Users Guide
 Subread/Rsubread Users Guide Subread v1.5.0-p1/rsubread v1.20.3 1 February 2016 Wei Shi and Yang Liao Bioinformatics Division The Walter and Eliza Hall Institute of Medical Research The University of Melbourne
GenomeStudio Data Analysis Software
 GenomeStudio Analysis Software Illumina has created a comprehensive suite of data analysis tools to support a wide range of genetic analysis assays. This single software package provides data visualization
Analysis of FFPE DNA Data in CNAG 2.0 A Manual
 Analysis of FFPE DNA Data in CNAG 2.0 A Manual Table of Contents: I. Background P.2 II. Installation and Setup a. Download/Install CNAG 2.0 P.3 b. Setup P.4 III. Extract Mapping 500K FFPE Data P.7 IV.
Tutorial for proteome data analysis using the Perseus software platform
 Tutorial for proteome data analysis using the Perseus software platform Laboratory of Mass Spectrometry, LNBio, CNPEM Tutorial version 1.0, January 2014. Note: This tutorial was written based on the information
Description: Molecular Biology Services and DNA Sequencing
 Description: Molecular Biology s and DNA Sequencing DNA Sequencing s Single Pass Sequencing Sequence data only, for plasmids or PCR products Plasmid DNA or PCR products Plasmid DNA: 20 100 ng/μl PCR Product:
BIOINF 525 Winter 2016 Foundations of Bioinformatics and Systems Biology http://tinyurl.com/bioinf525-w16
 Course Director: Dr. Barry Grant (DCM&B, [email protected]) Description: This is a three module course covering (1) Foundations of Bioinformatics, (2) Statistics in Bioinformatics, and (3) Systems
GenomeStudio Data Analysis Software
 GenomeStudio Data Analysis Software Illumina has created a comprehensive suite of data analysis tools to support a wide range of genetic analysis assays. This single software package provides data visualization
Module 3. Genome Browsing. Using Web Browsers to View Genome Annota4on. Kers4n Howe Wellcome Trust Sanger Ins4tute zfish- [email protected].
 Module 3 Genome Browsing Using Web Browsers to View Genome Annota4on Kers4n Howe Wellcome Trust Sanger Ins4tute zfish- [email protected] Introduc.on Genome browsing The Ensembl gene set Guided examples
NaviCell Data Visualization Python API
 NaviCell Data Visualization Python API Tutorial - Version 1.0 The NaviCell Data Visualization Python API is a Python module that let computational biologists write programs to interact with the molecular
Bioinformatics Resources at a Glance
 Bioinformatics Resources at a Glance A Note about FASTA Format There are MANY free bioinformatics tools available online. Bioinformaticists have developed a standard format for nucleotide and protein sequences
Data Analysis & Management of High-throughput Sequencing Data. Quoclinh Nguyen Research Informatics Genomics Core / Medical Research Institute
 Data Analysis & Management of High-throughput Sequencing Data Quoclinh Nguyen Research Informatics Genomics Core / Medical Research Institute Current Issues Current Issues The QSEQ file Number files per
GAIA: Genomic Analysis of Important Aberrations
 GAIA: Genomic Analysis of Important Aberrations Sandro Morganella Stefano Maria Pagnotta Michele Ceccarelli Contents 1 Overview 1 2 Installation 2 3 Package Dependencies 2 4 Vega Data Description 2 4.1
Guide for Data Visualization and Analysis using ACSN
 Guide for Data Visualization and Analysis using ACSN ACSN contains the NaviCell tool box, the intuitive and user- friendly environment for data visualization and analysis. The tool is accessible from the
Exercises for the UCSC Genome Browser Introduction
 Exercises for the UCSC Genome Browser Introduction 1) Find out if the mouse Brca1 gene has non-synonymous SNPs, color them blue, and get external data about a codon-changing SNP. Skills: basic text search;
New Technologies for Sensitive, Low-Input RNA-Seq. Clontech Laboratories, Inc.
 New Technologies for Sensitive, Low-Input RNA-Seq Clontech Laboratories, Inc. Outline Introduction Single-Cell-Capable mrna-seq Using SMART Technology SMARTer Ultra Low RNA Kit for the Fluidigm C 1 System
IV3Dm provides global settings which can be set prior to launching the application and are available through the device settings menu.
 ImageVis3D Mobile This software can be used to display and interact with different kinds of datasets - such as volumes or meshes - on mobile devices, which currently includes iphone and ipad. A selection
Exercise with Gene Ontology - Cytoscape - BiNGO
 Exercise with Gene Ontology - Cytoscape - BiNGO This practical has material extracted from http://www.cbs.dtu.dk/chipcourse/exercises/ex_go/goexercise11.php In this exercise we will analyze microarray
Go where the biology takes you. Genome Analyzer IIx Genome Analyzer IIe
 Go where the biology takes you. Genome Analyzer IIx Genome Analyzer IIe Go where the biology takes you. To published results faster With proven scalability To the forefront of discovery To limitless applications
An example of bioinformatics application on plant breeding projects in Rijk Zwaan
 An example of bioinformatics application on plant breeding projects in Rijk Zwaan Xiangyu Rao 17-08-2012 Introduction of RZ Rijk Zwaan is active worldwide as a vegetable breeding company that focuses on
BlueFuse Multi Analysis Software for Molecular Cytogenetics
 BlueFuse Multi Analysis Software for Molecular Cytogenetics A powerful software package designed to detect and display areas of potential chromosomal abnormality within the genome. Highlights Seamless
Compass Software for Peggy User Guide
 page 1 Compass Software for Peggy User Guide Copyright 2013 ProteinSimple. All rights reserved. ProteinSimple 3040 Oakmead Village Drive Santa Clara, CA 95051 Toll-free: (888) 607-9692 Tel: (408) 510-5500
Normalization of RNA-Seq
 Normalization of RNA-Seq Davide Risso Modified: April 27, 2012. Compiled: April 27, 2012 1 Retrieving the data Usually, an RNA-Seq data analysis from scratch starts with a set of FASTQ files (see e.g.
Replacing TaqMan SNP Genotyping Assays that Fail Applied Biosystems Manufacturing Quality Control. Begin
 User Bulletin TaqMan SNP Genotyping Assays May 2008 SUBJECT: Replacing TaqMan SNP Genotyping Assays that Fail Applied Biosystems Manufacturing Quality Control In This Bulletin Overview This user bulletin
Notice. DNA Sequencing Module User Guide
 GenomeStudio TM DNA Sequencing Module v1.0 User Guide An Integrated Platform for Data Visualization and Analysis FOR RESEARCH ONLY DS ILLUMINA PROPRIETARY Part # 11319092, Rev. A Notice This publication
Linking the Epigenome to the Genome: Correlation of Different Features to DNA Methylation of CpG Islands
 Linking the Epigenome to the Genome: Correlation of Different Features to DNA Methylation of CpG Islands Clemens Wrzodek*, Finja Büchel, Georg Hinselmann, Johannes Eichner, Florian Mittag, Andreas Zell
The University is comprised of seven colleges and offers 19. including more than 5000 graduate students.
 UNC CHARLOTTE A doctoral, research-intensive university, UNC Charlotte is the largest institution of higher education in the Charlotte region. The University is comprised of seven colleges and offers 19
Nazneen Aziz, PhD. Director, Molecular Medicine Transformation Program Office
 2013 Laboratory Accreditation Program Audioconferences and Webinars Implementing Next Generation Sequencing (NGS) as a Clinical Tool in the Laboratory Nazneen Aziz, PhD Director, Molecular Medicine Transformation
How To Import Credit Card Charges Into Concur
 Importing Credit Card Expenses into Concur For faster expense reporting and less manual data entry, try importing your credit card charges into Concur. Step 1: Download Credit Card Data Log onto your credit
Gene Expression Analysis
 Gene Expression Analysis Jie Peng Department of Statistics University of California, Davis May 2012 RNA expression technologies High-throughput technologies to measure the expression levels of thousands
CloudMap: A Cloud-based Pipeline for Analysis of Mutant Genome Sequences
 Genetics: Advance Online Publication, published on October 10, 2012 as 10.1534/genetics.112.144204 CloudMap: A Cloud-based Pipeline for Analysis of Mutant Genome Sequences Gregory Minevich 1,, Danny S.
G E N OM I C S S E RV I C ES
 GENOMICS SERVICES THE NEW YORK GENOME CENTER NYGC is an independent non-profit implementing advanced genomic research to improve diagnosis and treatment of serious diseases. capabilities. N E X T- G E