AP Statistics Hoxmeier Tests about Population Mean
|
|
|
- Kerrie Sutton
- 9 years ago
- Views:
Transcription
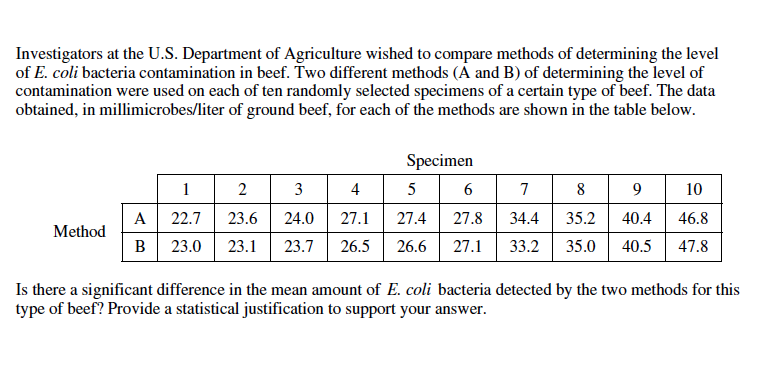
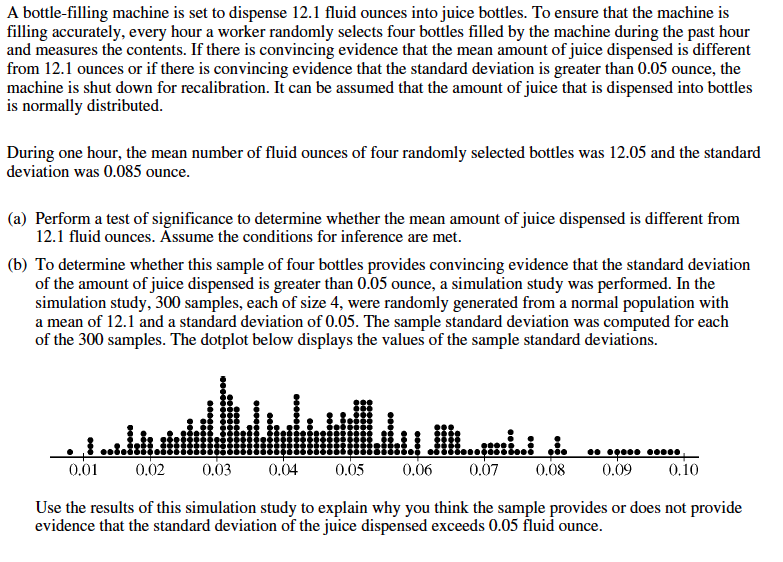
1 AP Statistics Hoxmeier Tests about Population Mean Name: 1. An inventor has developed a new, energy-efficient lawn mower engine. He claims that the engine will run continuously for 5 hours (300 minutes) on a single gallon of regular gasoline. Suppose a simple random sample of 50 engines is tested. The engines run for an average of 295 minutes, with a standard deviation of 20 minutes. Test the null hypothesis that the mean run time is 300 minutes against the alternative hypothesis that the mean run time is not 300 minutes. Use a 0.05 level of significance. (Assume that run times for the population of engines are normally distributed.) 2. A local chamber of commerce claims that the mean family income in a city is $12,250. An economist suspects otherwise and runs a hypothesis test using a sample of 135 families and finds a mean of $11,500 with a standard deviation of $3,180. Should the $12,250 claim be rejected at a 5% level?
2 3. The P-Value for a two sided test of the null hypothesis H o : µ = 10 is 0.06 a) Does the 95% confidence interval for the mean include 10? Why or why not? b) Does the 90% confidence interval for the mean include 10? Why or why not? 4. The P-Value for a two sided test of the null hypothesis H o : µ = 15 is 0.03 a) Does the 99% confidence interval for the mean include 15? Why or why not? b) Does the 95% confidence interval for the mean include 15? Why or why not? 5. A 95% confidence interval for µ is calculated to be (1.7, 3.5). It is now decided to test the hypothesis H 0 : µ = 0 versus H a : µ 0 at the α = 0.05 level, using the same data as used to construct the confidence interval. (a) We cannot test the hypothesis without the original data. (b) We cannot test the hypothesis at the α = 0.05 level since the α = 0.05 test is connected to the 97.5% confidence interval. (c) We can make the connection between hypothesis tests and confidence intervals only if the sample sizes are large. (d) We would reject H 0 at level α = (e) We would accept H 0 at level α = An appropriate 95% confidence interval for µ has been calculated as ( 0.73, 1.92 ) based on n = 15 observations from a population with a Normal distribution. The hypotheses of interest are H 0 : µ = 0 versus H a : µ 0. Based on this confidence interval, (a) we should reject H 0 at the α = 0.05 level of significance. (b) we should not reject H 0 at the α = 0.05 level of significance. (c) we should reject H 0 at the α = 0.10 level of significance. (d) we should not reject H 0 at the α = 0.10 level of significance. (e) we cannot perform the required test since we do not know the value of the test statistic. 7. A certain population follows a Normal distribution with mean µ and standard deviation σ = 2.5. You collect data and test the hypotheses H 0 : µ = 1, H a : µ 1 You obtain a P-value of Which of the following is true? (a) A 95% confidence interval for µ will include the value 1. (b) A 95% confidence interval for µ will include the value 0. (c) A 99% confidence interval for µ will include the value 1. (d) A 99% confidence interval for µ will include the value 0. (e) None of these is necessarily true.
3 8.
4 9

5 B4
6 11.
7 #5
8 13.

9 A union spokesman claims that 75% of union members will support a strike if their basic demands are not met. A company spokesman believes the true percentage is lower and runs a hypothesis test at the 10% significance level. What is the conclusion if 87 of 125 union members say they will strike?
10 16. Some boxes of a certain brand of breakfast cereal include a voucher for a free video rental inside the box. The company that makes the cereal claims that a voucher can be found in 20 percent of the boxes. However, based on their experiences eating this cereal at home, a group of students believes that the proportion of boxes with vouchers is less than.2. This group of students purchased 65 boxes of the cereal to investigate the company s claim. The students found a total of 11 vouchers for free video rentals in the 65 boxes. Suppose it is reasonable to assume that the 65 boxes purchased by the students are a simple random sample of all boxes of this cereal. Based on this sample, is there support for the students belief that the proportion of boxes with vouchers is less than.2? Provide statistical evidence to support your answer.
Business Statistics, 9e (Groebner/Shannon/Fry) Chapter 9 Introduction to Hypothesis Testing
 Chapter 9 Introduction to Hypothesis Testing") Business Statistics, 9e (Groebner/Shannon/Fry) Chapter 9 Introduction to Hypothesis Testing 1) Hypothesis testing and confidence interval estimation are essentially two totally different statistical procedures
Business Statistics, 9e (Groebner/Shannon/Fry) Chapter 9 Introduction to Hypothesis Testing 1) Hypothesis testing and confidence interval estimation are essentially two totally different statistical procedures
BA 275 Review Problems - Week 5 (10/23/06-10/27/06) CD Lessons: 48, 49, 50, 51, 52 Textbook: pp. 380-394
 CD Lessons: 48, 49, 50, 51, 52 Textbook: pp. 380-394") BA 275 Review Problems - Week 5 (10/23/06-10/27/06) CD Lessons: 48, 49, 50, 51, 52 Textbook: pp. 380-394 1. Does vigorous exercise affect concentration? In general, the time needed for people to complete
BA 275 Review Problems - Week 5 (10/23/06-10/27/06) CD Lessons: 48, 49, 50, 51, 52 Textbook: pp. 380-394 1. Does vigorous exercise affect concentration? In general, the time needed for people to complete
Chapter 8 Hypothesis Testing Chapter 8 Hypothesis Testing 8-1 Overview 8-2 Basics of Hypothesis Testing
 Chapter 8 Hypothesis Testing 1 Chapter 8 Hypothesis Testing 8-1 Overview 8-2 Basics of Hypothesis Testing 8-3 Testing a Claim About a Proportion 8-5 Testing a Claim About a Mean: s Not Known 8-6 Testing
Hypothesis testing - Steps
 Hypothesis testing - Steps Steps to do a two-tailed test of the hypothesis that β 1 0: 1. Set up the hypotheses: H 0 : β 1 = 0 H a : β 1 0. 2. Compute the test statistic: t = b 1 0 Std. error of b 1 =
p ˆ (sample mean and sample
 Chapter 6: Confidence Intervals and Hypothesis Testing When analyzing data, we can t just accept the sample mean or sample proportion as the official mean or proportion. When we estimate the statistics
A) 0.1554 B) 0.0557 C) 0.0750 D) 0.0777
 0.1554 B) 0.0557 C) 0.0750 D) 0.0777") Math 210 - Exam 4 - Sample Exam 1) What is the p-value for testing H1: µ < 90 if the test statistic is t=-1.592 and n=8? A) 0.1554 B) 0.0557 C) 0.0750 D) 0.0777 2) The owner of a football team claims that
Math 210 - Exam 4 - Sample Exam 1) What is the p-value for testing H1: µ < 90 if the test statistic is t=-1.592 and n=8? A) 0.1554 B) 0.0557 C) 0.0750 D) 0.0777 2) The owner of a football team claims that
BA 275 Review Problems - Week 6 (10/30/06-11/3/06) CD Lessons: 53, 54, 55, 56 Textbook: pp. 394-398, 404-408, 410-420
 CD Lessons: 53, 54, 55, 56 Textbook: pp. 394-398, 404-408, 410-420") BA 275 Review Problems - Week 6 (10/30/06-11/3/06) CD Lessons: 53, 54, 55, 56 Textbook: pp. 394-398, 404-408, 410-420 1. Which of the following will increase the value of the power in a statistical test
BA 275 Review Problems - Week 6 (10/30/06-11/3/06) CD Lessons: 53, 54, 55, 56 Textbook: pp. 394-398, 404-408, 410-420 1. Which of the following will increase the value of the power in a statistical test
Unit 26 Estimation with Confidence Intervals
 Unit 26 Estimation with Confidence Intervals Objectives: To see how confidence intervals are used to estimate a population proportion, a population mean, a difference in population proportions, or a difference
Chapter Study Guide. Chapter 11 Confidence Intervals and Hypothesis Testing for Means
 OPRE504 Chapter Study Guide Chapter 11 Confidence Intervals and Hypothesis Testing for Means I. Calculate Probability for A Sample Mean When Population σ Is Known 1. First of all, we need to find out the
An Introduction to Statistics Course (ECOE 1302) Spring Semester 2011 Chapter 10- TWO-SAMPLE TESTS
 Spring Semester 2011 Chapter 10- TWO-SAMPLE TESTS") The Islamic University of Gaza Faculty of Commerce Department of Economics and Political Sciences An Introduction to Statistics Course (ECOE 130) Spring Semester 011 Chapter 10- TWO-SAMPLE TESTS Practice
The Islamic University of Gaza Faculty of Commerce Department of Economics and Political Sciences An Introduction to Statistics Course (ECOE 130) Spring Semester 011 Chapter 10- TWO-SAMPLE TESTS Practice
General Method: Difference of Means. 3. Calculate df: either Welch-Satterthwaite formula or simpler df = min(n 1, n 2 ) 1.
 1.") General Method: Difference of Means 1. Calculate x 1, x 2, SE 1, SE 2. 2. Combined SE = SE1 2 + SE2 2. ASSUMES INDEPENDENT SAMPLES. 3. Calculate df: either Welch-Satterthwaite formula or simpler df = min(n
General Method: Difference of Means 1. Calculate x 1, x 2, SE 1, SE 2. 2. Combined SE = SE1 2 + SE2 2. ASSUMES INDEPENDENT SAMPLES. 3. Calculate df: either Welch-Satterthwaite formula or simpler df = min(n
C. The null hypothesis is not rejected when the alternative hypothesis is true. A. population parameters.
 Sample Multiple Choice Questions for the material since Midterm 2. Sample questions from Midterms and 2 are also representative of questions that may appear on the final exam.. A randomly selected sample
Final Exam Practice Problem Answers
 Final Exam Practice Problem Answers The following data set consists of data gathered from 77 popular breakfast cereals. The variables in the data set are as follows: Brand: The brand name of the cereal
Experimental Design. Power and Sample Size Determination. Proportions. Proportions. Confidence Interval for p. The Binomial Test
 Experimental Design Power and Sample Size Determination Bret Hanlon and Bret Larget Department of Statistics University of Wisconsin Madison November 3 8, 2011 To this point in the semester, we have largely
Practice problems for Homework 12 - confidence intervals and hypothesis testing. Open the Homework Assignment 12 and solve the problems.
 Practice problems for Homework 1 - confidence intervals and hypothesis testing. Read sections 10..3 and 10.3 of the text. Solve the practice problems below. Open the Homework Assignment 1 and solve the
Chapter 2 Probability Topics SPSS T tests
 Chapter 2 Probability Topics SPSS T tests Data file used: gss.sav In the lecture about chapter 2, only the One-Sample T test has been explained. In this handout, we also give the SPSS methods to perform
HYPOTHESIS TESTING (ONE SAMPLE) - CHAPTER 7 1. used confidence intervals to answer questions such as...
 - CHAPTER 7 1. used confidence intervals to answer questions such as...") HYPOTHESIS TESTING (ONE SAMPLE) - CHAPTER 7 1 PREVIOUSLY used confidence intervals to answer questions such as... You know that 0.25% of women have red/green color blindness. You conduct a study of men
HYPOTHESIS TESTING (ONE SAMPLE) - CHAPTER 7 1 PREVIOUSLY used confidence intervals to answer questions such as... You know that 0.25% of women have red/green color blindness. You conduct a study of men
Sample Size and Power in Clinical Trials
 Sample Size and Power in Clinical Trials Version 1.0 May 011 1. Power of a Test. Factors affecting Power 3. Required Sample Size RELATED ISSUES 1. Effect Size. Test Statistics 3. Variation 4. Significance
MULTIPLE CHOICE. Choose the one alternative that best completes the statement or answers the question.
 STT315 Practice Ch 5-7 MULTIPLE CHOICE. Choose the one alternative that best completes the statement or answers the question. Solve the problem. 1) The length of time a traffic signal stays green (nicknamed
Online 12 - Sections 9.1 and 9.2-Doug Ensley
 Student: Date: Instructor: Doug Ensley Course: MAT117 01 Applied Statistics - Ensley Assignment: Online 12 - Sections 9.1 and 9.2 1. Does a P-value of 0.001 give strong evidence or not especially strong
Section 7.1. Introduction to Hypothesis Testing. Schrodinger s cat quantum mechanics thought experiment (1935)
") Section 7.1 Introduction to Hypothesis Testing Schrodinger s cat quantum mechanics thought experiment (1935) Statistical Hypotheses A statistical hypothesis is a claim about a population. Null hypothesis
Section 7.1 Introduction to Hypothesis Testing Schrodinger s cat quantum mechanics thought experiment (1935) Statistical Hypotheses A statistical hypothesis is a claim about a population. Null hypothesis
Name: Date: Use the following to answer questions 3-4:
 Name: Date: 1. Determine whether each of the following statements is true or false. A) The margin of error for a 95% confidence interval for the mean increases as the sample size increases. B) The margin
Module 2 Probability and Statistics
 Module 2 Probability and Statistics BASIC CONCEPTS Multiple Choice Identify the choice that best completes the statement or answers the question. 1. The standard deviation of a standard normal distribution
Math 251, Review Questions for Test 3 Rough Answers
 Math 251, Review Questions for Test 3 Rough Answers 1. (Review of some terminology from Section 7.1) In a state with 459,341 voters, a poll of 2300 voters finds that 45 percent support the Republican candidate,
1. What is the critical value for this 95% confidence interval? CV = z.025 = invnorm(0.025) = 1.96
 = 1.96") 1 Final Review 2 Review 2.1 CI 1-propZint Scenario 1 A TV manufacturer claims in its warranty brochure that in the past not more than 10 percent of its TV sets needed any repair during the first two years
1 Final Review 2 Review 2.1 CI 1-propZint Scenario 1 A TV manufacturer claims in its warranty brochure that in the past not more than 10 percent of its TV sets needed any repair during the first two years
Introduction to Hypothesis Testing. Hypothesis Testing. Step 1: State the Hypotheses
 Introduction to Hypothesis Testing 1 Hypothesis Testing A hypothesis test is a statistical procedure that uses sample data to evaluate a hypothesis about a population Hypothesis is stated in terms of the
Chapter 2. Hypothesis testing in one population
 Chapter 2. Hypothesis testing in one population Contents Introduction, the null and alternative hypotheses Hypothesis testing process Type I and Type II errors, power Test statistic, level of significance
In the past, the increase in the price of gasoline could be attributed to major national or global
 Chapter 7 Testing Hypotheses Chapter Learning Objectives Understanding the assumptions of statistical hypothesis testing Defining and applying the components in hypothesis testing: the research and null
12.5: CHI-SQUARE GOODNESS OF FIT TESTS
 125: Chi-Square Goodness of Fit Tests CD12-1 125: CHI-SQUARE GOODNESS OF FIT TESTS In this section, the χ 2 distribution is used for testing the goodness of fit of a set of data to a specific probability
22. HYPOTHESIS TESTING
 22. HYPOTHESIS TESTING Often, we need to make decisions based on incomplete information. Do the data support some belief ( hypothesis ) about the value of a population parameter? Is OJ Simpson guilty?
Statistics I for QBIC. Contents and Objectives. Chapters 1 7. Revised: August 2013
 Statistics I for QBIC Text Book: Biostatistics, 10 th edition, by Daniel & Cross Contents and Objectives Chapters 1 7 Revised: August 2013 Chapter 1: Nature of Statistics (sections 1.1-1.6) Objectives
Hypothesis Testing. Steps for a hypothesis test:
 Hypothesis Testing Steps for a hypothesis test: 1. State the claim H 0 and the alternative, H a 2. Choose a significance level or use the given one. 3. Draw the sampling distribution based on the assumption
MULTIPLE CHOICE. Choose the one alternative that best completes the statement or answers the question.
 Sample Practice problems - chapter 12-1 and 2 proportions for inference - Z Distributions Name MULTIPLE CHOICE. Choose the one alternative that best completes the statement or answers the question. Provide
Unit 31 A Hypothesis Test about Correlation and Slope in a Simple Linear Regression
 Unit 31 A Hypothesis Test about Correlation and Slope in a Simple Linear Regression Objectives: To perform a hypothesis test concerning the slope of a least squares line To recognize that testing for a
LAB 4 INSTRUCTIONS CONFIDENCE INTERVALS AND HYPOTHESIS TESTING
 LAB 4 INSTRUCTIONS CONFIDENCE INTERVALS AND HYPOTHESIS TESTING In this lab you will explore the concept of a confidence interval and hypothesis testing through a simulation problem in engineering setting.
August 2012 EXAMINATIONS Solution Part I
 August 01 EXAMINATIONS Solution Part I (1) In a random sample of 600 eligible voters, the probability that less than 38% will be in favour of this policy is closest to (B) () In a large random sample,
STAT 350 Practice Final Exam Solution (Spring 2015)
") PART 1: Multiple Choice Questions: 1) A study was conducted to compare five different training programs for improving endurance. Forty subjects were randomly divided into five groups of eight subjects
PART 1: Multiple Choice Questions: 1) A study was conducted to compare five different training programs for improving endurance. Forty subjects were randomly divided into five groups of eight subjects
MTH 140 Statistics Videos
 MTH 140 Statistics Videos Chapter 1 Picturing Distributions with Graphs Individuals and Variables Categorical Variables: Pie Charts and Bar Graphs Categorical Variables: Pie Charts and Bar Graphs Quantitative
8 6 X 2 Test for a Variance or Standard Deviation
 Section 8 6 x 2 Test for a Variance or Standard Deviation 437 This test uses the P-value method. Therefore, it is not necessary to enter a significance level. 1. Select MegaStat>Hypothesis Tests>Proportion
Hypothesis Test for Mean Using Given Data (Standard Deviation Known-z-test)
") Hypothesis Test for Mean Using Given Data (Standard Deviation Known-z-test) A hypothesis test is conducted when trying to find out if a claim is true or not. And if the claim is true, is it significant.
Hypothesis Test for Mean Using Given Data (Standard Deviation Known-z-test) A hypothesis test is conducted when trying to find out if a claim is true or not. And if the claim is true, is it significant.
Independent t- Test (Comparing Two Means)
") Independent t- Test (Comparing Two Means) The objectives of this lesson are to learn: the definition/purpose of independent t-test when to use the independent t-test the use of SPSS to complete an independent
Independent t- Test (Comparing Two Means) The objectives of this lesson are to learn: the definition/purpose of independent t-test when to use the independent t-test the use of SPSS to complete an independent
How To Test For Significance On A Data Set
 Non-Parametric Univariate Tests: 1 Sample Sign Test 1 1 SAMPLE SIGN TEST A non-parametric equivalent of the 1 SAMPLE T-TEST. ASSUMPTIONS: Data is non-normally distributed, even after log transforming.
Confidence Intervals for One Standard Deviation Using Standard Deviation
 Chapter 640 Confidence Intervals for One Standard Deviation Using Standard Deviation Introduction This routine calculates the sample size necessary to achieve a specified interval width or distance from
Name: (b) Find the minimum sample size you should use in order for your estimate to be within 0.03 of p when the confidence level is 95%.
 Find the minimum sample size you should use in order for your estimate to be within 0.03 of p when the confidence level is 95%.") Chapter 7-8 Exam Name: Answer the questions in the spaces provided. If you run out of room, show your work on a separate paper clearly numbered and attached to this exam. Please indicate which program
Chapter 7-8 Exam Name: Answer the questions in the spaces provided. If you run out of room, show your work on a separate paper clearly numbered and attached to this exam. Please indicate which program
Mind on Statistics. Chapter 12
 Mind on Statistics Chapter 12 Sections 12.1 Questions 1 to 6: For each statement, determine if the statement is a typical null hypothesis (H 0 ) or alternative hypothesis (H a ). 1. There is no difference
Statistics 2014 Scoring Guidelines
 AP Statistics 2014 Scoring Guidelines College Board, Advanced Placement Program, AP, AP Central, and the acorn logo are registered trademarks of the College Board. AP Central is the official online home
Statistics 100 Sample Final Questions (Note: These are mostly multiple choice, for extra practice. Your Final Exam will NOT have any multiple choice!
 Statistics 100 Sample Final Questions (Note: These are mostly multiple choice, for extra practice. Your Final Exam will NOT have any multiple choice!) Part A - Multiple Choice Indicate the best choice
University of Chicago Graduate School of Business. Business 41000: Business Statistics
 Name: University of Chicago Graduate School of Business Business 41000: Business Statistics Special Notes: 1. This is a closed-book exam. You may use an 8 11 piece of paper for the formulas. 2. Throughout
Estimation of σ 2, the variance of ɛ
 Estimation of σ 2, the variance of ɛ The variance of the errors σ 2 indicates how much observations deviate from the fitted surface. If σ 2 is small, parameters β 0, β 1,..., β k will be reliably estimated
Stat 411/511 THE RANDOMIZATION TEST. Charlotte Wickham. stat511.cwick.co.nz. Oct 16 2015
 Stat 411/511 THE RANDOMIZATION TEST Oct 16 2015 Charlotte Wickham stat511.cwick.co.nz Today Review randomization model Conduct randomization test What about CIs? Using a t-distribution as an approximation
The Null Hypothesis. Geoffrey R. Loftus University of Washington
 The Null Hypothesis Geoffrey R. Loftus University of Washington Send correspondence to: Geoffrey R. Loftus Department of Psychology, Box 351525 University of Washington Seattle, WA 98195-1525 [email protected]
Review #2. Statistics
 Review #2 Statistics Find the mean of the given probability distribution. 1) x P(x) 0 0.19 1 0.37 2 0.16 3 0.26 4 0.02 A) 1.64 B) 1.45 C) 1.55 D) 1.74 2) The number of golf balls ordered by customers of
AP STATISTICS (Warm-Up Exercises)
") AP STATISTICS (Warm-Up Exercises) 1. Describe the distribution of ages in a city: 2. Graph a box plot on your calculator for the following test scores: {90, 80, 96, 54, 80, 95, 100, 75, 87, 62, 65, 85,
AP STATISTICS (Warm-Up Exercises) 1. Describe the distribution of ages in a city: 2. Graph a box plot on your calculator for the following test scores: {90, 80, 96, 54, 80, 95, 100, 75, 87, 62, 65, 85,
Regression Analysis: A Complete Example
 Regression Analysis: A Complete Example This section works out an example that includes all the topics we have discussed so far in this chapter. A complete example of regression analysis. PhotoDisc, Inc./Getty
Non-Parametric Tests (I)
") Lecture 5: Non-Parametric Tests (I) KimHuat LIM [email protected] http://www.stats.ox.ac.uk/~lim/teaching.html Slide 1 5.1 Outline (i) Overview of Distribution-Free Tests (ii) Median Test for Two Independent
Lecture 5: Non-Parametric Tests (I) KimHuat LIM [email protected] http://www.stats.ox.ac.uk/~lim/teaching.html Slide 1 5.1 Outline (i) Overview of Distribution-Free Tests (ii) Median Test for Two Independent
2 Precision-based sample size calculations
 Statistics: An introduction to sample size calculations Rosie Cornish. 2006. 1 Introduction One crucial aspect of study design is deciding how big your sample should be. If you increase your sample size
Independent samples t-test. Dr. Tom Pierce Radford University
 Independent samples t-test Dr. Tom Pierce Radford University The logic behind drawing causal conclusions from experiments The sampling distribution of the difference between means The standard error of
BUS/ST 350 Exam 3 Spring 2012
 BUS/ST 350 Exam 3 Spring 2012 Name Lab Section ID # INSTRUCTIONS: Write your name, lab section #, and ID# above. Note the statement at the bottom of this page that you must sign when you are finished with
Descriptive Statistics
 Descriptive Statistics Primer Descriptive statistics Central tendency Variation Relative position Relationships Calculating descriptive statistics Descriptive Statistics Purpose to describe or summarize
Using Stata for One Sample Tests
 Using Stata for One Sample Tests All of the one sample problems we have discussed so far can be solved in Stata via either (a) statistical calculator functions, where you provide Stata with the necessary
3.4 Statistical inference for 2 populations based on two samples
 3.4 Statistical inference for 2 populations based on two samples Tests for a difference between two population means The first sample will be denoted as X 1, X 2,..., X m. The second sample will be denoted
Chapter 7 Review. Confidence Intervals. MULTIPLE CHOICE. Choose the one alternative that best completes the statement or answers the question.
 Chapter 7 Review Confidence Intervals MULTIPLE CHOICE. Choose the one alternative that best completes the statement or answers the question. 1) Suppose that you wish to obtain a confidence interval for
HYPOTHESIS TESTING: POWER OF THE TEST
 HYPOTHESIS TESTING: POWER OF THE TEST The first 6 steps of the 9-step test of hypothesis are called "the test". These steps are not dependent on the observed data values. When planning a research project,
Class 19: Two Way Tables, Conditional Distributions, Chi-Square (Text: Sections 2.5; 9.1)
") Spring 204 Class 9: Two Way Tables, Conditional Distributions, Chi-Square (Text: Sections 2.5; 9.) Big Picture: More than Two Samples In Chapter 7: We looked at quantitative variables and compared the
Spring 204 Class 9: Two Way Tables, Conditional Distributions, Chi-Square (Text: Sections 2.5; 9.) Big Picture: More than Two Samples In Chapter 7: We looked at quantitative variables and compared the
HYPOTHESIS TESTING (ONE SAMPLE) - CHAPTER 7 1. used confidence intervals to answer questions such as...
 - CHAPTER 7 1. used confidence intervals to answer questions such as...") HYPOTHESIS TESTING (ONE SAMPLE) - CHAPTER 7 1 PREVIOUSLY used confidence intervals to answer questions such as... You know that 0.25% of women have red/green color blindness. You conduct a study of men
HYPOTHESIS TESTING (ONE SAMPLE) - CHAPTER 7 1 PREVIOUSLY used confidence intervals to answer questions such as... You know that 0.25% of women have red/green color blindness. You conduct a study of men
CHAPTER 11 CHI-SQUARE AND F DISTRIBUTIONS
 CHAPTER 11 CHI-SQUARE AND F DISTRIBUTIONS CHI-SQUARE TESTS OF INDEPENDENCE (SECTION 11.1 OF UNDERSTANDABLE STATISTICS) In chi-square tests of independence we use the hypotheses. H0: The variables are independent
DDBA 8438: Introduction to Hypothesis Testing Video Podcast Transcript
 DDBA 8438: Introduction to Hypothesis Testing Video Podcast Transcript JENNIFER ANN MORROW: Welcome to "Introduction to Hypothesis Testing." My name is Dr. Jennifer Ann Morrow. In today's demonstration,
Chapter 7 TEST OF HYPOTHESIS
 Chapter 7 TEST OF HYPOTHESIS In a certain perspective, we can view hypothesis testing just like a jury in a court trial. In a jury trial, the null hypothesis is similar to the jury making a decision of
Adverse Impact Ratio for Females (0/ 1) = 0 (5/ 17) = 0.2941 Adverse impact as defined by the 4/5ths rule was not found in the above data.
 = 0 (5/ 17) = 0.2941 Adverse impact as defined by the 4/5ths rule was not found in the above data.") 1 of 9 12/8/2014 12:57 PM (an On-Line Internet based application) Instructions: Please fill out the information into the form below. Once you have entered your data below, you may select the types of analysis
1 of 9 12/8/2014 12:57 PM (an On-Line Internet based application) Instructions: Please fill out the information into the form below. Once you have entered your data below, you may select the types of analysis
Practice Problems and Exams
 Practice Problems and Exams 1 The Islamic University of Gaza Faculty of Commerce Department of Economics and Political Sciences An Introduction to Statistics Course (ECOE 1302) Spring Semester 2009-2010
Chapter 6 Experiment Process
 Chapter 6 Process ation is not simple; we have to prepare, conduct and analyze experiments properly. One of the main advantages of an experiment is the control of, for example, subjects, objects and instrumentation.
Statistical tests for SPSS
 Statistical tests for SPSS Paolo Coletti A.Y. 2010/11 Free University of Bolzano Bozen Premise This book is a very quick, rough and fast description of statistical tests and their usage. It is explicitly
Math 108 Exam 3 Solutions Spring 00
 Math 108 Exam 3 Solutions Spring 00 1. An ecologist studying acid rain takes measurements of the ph in 12 randomly selected Adirondack lakes. The results are as follows: 3.0 6.5 5.0 4.2 5.5 4.7 3.4 6.8
The Public Policy Process W E E K 1 2 : T H E S C I E N C E O F T H E P O L I C Y P R O C E S S
 The Public Policy Process W E E K 1 2 : T H E S C I E N C E O F T H E P O L I C Y P R O C E S S Why Study Public Policy Scientific Reasons To help us better understand the nature of political behavior
Week 4: Standard Error and Confidence Intervals
 Health Sciences M.Sc. Programme Applied Biostatistics Week 4: Standard Error and Confidence Intervals Sampling Most research data come from subjects we think of as samples drawn from a larger population.
Lecture Notes Module 1
 Lecture Notes Module 1 Study Populations A study population is a clearly defined collection of people, animals, plants, or objects. In psychological research, a study population usually consists of a specific
STATISTICS PROJECT: Hypothesis Testing
 STATISTICS PROJECT: Hypothesis Testing See my comments in red. Scoring last page. INTRODUCTION My topic is the average tuition cost of a 4-yr. public college. Since I will soon be transferring to a 4-yr.
12: Analysis of Variance. Introduction
 1: Analysis of Variance Introduction EDA Hypothesis Test Introduction In Chapter 8 and again in Chapter 11 we compared means from two independent groups. In this chapter we extend the procedure to consider
HYPOTHESIS TESTING WITH SPSS:
 HYPOTHESIS TESTING WITH SPSS: A NON-STATISTICIAN S GUIDE & TUTORIAL by Dr. Jim Mirabella SPSS 14.0 screenshots reprinted with permission from SPSS Inc. Published June 2006 Copyright Dr. Jim Mirabella CHAPTER
Hypothesis Testing --- One Mean
 Hypothesis Testing --- One Mean A hypothesis is simply a statement that something is true. Typically, there are two hypotheses in a hypothesis test: the null, and the alternative. Null Hypothesis The hypothesis
Introduction to Analysis of Variance (ANOVA) Limitations of the t-test
 Limitations of the t-test") Introduction to Analysis of Variance (ANOVA) The Structural Model, The Summary Table, and the One- Way ANOVA Limitations of the t-test Although the t-test is commonly used, it has limitations Can only
Introduction to Analysis of Variance (ANOVA) The Structural Model, The Summary Table, and the One- Way ANOVA Limitations of the t-test Although the t-test is commonly used, it has limitations Can only
Two-sample hypothesis testing, II 9.07 3/16/2004
 Two-sample hypothesis testing, II 9.07 3/16/004 Small sample tests for the difference between two independent means For two-sample tests of the difference in mean, things get a little confusing, here,
In the general population of 0 to 4-year-olds, the annual incidence of asthma is 1.4%
 Hypothesis Testing for a Proportion Example: We are interested in the probability of developing asthma over a given one-year period for children 0 to 4 years of age whose mothers smoke in the home In the
STATISTICS 8, FINAL EXAM. Last six digits of Student ID#: Circle your Discussion Section: 1 2 3 4
 STATISTICS 8, FINAL EXAM NAME: KEY Seat Number: Last six digits of Student ID#: Circle your Discussion Section: 1 2 3 4 Make sure you have 8 pages. You will be provided with a table as well, as a separate
Introduction to Hypothesis Testing OPRE 6301
 Introduction to Hypothesis Testing OPRE 6301 Motivation... The purpose of hypothesis testing is to determine whether there is enough statistical evidence in favor of a certain belief, or hypothesis, about
Fairfield Public Schools
 Mathematics Fairfield Public Schools AP Statistics AP Statistics BOE Approved 04/08/2014 1 AP STATISTICS Critical Areas of Focus AP Statistics is a rigorous course that offers advanced students an opportunity
X X X a) perfect linear correlation b) no correlation c) positive correlation (r = 1) (r = 0) (0 < r < 1)
 perfect linear correlation b) no correlation c) positive correlation (r = 1) (r = 0) (0 < r < 1)") CORRELATION AND REGRESSION / 47 CHAPTER EIGHT CORRELATION AND REGRESSION Correlation and regression are statistical methods that are commonly used in the medical literature to compare two or more variables.
CORRELATION AND REGRESSION / 47 CHAPTER EIGHT CORRELATION AND REGRESSION Correlation and regression are statistical methods that are commonly used in the medical literature to compare two or more variables.
SCHOOL OF HEALTH AND HUMAN SCIENCES DON T FORGET TO RECODE YOUR MISSING VALUES
 SCHOOL OF HEALTH AND HUMAN SCIENCES Using SPSS Topics addressed today: 1. Differences between groups 2. Graphing Use the s4data.sav file for the first part of this session. DON T FORGET TO RECODE YOUR
AP: LAB 8: THE CHI-SQUARE TEST. Probability, Random Chance, and Genetics
 Ms. Foglia Date AP: LAB 8: THE CHI-SQUARE TEST Probability, Random Chance, and Genetics Why do we study random chance and probability at the beginning of a unit on genetics? Genetics is the study of inheritance,
Two-Sample T-Tests Assuming Equal Variance (Enter Means)
") Chapter 4 Two-Sample T-Tests Assuming Equal Variance (Enter Means) Introduction This procedure provides sample size and power calculations for one- or two-sided two-sample t-tests when the variances of
Chapter 4 Two-Sample T-Tests Assuming Equal Variance (Enter Means) Introduction This procedure provides sample size and power calculations for one- or two-sided two-sample t-tests when the variances of
Understanding Confidence Intervals and Hypothesis Testing Using Excel Data Table Simulation
 Understanding Confidence Intervals and Hypothesis Testing Using Excel Data Table Simulation Leslie Chandrakantha [email protected] Department of Mathematics & Computer Science John Jay College of
Course Text. Required Computing Software. Course Description. Course Objectives. StraighterLine. Business Statistics
 Course Text Business Statistics Lind, Douglas A., Marchal, William A. and Samuel A. Wathen. Basic Statistics for Business and Economics, 7th edition, McGraw-Hill/Irwin, 2010, ISBN: 9780077384470 [This
Two-Sample T-Tests Allowing Unequal Variance (Enter Difference)
") Chapter 45 Two-Sample T-Tests Allowing Unequal Variance (Enter Difference) Introduction This procedure provides sample size and power calculations for one- or two-sided two-sample t-tests when no assumption
Chapter 45 Two-Sample T-Tests Allowing Unequal Variance (Enter Difference) Introduction This procedure provides sample size and power calculations for one- or two-sided two-sample t-tests when no assumption
Study Guide for the Final Exam
 Study Guide for the Final Exam When studying, remember that the computational portion of the exam will only involve new material (covered after the second midterm), that material from Exam 1 will make
CHAPTER 5 COMPARISON OF DIFFERENT TYPE OF ONLINE ADVERTSIEMENTS. Table: 8 Perceived Usefulness of Different Advertisement Types
 CHAPTER 5 COMPARISON OF DIFFERENT TYPE OF ONLINE ADVERTSIEMENTS 5.1 Descriptive Analysis- Part 3 of Questionnaire Table 8 shows the descriptive statistics of Perceived Usefulness of Banner Ads. The results
CHAPTER 13 SIMPLE LINEAR REGRESSION. Opening Example. Simple Regression. Linear Regression
 Opening Example CHAPTER 13 SIMPLE LINEAR REGREION SIMPLE LINEAR REGREION! Simple Regression! Linear Regression Simple Regression Definition A regression model is a mathematical equation that descries the