Reprojecting MODIS Images
|
|
|
- Letitia Tate
- 10 years ago
- Views:
Transcription
1 Reprojecting MODIS Images

2 Why Reprojection? Reasons why reprojection is desirable: 1. Removes Bowtie Artifacts 2. Allows geographic overlays (e.g. coastline, city locations) 3. Makes pretty pictures for publication on the web or in print 4. Allows collocation with other sensors or measurements 5. Prepares for ingest into GIS (e.g., GeoTIFF) Good reprojection software is hard to find! Needs to understand MODIS format Should handle a variety of common projections Should be relatively easy to use and well documented Batch processing is a bonus Zero cost (i.e., free) is the icing on the cake

3 Software for Reprojecting MODIS Images MS2GT (MODIS Swath to Grid Toolkit) Cost: Free HEG v0.6 (HDF-EOS to GeoTIFF converter) Cost: Free HDFLook-MODIS Cost: Free ENVI (Environment for Visualizing Images) Cost: $$$
 Cost: $$$ http://www.")
4 MS2GT (MODIS Swath to Grid Toolkit) Developed at National Snow and Ice Data Center (NSIDC) by Terry Haran and Ken Knowles. Based on mapx library routines that have been well tested. Accounts for multiple lines per earth scan. Comes with Perl scripts that automate reprojection procedure. You can call low level routines directly (ll2cr and fornav). Calling low-level routines gives the greatest flexibility on input and output formats. Flexible text file format for defining output map projection and datum. Gives high quality results when supplied with high quality input.

5 Sensor Projection (250 m pixels) Reprojected (250 m grid)

6 MS2GT Input and Output Formats When calling the low level routines ll2cr and fornav: Input 1. Image file (8, 16, 32-bit int or 32-bit float) 2. Corresponding latitude and longitude files (32-bit float) 3. Grid Parameter Definition file (ASCII text) Output 1. Reprojected image file (same type as input image file) 2. Optional latitude and longitude files for reprojected grid Note: No dependence on details of MODIS L1B HDF format
 Output 1.")
7 MS2GT Grid Parameter Definition (GPD) File The GPD file specifies the size and type of the reprojected grid. Example: Lambert Azimuthal Equal Area projected grid centered at 32S, 128E; 0.25 km resolution; 2550 columns and 3300 rows: Map Projection: Azimuthal Equal-Area Map Reference Latitude: Map Reference Longitude: Grid Map Units Per Cell: 0.25 Grid Width: Grid Map Origin Column: Grid Height: Grid Map Origin Row: Detailed reference:

8 MS2GT Projections Available Albers Conic Equal-Area* Azimuthal Equal-Area* Cylindrical Equal-Area* Cylindrical Equidistant Interupted Homolosine Equal-Area Lambert Conic Conformal* Mercator Mollweide Orthographic Polar Stereographic* Sinusoidal * User can specify ellipsoid radius and eccentricity

9 GPD File Example More complex example (GeoTIFF compatible): Lambert Conformal Conic with two standard parallels; WGS84 ellipsoid; centered at 53.1N, 80.5W; 0.25 km resolution; 2750 columns and 2125 rows: Map Projection: Lambert Conic Conformal Ellipsoid Map Reference Latitude: 49.0 (first standard parallel) Map Second Reference Latitude: 77.0 (second standard parallel) Map Reference Longitude: (natural origin longitude) Map Origin Latitude: 53.1 (false origin latitude) Map Origin Longitude: (false origin longitude) Map Equatorial Radius: (WGS84 ellipsoid, km) Map Eccentricity: (WGS84 ellipsoid) Grid Map Units per Cell: 0.25 (resolution of projected grid, km) Grid Width: (columns in projected grid) Grid Height: (rows in projected grid Grid Map Origin Column: (column coordinate of grid center) Grid Map Origin Row: (row coordinate of grid center)
 Map Equatorial Radius: 6378.137 (WGS84 ellipsoid, km) Map Eccentricity: 0.081819190843 (WGS84 ellipsoid) Grid Map Units per Cell: 0.")
10 MS2GT Script Example Reproject 250 meter resolution image to 250 meter grid. Step 1: Convert lat/lon to col/row $ ll2cr -v -f \ lat_5416x4000.dat lon_5416x4000.dat AquaSA.gpd AquaSA Step 2: Convert lat/lon to col/row $ fornav 1 -v -t f \ AquaSA_cols_05416_00100_00000_40.img \ AquaSA_rows_05416_00100_00000_40.img \ band02_5416x4000.dat band02_proj_2550x3300.dat Default is weighted average of pixels mapped to each grid cell (nearest neighbor is optional).

11 Geolocation Interpolation Geolocation is defined at the nominal center of each 1000 meter pixel. To interpolate to 500 or 250 meter pixels: 1. Must handle each earth scan separately (do not process entire array with CONGRID or REBIN!). 2. Remember that centers of first 1000, 500, and 250 meter pixels across track are co-registered. 3. Can use bilinear interpolation for most (but not all) of the 500 or 250 meter pixels within each scan. 4. Must use linear extrapolation for the 500 and 250 meter pixels at the edge of each earth scan.

12 1000 meter pixels 500 meter pixels

13 Bottom Line If the reprojected image looks strange, it wasn t done right!

14 MS2GT used routinely for SSEC browse images

15 True Color MODIS Images

16 Why True Color Images? Dramatic impact (more so than single band images) Excellent for PR purposes (press, public) Require comparatively little explanation Can use as base for displaying other products (e.g. fires) Daily 250 meter images in near real time are a first! MODIS True Color Galleries:
 Daily 250 meter images in near real time are a first!")
17 Mississippi Delta, Louisiana

18

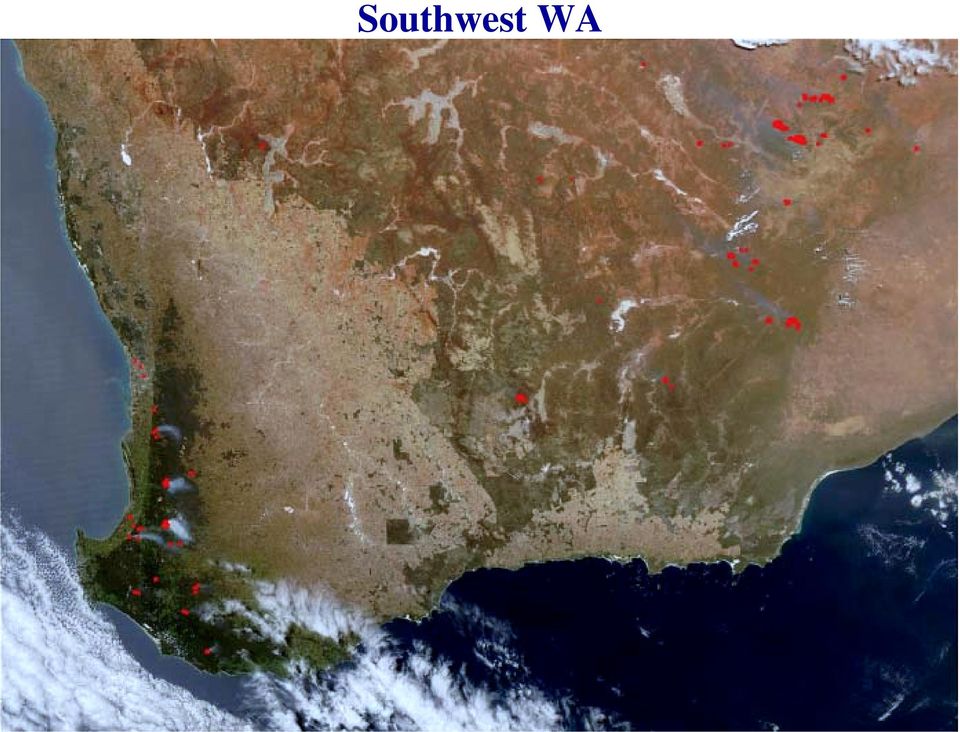
19 Southwest WA
20

21 Four Corners, USA
22
23 True Color Bands and Resolution Use bands 1, 4, 3 (0.65, 0.55, 0.47 µm) for red, green, blue because of wide dynamic range. Band 1 is 250 meter native resolution; bands 3 and 4 are 500 meter native resolution. Can use the image data for input at 1000, 500, or 250 meter resolution. Choice of output resolution for reprojected images is up to the user (e.g., 8 or 4 km for continental, 2 or 1 km for state, 500 or 250 meter for high resolution scenes). Output resolution does not have to match the input resolution. Must use accurately interpolated geolocation data for reprojected images.
24 Bands 3 and 4 at 250 meter resolution Use Band 1 to supply 250 meter resolution information for Bands 3 and 4, i.e., R B 1 * B 1 Then R = B 1 * / B 1 is spatial resolution ratio is band 500 m interpolated to 250 m is band 250 m B 3 = B 3 * / R B 4 = B 4 * / R B 3*, B 4 * are bands 3, 500 m interpolated to 250 m B 3, B 4 are bands 3, 250 m
25 Image Interpolation To interpolate 500 meter resolution image pixels to 250 meter resolution: 1. Must handle each earth scan separately (do not process entire array with CONGRID or REBIN!). 2. Remember that centers of first 1000, 500, and 250 meter pixels across track are co-registered. 3. Can use bilinear interpolation for most (but not all) of the 250 meter pixels within each scan. 4. Can use pixel replication for the 250 meter pixels at the edge of each earth scan.
26 True Color Enhancement: First Cut Linear enhancement of at-sensor reflectance. Advantages: Easy to code Disadvantages: Clouds are washed out Difficult to achieve balance between red, green, blue Bluish haze always appears at the image edges Jacques Descloitres images look much better!

27
28 True Color Enhancement: Second Cut Piecewise linear enhancement of corrected reflectance. Advantages: Removes bluish haze Allows clouds to retain detail Balance between red, green, and blue is much improved Disadvantages: Requires corrected reflectance algorithm from Jacques Descloitres (NASA release is pending)

29
30 Corrected Reflectance Algorithm A simplified pixel-by-pixel atmospheric correction scheme (not the same as MODIS surface reflectance product MOD09). Accounts for molecular scattering and for absorption by ozone, oxygen, and water vapor in conjunction with a low resolution terrain database. Removes haze from blue band.
31 Corrected Reflectance Script To create corrected reflectance files at 500 m and 250 m resolution: $ ln -fs MOD021KM.A hdf MOD021KM.hdf $ ln -fs MOD02HKM.A hdf MOD02HKM.hdf $ ln -fs MOD02QKM.A hdf MOD02QKM.hdf $ ln -fs MOD03.A hdf MOD03.hdf $ export CORR_REFL=$HOME/corr_refl $ export ANCPATH $CORR_REFL $ $CORR_REFL/corr_refl -f -v -250m \ MOD02HKM.hdf MOD02QKM.hdf MOD021KM.hdf -of=qkm.hdf $ $CORR_REFL/corr_refl -f -v -500m \ MOD02HKM.hdf MOD02QKM.hdf MOD021KM.hdf -of=hkm.hdf Output HDF files (qkm.hdf, hkm.hdf) contain three SDS arrays: CorrRefl_01, CorrRefl_03, CorrRefl_04 containing corrected reflectance scaled by a factor of
32 TOA reflectance Corrected reflectance
33 Piecewise Linear Enhancement Curve Corr. Refl. Brightness Same curve is applied to corrected reflectance from bands 1, 3, 4. Final step is to convert to HLS space and increase saturation by 25% and lightness by 5%.
34 Applications of True Color Images Regional scale images (e.g. SouthWest WA) at 0.5 or 1 km resolution Continental scale images (e.g. Australia clear sky composite for last 7 days) at 1, 2, or 4 km resolution Local scale images (e.g. Over an active fire) at 0.25 km resolution All of these can be produced in near real time!
35 Ordering Global MODIS Data
36 ftp://g0dps01u.ecs.nasa.gov/ Delay: About 24 hours Interface: Anonymous FTP Holdings: At least 30 days global Platforms: Terra and Aqua Metadata: Quicklooks, XML files Registration: Not required Manual search and download Degree of difficulty 1.0/5.0 ECS Data Pool
37 DAAC Search and Order Delay: About 24 hours Interface: Web Holdings: Entire global archive Platforms: Terra and Aqua Metadata:.met files Registration: Required One product per search FTP pull subject to delays (try FTP push instead) Degree of difficulty 3.0/5.0
38 Enhanced Data Gateway Delay: About 24 hours Interface: Web Holdings: Entire global archive Platforms: Terra and Aqua Metadata:.met files Registration: Required Multiple products per search FTP pull subject to delays (use push instead) Degree of difficulty 5.0/5.0
Obtaining and Processing MODIS Data
 Obtaining and Processing MODIS Data MODIS is an extensive program using sensors on two satellites that each provide complete daily coverage of the earth. The data have a variety of resolutions; spectral,
MOD09 (Surface Reflectance) User s Guide
 User s Guide") MOD09 (Surface ) User s Guide MODIS Land Surface Science Computing Facility Principal Investigator: Dr. Eric F. Vermote Web site: http://modis-sr.ltdri.org Correspondence e-mail address: [email protected]
MOD09 (Surface ) User s Guide MODIS Land Surface Science Computing Facility Principal Investigator: Dr. Eric F. Vermote Web site: http://modis-sr.ltdri.org Correspondence e-mail address: [email protected]
TerraColor White Paper
 TerraColor White Paper TerraColor is a simulated true color digital earth imagery product developed by Earthstar Geographics LLC. This product was built from imagery captured by the US Landsat 7 (ETM+)
McIDAS-V Tutorial Displaying Polar Satellite Imagery updated September 2015 (software version 1.5)
") McIDAS-V Tutorial Displaying Polar Satellite Imagery updated September 2015 (software version 1.5) McIDAS-V is a free, open source, visualization and data analysis software package that is the next generation
McIDAS-V Tutorial Displaying Polar Satellite Imagery updated September 2015 (software version 1.5) McIDAS-V is a free, open source, visualization and data analysis software package that is the next generation
VIIRS-CrIS mapping. NWP SAF AAPP VIIRS-CrIS Mapping
 NWP SAF AAPP VIIRS-CrIS Mapping This documentation was developed within the context of the EUMETSAT Satellite Application Facility on Numerical Weather Prediction (NWP SAF), under the Cooperation Agreement
SESSION 8: GEOGRAPHIC INFORMATION SYSTEMS AND MAP PROJECTIONS
 SESSION 8: GEOGRAPHIC INFORMATION SYSTEMS AND MAP PROJECTIONS KEY CONCEPTS: In this session we will look at: Geographic information systems and Map projections. Content that needs to be covered for examination
Ocean Level-3 Standard Mapped Image Products June 4, 2010
 Ocean Level-3 Standard Mapped Image Products June 4, 2010 1.0 Introduction This document describes the specifications of Ocean Level-3 standard mapped archive products that are produced and distributed
Estimating Firn Emissivity, from 1994 to1998, at the Ski Hi Automatic Weather Station on the West Antarctic Ice Sheet Using Passive Microwave Data
 Estimating Firn Emissivity, from 1994 to1998, at the Ski Hi Automatic Weather Station on the West Antarctic Ice Sheet Using Passive Microwave Data Mentor: Dr. Malcolm LeCompte Elizabeth City State University
ADAGUC & PyTROLL. Maarten Plieger Ernst de Vreede. Application of polar orbiter products in weather forecasting Using open source tools and standards
 Application of polar orbiter products in weather forecasting Using open source tools and standards ADAGUC & PyTROLL Maarten Plieger Ernst de Vreede Royal Netherlands Meteorological Institute (KNMI) R&D
How Landsat Images are Made
 How Landsat Images are Made Presentation by: NASA s Landsat Education and Public Outreach team June 2006 1 More than just a pretty picture Landsat makes pretty weird looking maps, and it isn t always easy
NGA GRID GUIDE HOW TO USE ArcGIS 8.x ANS 9.x TO GENERATE MGRS AND OTHER MAP GRIDS
 GEOSPATIAL SCIENCES DIVISION COORDINATE SYSTEMS ANALYSIS TEAM (CSAT) SEPTEMBER 2005 Minor Revisions March 2006 POC Kurt Schulz NGA GRID GUIDE HOW TO USE ArcGIS 8.x ANS 9.x TO GENERATE MGRS AND OTHER MAP
Introduction to GIS (Basics, Data, Analysis) & Case Studies. 13 th May 2004. Content. What is GIS?
 & Case Studies. 13 th May 2004. Content. What is GIS?") Introduction to GIS (Basics, Data, Analysis) & Case Studies 13 th May 2004 Content Introduction to GIS Data concepts Data input Analysis Applications selected examples What is GIS? Geographic Information
Introduction to GIS (Basics, Data, Analysis) & Case Studies 13 th May 2004 Content Introduction to GIS Data concepts Data input Analysis Applications selected examples What is GIS? Geographic Information
High Resolution Information from Seven Years of ASTER Data
 High Resolution Information from Seven Years of ASTER Data Anna Colvin Michigan Technological University Department of Geological and Mining Engineering and Sciences Outline Part I ASTER mission Terra
Satellite'&'NASA'Data'Intro'
 Satellite'&'NASA'Data'Intro' Research'vs.'Opera8ons' NASA':'Research'satellites' ' ' NOAA/DoD:'Opera8onal'Satellites' NOAA'Polar'Program:'NOAA>16,17,18,19,NPP' Geosta8onary:'GOES>east,'GOES>West' DMSP'series:'SSM/I,'SSMIS'
GEOGRAPHIC INFORMATION SYSTEMS CERTIFICATION
 GEOGRAPHIC INFORMATION SYSTEMS CERTIFICATION GIS Syllabus - Version 1.2 January 2007 Copyright AICA-CEPIS 2009 1 Version 1 January 2007 GIS Certification Programme 1. Target The GIS certification is aimed
AUTOMATED DEM VALIDATION USING ICESAT GLAS DATA INTRODUCTION
 AUTOMATED DEM VALIDATION USING ICESAT GLAS DATA Mary Pagnutti Robert E. Ryan Innovative Imaging and Research Corp. Building 1103, Suite 140C Stennis Space Center, MS 39529 [email protected] [email protected]
Electromagnetic Radiation (EMR) and Remote Sensing
 and Remote Sensing") Electromagnetic Radiation (EMR) and Remote Sensing 1 Atmosphere Anything missing in between? Electromagnetic Radiation (EMR) is radiated by atomic particles at the source (the Sun), propagates through
Electromagnetic Radiation (EMR) and Remote Sensing 1 Atmosphere Anything missing in between? Electromagnetic Radiation (EMR) is radiated by atomic particles at the source (the Sun), propagates through
Using Geocoded TIFF & JPEG Files in ER Mapper 6.3 with SP1. Eric Augenstein Earthstar Geographics Web: www.es-geo.com
 Using Geocoded TIFF & JPEG Files in ER Mapper 6.3 with SP1 Eric Augenstein Earthstar Geographics Web: www.es-geo.com 1 Table of Contents WHAT IS NEW IN 6.3 SP1 REGARDING WORLD FILES?...3 WHAT IS GEOTIFF
Files Used in this Tutorial
 Generate Point Clouds Tutorial This tutorial shows how to generate point clouds from IKONOS satellite stereo imagery. You will view the point clouds in the ENVI LiDAR Viewer. The estimated time to complete
Data source, type, and file naming convention
 Exercise 1: Basic visualization of LiDAR Digital Elevation Models using ArcGIS Introduction This exercise covers activities associated with basic visualization of LiDAR Digital Elevation Models using ArcGIS.
Satellite Products and Dissemination: Visualization and Data Access
 Satellite Products and Dissemination: Visualization and Data Access Gregory Leptoukh GES DISC, NASA GSFC Dana Ostrenga GES DISC, NASA GSFC Introduction The Goddard Earth Sciences Data and Information Services
Chapter Contents Page No
 Chapter Contents Page No Preface Acknowledgement 1 Basics of Remote Sensing 1 1.1. Introduction 1 1.2. Definition of Remote Sensing 1 1.3. Principles of Remote Sensing 1 1.4. Various Stages in Remote Sensing
The NASA NEESPI Data Portal to Support Studies of Climate and Environmental Changes in Non-boreal Europe
 The NASA NEESPI Data Portal to Support Studies of Climate and Environmental Changes in Non-boreal Europe Suhung Shen NASA Goddard Space Flight Center/George Mason University Gregory Leptoukh, Tatiana Loboda,
WORLD METEOROLOGICAL ORGANIZATION. Introduction to. GRIB Edition1 and GRIB Edition 2
 WORLD METEOROLOGICAL ORGANIZATION Introduction to GRIB Edition1 and GRIB Edition 2 JUNE 2003 GRIB EDITION 1 and GRIB EDITION 2 HISTORY 1. The GRIB code has great advantages in comparison with the traditional
Norwegian Satellite Earth Observation Database for Marine and Polar Research http://normap.nersc.no USE CASES
 Norwegian Satellite Earth Observation Database for Marine and Polar Research http://normap.nersc.no USE CASES The NORMAP Project team has prepared this document to present functionality of the NORMAP portal.
NASA Earth System Science: Structure and data centers
 SUPPLEMENT MATERIALS NASA Earth System Science: Structure and data centers NASA http://nasa.gov/ NASA Mission Directorates Aeronautics Research Exploration Systems Science http://nasascience.nasa.gov/
ENVI Classic Tutorial: Atmospherically Correcting Hyperspectral Data using FLAASH 2
 ENVI Classic Tutorial: Atmospherically Correcting Hyperspectral Data Using FLAASH Atmospherically Correcting Hyperspectral Data using FLAASH 2 Files Used in This Tutorial 2 Opening the Uncorrected AVIRIS
Temporal variation in snow cover over sea ice in Antarctica using AMSR-E data product
 Temporal variation in snow cover over sea ice in Antarctica using AMSR-E data product Michael J. Lewis Ph.D. Student, Department of Earth and Environmental Science University of Texas at San Antonio ABSTRACT
Launch-Ready Operations Code Chain ESDT ShortNames, LongNames, and Generating PGE or Ingest Source
 Launch-Ready Operations Code Chain ESDT ShortNames, LongNames, and Generating PGE or Ingest Source Generating PGE Name/Description or Ingest Source Product ESDT ShortName Product ESDT LongName NPP_VMAE_L1
SHOALS Toolbox: Software to Support Visualization and Analysis of Large, High-Density Data Sets
 SHOALS Toolbox: Software to Support Visualization and Analysis of Large, High-Density Data Sets by Jennifer M. Wozencraft, W. Jeff Lillycrop, and Nicholas C. Kraus PURPOSE: The Coastal and Hydraulics Engineering
FRESCO. Product Specification Document FRESCO. Authors : P. Wang, R.J. van der A (KNMI) REF : TEM/PSD2/003 ISSUE : 3.0 DATE : 30.05.
 REF : TEM/PSD2/003 ISSUE : 3.0 DATE : 30.05.") PAGE : 1/11 TITLE: Product Specification Authors : P. Wang, R.J. van der A (KNMI) PAGE : 2/11 DOCUMENT STATUS SHEET Issue Date Modified Items / Reason for Change 0.9 19.01.06 First Version 1.0 22.01.06
PAGE : 1/11 TITLE: Product Specification Authors : P. Wang, R.J. van der A (KNMI) PAGE : 2/11 DOCUMENT STATUS SHEET Issue Date Modified Items / Reason for Change 0.9 19.01.06 First Version 1.0 22.01.06
WGS AGD GDA: Selecting the correct datum, coordinate system and projection for north Australian applications
 internal report WGS AGD GDA: Selecting the correct datum, coordinate system and projection for north Australian applications JBC Lowry Hydrological and Ecological Processes Program Environmental Research
TerraAmazon - The Amazon Deforestation Monitoring System - Karine Reis Ferreira
 TerraAmazon - The Amazon Deforestation Monitoring System - Karine Reis Ferreira GEOSS Users & Architecture Workshop XXIV: Water Security & Governance - Accra Ghana / October 2008 INPE National Institute
Multiangle cloud remote sensing from
 Multiangle cloud remote sensing from POLDER3/PARASOL Cloud phase, optical thickness and albedo F. Parol, J. Riedi, S. Zeng, C. Vanbauce, N. Ferlay, F. Thieuleux, L.C. Labonnote and C. Cornet Laboratoire
The Map Grid of Australia 1994 A Simplified Computational Manual
 The Map Grid of Australia 1994 A Simplified Computational Manual The Map Grid of Australia 1994 A Simplified Computational Manual 'What's the good of Mercator's North Poles and Equators, Tropics, Zones
Importing ASCII Grid Data into GIS/Image processing software
 Importing ASCII Grid Data into GIS/Image processing software Table of Contents Importing data into: ArcGIS 9.x ENVI ArcView 3.x GRASS Importing the ASCII Grid data into ArcGIS 9.x Go to Table of Contents
Create a folder on your network drive called DEM. This is where data for the first part of this lesson will be stored.
 In this lesson you will create a Digital Elevation Model (DEM). A DEM is a gridded array of elevations. In its raw form it is an ASCII, or text, file. First, you will interpolate elevations on a topographic
WORLD WIND JAVA for MODIS FIRE PRODUCTS VISUALIZATION (WWJF)
") WORLD WIND JAVA for MODIS FIRE PRODUCTS VISUALIZATION (WWJF) User Manual, v 1.0, April 2011 Luigi Boschetti, Alexandra Moulden and Michael Humber Department of Geography, University of Maryland, College
WORLD WIND JAVA for MODIS FIRE PRODUCTS VISUALIZATION (WWJF) User Manual, v 1.0, April 2011 Luigi Boschetti, Alexandra Moulden and Michael Humber Department of Geography, University of Maryland, College
Review for Introduction to Remote Sensing: Science Concepts and Technology
 Review for Introduction to Remote Sensing: Science Concepts and Technology Ann Johnson Associate Director [email protected] Funded by National Science Foundation Advanced Technological Education program [DUE
CALCULATION OF CLOUD MOTION WIND WITH GMS-5 IMAGES IN CHINA. Satellite Meteorological Center Beijing 100081, China ABSTRACT
 CALCULATION OF CLOUD MOTION WIND WITH GMS-5 IMAGES IN CHINA Xu Jianmin Zhang Qisong Satellite Meteorological Center Beijing 100081, China ABSTRACT With GMS-5 images, cloud motion wind was calculated. For
An Introduction to Point Pattern Analysis using CrimeStat
 Introduction An Introduction to Point Pattern Analysis using CrimeStat Luc Anselin Spatial Analysis Laboratory Department of Agricultural and Consumer Economics University of Illinois, Urbana-Champaign
Slide 1. Slide 2. Slide 3
 Satellite Analysis of Sea Surface Temperatures in the Florida Keys to Monitor Coral Reef Health NASA Stennis Space Center Earthzine/DEVELOP Virtual Poster Session, Summer 2011 Video Transcript Slide 1
3D Visualization of Seismic Activity Associated with the Nazca and South American Plate Subduction Zone (Along Southwestern Chile) Using RockWorks
 Using RockWorks") 3D Visualization of Seismic Activity Associated with the Nazca and South American Plate Subduction Zone (Along Southwestern Chile) Using RockWorks Table of Contents Figure 1: Top of Nazca plate relative
3D Visualization of Seismic Activity Associated with the Nazca and South American Plate Subduction Zone (Along Southwestern Chile) Using RockWorks Table of Contents Figure 1: Top of Nazca plate relative
Hyperspectral Satellite Imaging Planning a Mission
 Hyperspectral Satellite Imaging Planning a Mission Victor Gardner University of Maryland 2007 AIAA Region 1 Mid-Atlantic Student Conference National Institute of Aerospace, Langley, VA Outline Objective
5200 Auth Road, Camp Springs, MD 20746 USA 2 QSS Group Inc, Lanham, MD, USA
 P6.25 CO-LOCATION ALGORITHMS FOR SATELLITE OBSERVATIONS Haibing Sun 2, W. Wolf 2, T. King 2, C. Barnet 1, and M. Goldberg 1 1 NOAA/NESDIS/ORA 52 Auth Road, Camp Springs, MD 2746 USA 2 QSS Group Inc, Lanham,
Information Contents of High Resolution Satellite Images
 Information Contents of High Resolution Satellite Images H. Topan, G. Büyüksalih Zonguldak Karelmas University K. Jacobsen University of Hannover, Germany Keywords: satellite images, mapping, resolution,
McIDAS-V - A powerful data analysis and visualization tool for multi and hyperspectral environmental satellite data
 McIDAS-V - A powerful data analysis and visualization tool for multi and hyperspectral environmental satellite data Thomas Achtor, Thomas Rink, Thomas Whittaker, David Parker and David Santek Space Science
Digital Terrain Model Grid Width 10 m DGM10
 Digital Terrain Model Grid Width 10 m Status of documentation: 23.02.2015 Seite 1 Contents page 1 Overview of dataset 3 2 Description of the dataset contents 4 3 Data volume 4 4 Description of the data
Lecture 2. Map Projections and GIS Coordinate Systems. Tomislav Sapic GIS Technologist Faculty of Natural Resources Management Lakehead University
 Lecture 2 Map Projections and GIS Coordinate Systems Tomislav Sapic GIS Technologist Faculty of Natural Resources Management Lakehead University Map Projections Map projections are mathematical formulas
MAIN_SNP_TOPO.dgm_2m
 Seite 1 von 7 MAIN_SNP_TOPO.dgm_2m SDE Raster Dataset Tags dgm_2m, dgm_gr_snp, dgm1177bis1258, dtm4, lomb_dtm_20, dem2_5_apb, dhm10, dem20_apb, dsm2_voralberg, dsm10_tirol Summary There is no summary for
Assessment Tasks Pass theory exams at > 70%. Meet, or exceed, outcome criteria for projects and assignments.
 CENTRAL OREGON COMMUNITY COLLEGE: GEOGRAPHIC INFORMATION SYSTEM PROGRAM 1 CENTRAL OREGON COMMUNITY COLLEGE Associate Degree Geographic Information Systems Program Outcome Guide (POG) Program Outcome Guide
ENVI Classic Tutorial: Atmospherically Correcting Multispectral Data Using FLAASH 2
 ENVI Classic Tutorial: Atmospherically Correcting Multispectral Data Using FLAASH Atmospherically Correcting Multispectral Data Using FLAASH 2 Files Used in this Tutorial 2 Opening the Raw Landsat Image
Near Real Time Blended Surface Winds
 Near Real Time Blended Surface Winds I. Summary To enhance the spatial and temporal resolutions of surface wind, the remotely sensed retrievals are blended to the operational ECMWF wind analyses over the
PART 1. Representations of atmospheric phenomena
 PART 1 Representations of atmospheric phenomena Atmospheric data meet all of the criteria for big data : they are large (high volume), generated or captured frequently (high velocity), and represent a
APPLY EXCEL VBA TO TERRAIN VISUALIZATION
 APPLY EXCEL VBA TO TERRAIN VISUALIZATION 1 2 Chih-Chung Lin( ), Yen-Ling Lin ( ) 1 Secretariat, National Changhua University of Education. General Education Center, Chienkuo Technology University 2 Dept.
Supervised Classification workflow in ENVI 4.8 using WorldView-2 imagery
 Supervised Classification workflow in ENVI 4.8 using WorldView-2 imagery WorldView-2 is the first commercial high-resolution satellite to provide eight spectral sensors in the visible to near-infrared
SMEX04 Land Use Classification Data
 Notice to Data Users: The documentation for this data set was provided solely by the Principal Investigator(s) and was not further developed, thoroughly reviewed, or edited by NSIDC. Thus, support for
The USGS Landsat Big Data Challenge
 The USGS Landsat Big Data Challenge Brian Sauer Engineering and Development USGS EROS [email protected] U.S. Department of the Interior U.S. Geological Survey USGS EROS and Landsat 2 Data Utility and Exploitation
Blender addons ESRI Shapefile import/export and georeferenced raster import
 Blender addons ESRI Shapefile import/export and georeferenced raster import This blender addon is a collection of 4 tools: ESRI Shapefile importer - Import point, pointz, polyline, polylinez, polygon,
2. VIIRS SDR Tuple and 2Dhistogram MIIC Server-side Filtering. 3. L2 CERES SSF OPeNDAP dds structure (dim_alias and fixed_dim)
") MIIC Server-side Filtering Outline 1. DEMO Web User Interface (leftover from last meeting) 2. VIIRS SDR Tuple and 2Dhistogram MIIC Server-side Filtering 3. L2 CERES SSF OPeNDAP dds structure (dim_alias
MIIC Server-side Filtering Outline 1. DEMO Web User Interface (leftover from last meeting) 2. VIIRS SDR Tuple and 2Dhistogram MIIC Server-side Filtering 3. L2 CERES SSF OPeNDAP dds structure (dim_alias
Cloud Masking and Cloud Products
 Cloud Masking and Cloud Products MODIS Operational Algorithm MOD35 Paul Menzel, Steve Ackerman, Richard Frey, Kathy Strabala, Chris Moeller, Liam Gumley, Bryan Baum MODIS Cloud Masking Often done with
WILD 3710 Lab 3: GIS Data Exploration Camp W.G. Williams
 WILD 3710 Lab 3: GIS Data Exploration Camp W.G. Williams -Laboratory- TAs and Lab Instructors: Chris McGinty [email protected] Office: JQL 146 Office Hours: W 2:30 3:30 or by appt. Alex Hernandez [email protected]
Image Registration. Using Quantum GIS
 Using Quantum GIS Tutorial ID: IGET_GIS_004 This tutorial has been developed by BVIEER as part of the IGET web portal intended to provide easy access to geospatial education. This tutorial is released
Automated Spacecraft Scheduling The ASTER Example
 Automated Spacecraft Scheduling The ASTER Example Ron Cohen [email protected] Ground System Architectures Workshop 2002 Jet Propulsion Laboratory The Concept Scheduling by software instead of
Geomatics Guidance Note 3
 Geomatics Guidance Note 3 Contract area description Revision history Version Date Amendments 5.1 December 2014 Revised to improve clarity. Heading changed to Geomatics. 4 April 2006 References to EPSG
Panoply I N T E R D Y N A M I K. A Tool for Visualizing NetCDF-Formatted Model Output
 I N T E R D Y N A M I K Panoply A Tool for Visualizing NetCDF-Formatted Model Output February, 2012 Based on Panoply Version 3.1.1 by Robert Schmunk, NASA Author: A.Seidenglanz, Uni Bremen User s Guide
MODIS IMAGES RESTORATION FOR VNIR BANDS ON FIRE SMOKE AFFECTED AREA
 MODIS IMAGES RESTORATION FOR VNIR BANDS ON FIRE SMOKE AFFECTED AREA Li-Yu Chang and Chi-Farn Chen Center for Space and Remote Sensing Research, National Central University, No. 300, Zhongda Rd., Zhongli
Measurement of the effect of biomass burning aerosol on inhibition of cloud formation over the Amazon
 Supporting Online Material for Koren et al. Measurement of the effect of biomass burning aerosol on inhibition of cloud formation over the Amazon 1. MODIS new cloud detection algorithm The operational
EXERCISE 6: CREATING A FUSION PROJECT PART 1
 Document Updated: January, 2009 Fusion ver2.65 First Return (pulse) density (above) and (IR Return) Intensity (below) images created from the lidar data. Introduction In the previous exercises you were
White Paper. PlanetDEM 30. PlanetObserver 25/11/2014 - Update
 White Paper PlanetDEM 30 PlanetObserver 25/11/2014 - Update PlanetObserver France www.planetobserver.com [email protected] Tel. +33 4 73 44 19 00 1. Introduction PlanetObserver presents PlanetDEM
Open Source Visualisation with ADAGUC Web Map Services
 Open Source Visualisation with ADAGUC Web Map Services Maarten Plieger Ernst de Vreede John van de Vegte, Wim Som de Cerff, Raymond Sluiter, Ian van der Neut, Jan Willem Noteboom 1 ADAGUC project Cooperative
Correcting the Lateral Response Artifact in Radiochromic Film Images from Flatbed Scanners
 Correcting the Lateral Response Artifact in Radiochromic Film Images from Flatbed Scanners Background The lateral response artifact (LRA) in radiochromic film images from flatbed scanners was first pointed
Introduction to Imagery and Raster Data in ArcGIS
 Esri International User Conference San Diego, California Technical Workshops July 25, 2012 Introduction to Imagery and Raster Data in ArcGIS Simon Woo slides Cody Benkelman - demos Overview of Presentation
Landsat Monitoring our Earth s Condition for over 40 years
 Landsat Monitoring our Earth s Condition for over 40 years Thomas Cecere Land Remote Sensing Program USGS ISPRS:Earth Observing Data and Tools for Health Studies Arlington, VA August 28, 2013 U.S. Department
Amy K. Huff Battelle Memorial Institute [email protected] BUSINESS SENSITIVE 1
 Using NASA Satellite Aerosol Optical Depth Data to Create Representative PM 2.5 Fields for Use in Human Health and Epidemiology Studies in Support of State and National Environmental Public Health Tracking
Core Imagery Product Guide. v. 2.0
 Core Imagery Product Guide v. 2.0 Disclaimer & Copyright Copyright 2014 DigitalGlobe, Inc. All rights reserved. The DigitalGlobe s Core Imagery Product Guide is purposely designed as a general guideline
ECMWF Aerosol and Cloud Detection Software. User Guide. version 1.2 20/01/2015. Reima Eresmaa ECMWF
 ECMWF Aerosol and Cloud User Guide version 1.2 20/01/2015 Reima Eresmaa ECMWF This documentation was developed within the context of the EUMETSAT Satellite Application Facility on Numerical Weather Prediction
SHOALS Toolbox: Software to Support Visualization and Analysis of Large, High-Density Data Sets
 SHOALS Toolbox: Software to Support Visualization and Analysis of Large, High-Density Data Sets by Jennifer M. Wozencraft, W. Jeff Lillycrop, and Nicholas C. Kraus PURPOSE: The Coastal and Hydraulics Engineering
AN OPENGIS WEB MAP SERVER FOR THE ESA MULTI-MISSION CATALOGUE
 AN OPENGIS WEB MAP SERVER FOR THE ESA MULTI-MISSION CATALOGUE T. Westin a, *, C. Caspar b, L. Edgardh a, L. Schylberg c a Spacemetric AB, Tingsv 19, 19161 Sollentuna, Sweden - [email protected] b ESA Esrin,
STAR Algorithm and Data Products (ADP) Beta Review. Suomi NPP Surface Reflectance IP ARP Product
 Beta Review. Suomi NPP Surface Reflectance IP ARP Product") STAR Algorithm and Data Products (ADP) Beta Review Suomi NPP Surface Reflectance IP ARP Product Alexei Lyapustin Surface Reflectance Cal Val Team 11/26/2012 STAR ADP Surface Reflectance ARP Team Member
STAR Algorithm and Data Products (ADP) Beta Review Suomi NPP Surface Reflectance IP ARP Product Alexei Lyapustin Surface Reflectance Cal Val Team 11/26/2012 STAR ADP Surface Reflectance ARP Team Member
Earth Coordinates & Grid Coordinate Systems
 Earth Coordinates & Grid Coordinate Systems How do we model the earth? Datums Datums mathematically describe the surface of the Earth. Accounts for mean sea level, topography, and gravity models. Projections
Software requirements * :
 Title: Product Type: Developer: Target audience: Format: Software requirements * : Data: Estimated time to complete: Fire Mapping using ASTER Part I: The ASTER instrument and fire damage assessment Part
UTILIZING GOOGLE EARTH AS A GIS PLATFORM FOR WEATHER APPLICATIONS
 UTILIZING GOOGLE EARTH AS A GIS PLATFORM FOR WEATHER APPLICATIONS Travis M. Smith 1,2 and Valliappa Lakshmanan 1,2 1 U. of Oklahoma/CIMMS; 2 NOAA/NSSL 1. Introduction Google Earth (formerly known as Keyhole;
GIS IN ECOLOGY: SPATIAL REFERENCING
 GIS IN ECOLOGY: SPATIAL REFERENCING Contents Introduction... 2 Coordinate Systems... 2 Map Projections... 3 Georeferencing... 5 Data Sources... 7 Tasks... 7 Undefined versus Unprojected Data... 7 Setting
Data Processing Flow Chart
 Legend Start V1 V2 V3 Completed Version 2 Completion date Data Processing Flow Chart Data: Download a) AVHRR: 1981-1999 b) MODIS:2000-2010 c) SPOT : 1998-2002 No Progressing Started Did not start 03/12/12
EPSG. Coordinate Reference System Definition - Recommended Practice. Guidance Note Number 5
 European Petroleum Survey Group EPSG Guidance Note Number 5 Coordinate Reference System Definition - Recommended Practice Revision history: Version Date Amendments 1.0 April 1997 First release. 1.1 June
MSDI: Workflows, Software and Related Data Standards
 MSDI: Workflows, Software and Related Data Standards By Andy Hoggarth October 2009 Introduction Leveraging SDI principles for hydrographic operational efficiency French INFRAGEOS example (SHOM - Service
SATELLITE IMAGES IN ENVIRONMENTAL DATA PROCESSING
 SATELLITE IMAGES IN ENVIRONMENTAL DATA PROCESSING Magdaléna Kolínová Aleš Procházka Martin Slavík Prague Institute of Chemical Technology Department of Computing and Control Engineering Technická 95, 66
Understanding Map Projections
 Understanding Map Projections Melita Kennedy ArcInfo 8 Copyright 1994, 1997, 1999, 2000 Environmental Systems Research Institute, Inc. All Rights Reserved. Printed in the United States of America. The
THE UNIVERSAL GRID SYSTEM
 NGA Office of GEOINT Sciences Coordinate Systems Analysis (CSAT) Phone: 314-676-9124 Unclassified Email: [email protected] March 2007 THE UNIVERSAL GRID SYSTEM Universal Transverse Mercator (UTM) Military
CBERS Program Update Jacie 2011. Frederico dos Santos Liporace AMS Kepler [email protected]
 CBERS Program Update Jacie 2011 Frederico dos Santos Liporace AMS Kepler [email protected] Overview CBERS 3 and 4 characteristics Differences from previous CBERS satellites (CBERS 1/2/2B) Geometric