Open Source Visualisation with ADAGUC Web Map Services
|
|
|
- Earl Jordan
- 10 years ago
- Views:
Transcription


1 Open Source Visualisation with ADAGUC Web Map Services Maarten Plieger Ernst de Vreede John van de Vegte, Wim Som de Cerff, Raymond Sluiter, Ian van der Neut, Jan Willem Noteboom 1

2 ADAGUC project Cooperative project finished end of 2009 Dissemination of atmospheric data to GIS community OGC webservices (WMS,WCS) for data in NetCDF4/HDF5 files Web portal: Layers from several services Download data through WCS interface WMS/WCS service component ADAGUC Product Standard for metadata; storage in NetCDF4/CF 2 Demo site: A good start! Atmospheric Data Access for the Geospatial User Community

3 ADAGUC server and viewer software Geographical information system to visualize netcdf files via the web Web Map Service and Web Coverage Service Developed at KNMI (2009 till present) Server: C++ application Viewer/Client: JavaScript application NetCDF4, HDF5 and OpenDAP Multi dimensional data supported! Can serve true color data (1 byte per channel, RGBA) Very fast nearest neighbour reprojection (C++) Both open source since 2013! Atmospheric Data Access for the Geospatial User Community 3
 Very fast nearest neighbour reprojection (C++) Both open source since 2013!")
 PNG images (small, 180Kb) Combined geographically 4 Data from MSGCPP:")
4 Web Map Services: From data to images + NetCDF Data (big, 5.5Gb) PNG images (small, 180Kb) Combined geographically 4 Data from MSGCPP:

5 Introduction to OGC services OGC Open Geospatial Consortium currently ~450 organizations standards for geospatial content and services GIS data sharing and processing Services used within the ADAGUC project: ADAGUC: Atmospheric Data Access for the Geospatial User Community, finished in 2009) Web Map Service (WMS) - for images Web Feature Service (WFS) - for vector data (features) Web Coverage Service (WCS) - for raster data (coverages) WMS is primarily for visualization WFS and WCS are for retrieval of data 5
 Web Coverage Service (WCS) - for raster data (coverages) WMS is primarily for visualization WFS and WCS are for")
 REST based: Compose an URL with key value pairs, and you will get an image!")

6 Web Map Service for visualizations Generates visualizations of geospatial data in the form of 2D images, suitable for transfer over the internet (JPG/PNG/GIF) REST based: Compose an URL with key value pairs, and you will get an image! Standard is developed and maintained by the Open Geospatial Consortium Generated images are geo-referenced Images from several sources can be easily combined Images have dimensions Time, elevation, member WMS services can be viewed in many web based clients OpenLayers, Leaflet, GoogleMaps, ADAGUC viewer, 6


7 WMS Requests - overview GetCapabilities GetMap GetLegendGraphic GetFeatureInfo 7

8 ADAGUC WMS Client: KNMI WMS viewer WMS GetMap WMS GetCapabilities WMS GetLegendGraphic WMS GetFeatureInfo 8 Data from Globemission: NOx emissions from GOME-2

9 Web Coverage Service WCS (similar to WMS) Similar to WMS, but returns data instead of images Returns observations in a regular spaced grid in many projections Generates data in geotiff, ascii, netcdf 3/4, HDF5, etc Web Map Service: images Web Coverage Service: data 9

10 ADAGUC Viewer WCS Client 10

11 Atmospheric data what s so special? Observations in space and time Point data for example observing stations Gridded data for example satellite or precipitation radar Model data: forecasts in time and space, usually starting from a certain reference time Usually gridded data ( fields ) Multidimensional data: Atmosphere is a 3D structure Time makes 4D Reference time makes 5D Ensembles make 6D 11
 Multidimensional data: Atmosphere is a 3D")
 Identify and compare data Locate data in space time as a function of other independent coordinate variables (time, latitude and")
12 Used data format: NetCDF4-CF NetCDF4 with Climate and Forecast conventions (CF conventions) Standard names, standard units ( Identify and compare data Locate data in space time as a function of other independent coordinate variables (time, latitude and longitude): OGC 12

13 Regular grids 13


14 Projected grids 14

15 Curvilinear grids 15

16 Point data 16

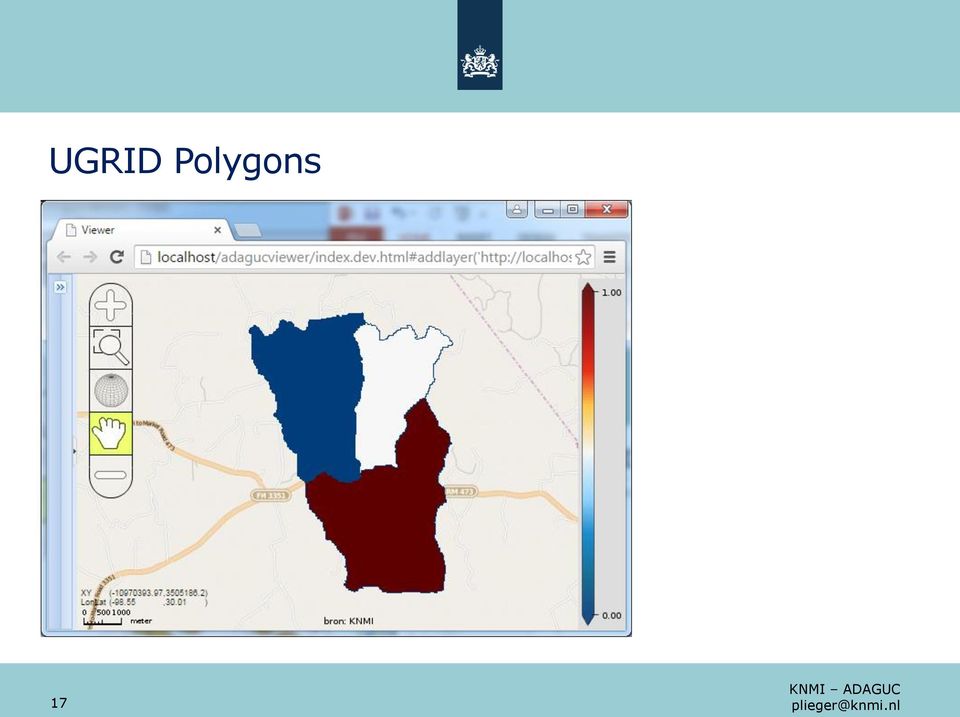
17 UGRID Polygons 17
18 True color RGBA images in NetCDF using uint type 18

19 OPeNDAP for data access and subsetting OPeNDAP is the name of the organization and the name of the protocol Open-source Project for a Network Data Access Protocol Data is stored at remote server Data model is similar to NetCDF s data model (with differences) N-dimensional array container, with variables, dimensions and attributes Only requested pieces of data are sent Accessing small pieces of large files on a remote server can still be quick Data is requested based on sub-setting along dimensions OPeNDAP resources can be opened locally on your computer as if it were local files using the NetCDF library Local files versus remote files is transparent The concept of a file is gone, an OPeNDAP endpoint can represent thousands of files aggregated along a dimension E.g. Usually concatenate a large time series observation to one endpoint using the time dimension 19

")
20 Data standards Work done on client Array based data Referenced data WCS Graphics WMS Data files HTTP / FTP Work done on server (de Boer & Plieger, 2014) 20


21 Coordinate systems and reprojection of data OGC 21
22 Projection, resizing & subsetting Meteosat HRVIS: Satellite view projection Resolution: 3520 x 4660 Radar precipitation: Polar stereographic projection Resolution: 700 x
23 Combined in Dutch Rijksdriehoekstelsel projection Dutch Rijksdriehoekstelsel Resolution: 1000 x Rendering time ~500ms
24 Questions? 24 Thanks all for watching!
OGC at KNMI: Current use and plans Available products
 OGC at KNMI: Current use and plans Available products Maarten Plieger KNMI R&D Ernst de Vreede, John van de Vegte, Wim Som de Cerff, Ian van der Neut, Raymond Sluiter, Jan Willem Noteboom Contents 1. ADAGUC
MSG Cloud Physical Properties retrieval and visualization
 MSG Cloud Physical Properties retrieval and visualization Jan Fokke Meirink Maarten Plieger John van de Vegte The MSG-CPP Project Goal: Provide an operational service for all products that are derived
ADAGUC & PyTROLL. Maarten Plieger Ernst de Vreede. Application of polar orbiter products in weather forecasting Using open source tools and standards
 Application of polar orbiter products in weather forecasting Using open source tools and standards ADAGUC & PyTROLL Maarten Plieger Ernst de Vreede Royal Netherlands Meteorological Institute (KNMI) R&D
DataTube: web services voor data
 DataTube: web services voor data Gerben de Boer Onno van de Akker Gerrit Hendriksen Deltares, Matroos Deltares, FEWS Deltares, NHI FEWS & Matroos: database > viewers VIEWER client 3 rd party viewer Matroos
Model examples Store and provide Challenges WCS and OPeNDAP Recommendations. WCS versus OPeNDAP. Making model results available through the internet.
 Making model results available through the internet. Fedor Baart, Gerben de Boer, Wim de Haas, Gennadiy Donchyts, Marc Philippart, Maarten Plieger September 14, 2011 Introduction Fedor Baart PhD thesis:
NetCDF and HDF Data in ArcGIS
 2013 Esri International User Conference July 8 12, 2013 San Diego, California Technical Workshop NetCDF and HDF Data in ArcGIS Nawajish Noman Kevin Butler Esri UC2013. Technical Workshop. Outline NetCDF
Scientific Data Management and Dissemination
 Federal GIS Conference February 9 10, 2015 Washington, DC Scientific Data Management and Dissemination John Fry Solution Engineer, Esri [email protected] Agenda Background of Scientific Data Management through
VISUAL INSPECTION OF EO DATA AND PRODUCTS - OVERVIEW
 WMS services from the EUMETSAT real-time Image Gallery Uwe Voges (1), Michael Schick (2), Udo Einspanier (1) (1) con terra GmbH Martin-Luther-King-Weg 24, 48155, Münster, Germany EMail: (U.Voges U.Einspanier)@conterra.de
The ORIENTGATE data platform
 Seminar on Proposed and Revised set of indicators June 4-5, 2014 - Belgrade (Serbia) The ORIENTGATE data platform WP2, Action 2.4 Alessandra Nuzzo, Sandro Fiore, Giovanni Aloisio Scientific Computing and
Data Visualization Using Web GIS Software
 Data Visualization Using Web GIS Software Tuomas Peltonen Radiation and Nuclear Safety Authority (STUK), Finland NKS NordDSS Workshop, Copenhagen, 1.-2.10.2009 RADIATION AND NUCLEAR SAFETY AUTHORITY Preface
CURSO Inspire INSPIRE. SPEAKER: Pablo Echamendi Lorente. JEUDI 23/ THURSDAY 23 rd W S V : G E O S P A T I A L D A T A A C C E S S
 CURSO Inspire JEUDI 23/ THURSDAY 23 rd SPEAKER: Pablo Echamendi Lorente WS 5 SCHEDULE WMS OVERVIEW ACTIONS OGC SPECIFICATIONS OTHER SERVICES OVERVIEW proposal: Member States shall establish and operate
EUMETSAT EO Portal. End User Image Access using OGC WMS/WCS services. EUM/OPS/VWG/10/0095 Issue <1> <14/01/2010> Slide: 1
 EUMETSAT EO Portal End User Image Access using OGC WMS/WCS services Slide: 1 Overview Introduction: status of data access and visualization EUMETSAT datasets Architecture Web Map Service implementation
Norwegian Satellite Earth Observation Database for Marine and Polar Research http://normap.nersc.no USE CASES
 Norwegian Satellite Earth Observation Database for Marine and Polar Research http://normap.nersc.no USE CASES The NORMAP Project team has prepared this document to present functionality of the NORMAP portal.
INTEROPERABLE IMAGE DATA ACCESS THROUGH ARCGIS SERVER
 INTEROPERABLE IMAGE DATA ACCESS THROUGH ARCGIS SERVER Qian Liu Environmental Systems Research Institute 380 New York Street Redlands, CA92373, U.S.A - [email protected] KEY WORDS: OGC, Standard, Interoperability,
PART 1. Representations of atmospheric phenomena
 PART 1 Representations of atmospheric phenomena Atmospheric data meet all of the criteria for big data : they are large (high volume), generated or captured frequently (high velocity), and represent a
Jozef Matula. Visualisation Team Leader IBL Software Engineering. 13 th ECMWF MetOps Workshop, 31 th Oct - 4 th Nov 2011, Reading, United Kingdom
 Visual Weather web services Jozef Matula Visualisation Team Leader IBL Software Engineering Outline Visual Weather in a nutshell. Path from Visual Weather (as meteorological workstation) to Web Server
DISMAR implementing an OpenGIS compliant Marine Information Management System
 DISMAR implementing an OpenGIS compliant Marine Information Management System Éamonn Ó T uama, Coastal & Marine Resources Centre, ERI, University College Cork. DISMAR DISMAR (Data Integration System for
Oklahoma s Open Source Spatial Data Clearinghouse: OKMaps
 Oklahoma s Open Source Spatial Data Clearinghouse: OKMaps Presented by: Mike Sharp State Geographic Information Coordinator Oklahoma Office of Geographic Information MAGIC 2014 Symposium April 28-May1,
J9.6 GIS TOOLS FOR VISUALIZATION AND ANALYSIS OF NEXRAD RADAR (WSR-88D) ARCHIVED DATA AT THE NATIONAL CLIMATIC DATA CENTER
 ARCHIVED DATA AT THE NATIONAL CLIMATIC DATA CENTER") J9.6 GIS TOOLS FOR VISUALIZATION AND ANALYSIS OF RADAR (WSR-88D) ARCHIVED DATA AT THE NATIONAL CLIMATIC DATA CENTER Steve Ansari * STG Incorporated, Asheville, North Carolina Stephen Del Greco NOAA National
J9.6 GIS TOOLS FOR VISUALIZATION AND ANALYSIS OF RADAR (WSR-88D) ARCHIVED DATA AT THE NATIONAL CLIMATIC DATA CENTER Steve Ansari * STG Incorporated, Asheville, North Carolina Stephen Del Greco NOAA National
The Arctic Observing Network and its Data Management Challenges Florence Fetterer (NSIDC/CIRES/CU), James A. Moore (NCAR/EOL), and the CADIS team
, James A. Moore (NCAR/EOL), and the CADIS team") The Arctic Observing Network and its Data Management Challenges Florence Fetterer (NSIDC/CIRES/CU), James A. Moore (NCAR/EOL), and the CADIS team Photo courtesy Andrew Mahoney NSF Vision What is AON? a
The Arctic Observing Network and its Data Management Challenges Florence Fetterer (NSIDC/CIRES/CU), James A. Moore (NCAR/EOL), and the CADIS team Photo courtesy Andrew Mahoney NSF Vision What is AON? a
Design Requirements for an AJAX and Web-Service Based Generic Internet GIS Client
 11th AGILE International Conference on Geographic Information Science 2008 Page 1 of 6 Design Requirements for an AJAX and Web-Service Based Generic Internet GIS Client Edward Nash 1, Peter Korduan 1,
Structure? Integrated Climate Data Center How to use the ICDC? Tools? Data Formats? User
 Integrated Climate Data Center? Data Formats?? Tools???? visits Structure???? User Contents Which Data Formats do we offer? What is the Structure of our data center? Which Tools do we provide? Our Aims
CLOUD BASED N-DIMENSIONAL WEATHER FORECAST VISUALIZATION TOOL WITH IMAGE ANALYSIS CAPABILITIES
 CLOUD BASED N-DIMENSIONAL WEATHER FORECAST VISUALIZATION TOOL WITH IMAGE ANALYSIS CAPABILITIES M. Laka-Iñurrategi a, I. Alberdi a, K. Alonso b, M. Quartulli a a Vicomteh-IK4, Mikeletegi pasealekua 57,
Open data. Noordzeedagen. Gerard van der Kolff
 Open data Noordzeedagen Gerard van der Kolff Data growth and -storage, what s new? Predicting the future is difficult... ...and mostly fails. The Digital Disruption has already happened Worlds largest
Interoperable Solutions in Web-based Mapping
 ISPRS SIPT IGU UCI CIG ACSG Table of contents Table des matières Authors index Index des auteurs Search Recherches Exit Sortir Interoperable Solutions in Web-based Mapping Marta Wojnarowska and Bridget
Standardized data sharing through an open-source Spatial Data Infrastructure: the Afromaison project
 Standardized data sharing through an open-source Spatial Data Infrastructure: the Afromaison project Yaniss Guigoz - University of Geneva/GRID-Geneva 1 EcoARM2ERA and AFROMAISON Why Afromaison in this
GOSIC NEXRAD NIDIS NOMADS
 NOAA National Climatic Data Center GOSIC NEXRAD NIDIS NOMADS Christina Lief NOAA/NESDIS/NCDC GOSIC Program Manager NOAA/NESDIS/NCDC Asheville, NC 28801 GEOSS AIP Phase 2 Workshop September 25-26, 2008
Institute of Computational Modeling SB RAS
 Institute of Computational Modeling SB RAS ORGANIZATION OF ACCESS TO OBSERVATIONAL DATA USING WEB SERVICES FOR MONITORING SYSTEMS THE STATE OF THE ENVIRONMENT Kadochnikov Aleksey A. Russia, Krasnoyarsk
DEVELOPMENT OF THE INTEGRATING AND SHARING PLATFORM OF SPATIAL WEBSERVICES
 DEVELOPMENT OF THE INTEGRATING AND SHARING PLATFORM OF SPATIAL WEBSERVICES Lan Xiaoji 1,2 Lu Guonian 1 Zhang Shuliang 1 Shi Miaomiao 1 Yin Lili 1 1. Jiangsu Provincial Key Lab of GIS Science, Nanjing Normal
Web-based spatio-temporal visualization and analysis of the Siberian Earth System Science Cluster (SIB-ESS-C)
") Web-based spatio-temporal visualization and analysis of the Siberian Earth System Science Cluster (SIB-ESS-C) Roman Gerlach Supervisor: Prof. C. Schmullius (Dept. of Geography, Friedrich-Schiller-University
Web-based spatio-temporal visualization and analysis of the Siberian Earth System Science Cluster (SIB-ESS-C) Roman Gerlach Supervisor: Prof. C. Schmullius (Dept. of Geography, Friedrich-Schiller-University
Web and Mobile GIS Applications Development
 Web and Mobile GIS Applications Development Presented by : Aamir Ali Manager Section Head (GIS Software Customization) Pakistan Space and Upper Atmosphere Research Commission (SUPARCO) Geographical Information
Managing a Geographic Database From Mobile Devices Through OGC Web Services
 Managing a Geographic Database From Mobile Devices Through OGC Web Services Nieves R. Brisaboa 1, Miguel R. Luaces 1, Jose R. Parama 1, and Jose R. Viqueira 2 1 Database Laboratory, University of A Coruña,
IDL. Get the answers you need from your data. IDL
 Get the answers you need from your data. IDL is the preferred computing environment for understanding complex data through interactive visualization and analysis. IDL Powerful visualization. Interactive
Nevada NSF EPSCoR Track 1 Data Management Plan
 Nevada NSF EPSCoR Track 1 Data Management Plan August 1, 2011 INTRODUCTION Our data management plan is driven by the overall project goals and aims to ensure that the following are achieved: Assure that
Description and Testing of the Geo Data Portal: A Data Integration Framework and Web Processing Services for Environmental Science Collaboration
 Description and Testing of the Geo Data Portal: A Data Integration Framework and Web Processing Services for Environmental Science Collaboration Open-File Report 2011 1157 U.S. Department of the Interior
UK Location Programme
 Location Information Interoperability Board Data Publisher How To Guide Understand the background to establishing an INSPIRE View Service using GeoServer DOCUMENT CONTROL Change Summary Version Date Author/Editor
Distributed Computing. Mark Govett Global Systems Division
 Distributed Computing Mark Govett Global Systems Division Modeling Activities Prediction & Research Weather forecasts, climate prediction, earth system science Observing Systems Denial experiments Observing
How To Use The Alabama Data Portal
 113 The Alabama Metadata Portal: http://portal.gsa.state.al.us By Philip T. Patterson Geological Survey of Alabama 420 Hackberry Lane P.O. Box 869999 Tuscaloosa, AL 35468-6999 Telephone: (205) 247-3611
Satellite Products and Dissemination: Visualization and Data Access
 Satellite Products and Dissemination: Visualization and Data Access Gregory Leptoukh GES DISC, NASA GSFC Dana Ostrenga GES DISC, NASA GSFC Introduction The Goddard Earth Sciences Data and Information Services
GIS AS A DECISION SUPPORT FOR SUPPLY CHAIN MANAGEMENT
 Paper Reference No.: PN-253 GIS AS A DECISION SUPPORT FOR SUPPLY CHAIN MANAGEMENT Sanjay Kumar 1 and Suneeta Agrawal 2 1. M. Tech. (GIS & Remote Sensing); GIS Cell; MNNIT, Allahabad, India (E-mail: [email protected])
 Integrated Data Viewer (IDV) a visualization framework Yuan Ho Unidata Program Center Boulder, CO Presentation Outline Integrated Data Viewer (IDV) overview The IDV features IDV examples and customized
Webservices Technological Evolutions. Peter Bogaert University of Ghent (Belgium) E Governement Academy 8 Geoservices 15 februari 2006 Kortrijk.
 E Governement Academy 8 Geoservices 15 februari 2006 Kortrijk.") Webservices Technological Evolutions Peter Bogaert University of Ghent (Belgium) Van Mainframe naar een gedistribueerd GIS Geographic Informationsystems From mainframe to distributed systems by means of
Webservices Technological Evolutions Peter Bogaert University of Ghent (Belgium) Van Mainframe naar een gedistribueerd GIS Geographic Informationsystems From mainframe to distributed systems by means of
DISMAR: Data Integration System for Marine Pollution and Water Quality
 DISMAR: Data Integration System for Marine Pollution and Water Quality T. Hamre a,, S. Sandven a, É. Ó Tuama b a Nansen Environmental and Remote Sensing Center, Thormøhlensgate 47, N-5006 Bergen, Norway
ArcGIS Framework Plug-In: Extending the ArcGIS Desktop for ANSI Standard Framework Data to Support Government Decision Making
 ArcGIS Framework Plug-In: Extending the ArcGIS Desktop for ANSI Standard Framework Data to Support Government Decision Making Final Project Report October 28, 2008 Agreement Number Organization Project
Geospatial exploitation Products. GXP WebView. Powered by the GXP Platform
 Geospatial exploitation Products GXP WebView Powered by the GXP Platform Exploitation Capabilities GXP WebView Powered by the GXP Platform Detailed annotation (text, points, lines, and polygons) Distance,
Sextant. Spatial Data Infrastructure for Marine Environment. C. Satra Le Bris, E. Quimbert, M. Treguer
 Sextant On-Line information system for marine geographical information E. Quimbert, M. Bellouis, F. Lecuy, M. Treguer Centre de Bretagne BP 70, Plouzané 29280 France E-mail: [email protected] Sextant
Combining Drupal Content Management System with OGC Web Services
 Combining Drupal Content Management System with OGC Web Services By Terefe Hanchiso Sodango (Haramaya University, Ethiopia) Dr. U.D. (Ulanbek) Turdukulov & Drs. B.J. (Barend) Köbben(University of Twente,
SuperGIS Server 3.2 Standard Edition Specification
 SuperGIS Server 3.2 Standard Edition Specification 20140826 Specification 1. All of the services support SOAP (Simple Object Access Protocol). 2. Use map file created by SuperGIS Desktop as map services
A Web Service based U.S. Cropland Visualization, Dissemination and Querying System
 A Web Service based U.S. Cropland Visualization, Dissemination and Querying System Rick Mueller, Zhengwei Yang, and Dave Johnson USDA/National Agricultural Statistics Service Weiguo Han and Liping Di GMU/Center
About scope of OpenGIS technology in oceanographic data management and visualization Andrey V. Golik, Vitaly K. Fischenko, Stepan G.
 About scope of OpenGIS technology in oceanographic data management and visualization Andrey V. Golik, Vitaly K. Fischenko, Stepan G. Antushev V.I.Il ichev Pacific Oceanological Institute Far-Eastern Branch
Data interchange between Web client based task controllers and management information systems using ISO and OGC standards
 Data interchange between Web client based task controllers and management information systems using ISO and OGC standards Michael Nørremark 1*, Ole Jørgensen 1, Jens Bligaard 2 and Claus G. Sørensen 1
MSDI: Workflows, Software and Related Data Standards
 MSDI: Workflows, Software and Related Data Standards By Andy Hoggarth October 2009 Introduction Leveraging SDI principles for hydrographic operational efficiency French INFRAGEOS example (SHOM - Service
StormSurgeViz: A Visualization and Analysis Application for Distributed ADCIRC-based Coastal Storm Surge, Inundation, and Wave Modeling
 : A Visualization and Analysis Application for Distributed ADCIRC-based Coastal Storm Surge, Inundation, and Wave Modeling Brian Blanton Renaissance Computing Institute University of North Carolina at
WCS as a Download Service for Big (and Small) Data
 Data") WCS as a Download Service for Big (and Small) Data INSPIRE 2013 Florence, Italy, 2013-jun-25 Peter Baumann 1, Stephan Meissl 2, Alan Beccati 1 1 Jacobs University rasdaman GmbH, Bremen, Germany 2 EOX GmbH,
WCS as a Download Service for Big (and Small) Data INSPIRE 2013 Florence, Italy, 2013-jun-25 Peter Baumann 1, Stephan Meissl 2, Alan Beccati 1 1 Jacobs University rasdaman GmbH, Bremen, Germany 2 EOX GmbH,
Version 3.0, April 16, 2012, updated for ArcGIS 10.0 Produced by the Geographic Information Network of Alaska http://www.gina.alaska.
 Using the AlaskaMapped Web Services in ESRI ArcGIS Version 3.0, April 16, 2012, updated for ArcGIS 10.0 Produced by the Geographic Information Network of Alaska http://www.gina.alaska.edu AlaskaMapped
Choosing the right GIS framework for an informed Enterprise Web GIS Solution
 13 ANNUAL INTERNATIONAL CONFERENCE AND EXHIBITION ON GEOSPATIAL INFORMATION TECHNOLOGY AND APPLICATIONS Epicentre; Gurgaon, India; 19-21 January, 2010 Choosing the right GIS framework for an informed Enterprise
The ORIENTGATE data platform
 Research Papers Issue RP0195 December 2013 The ORIENTGATE data platform SCO Scientific Computing and Operations Division By Alessandra Nuzzo University of Salento and Scientific Computing and Operations
TerraAmazon - The Amazon Deforestation Monitoring System - Karine Reis Ferreira
 TerraAmazon - The Amazon Deforestation Monitoring System - Karine Reis Ferreira GEOSS Users & Architecture Workshop XXIV: Water Security & Governance - Accra Ghana / October 2008 INPE National Institute
Quality Assessment for Geographic Web Services. Pedro Medeiros (1)
") Quality Assessment for Geographic Web Services Pedro Medeiros (1) (1) IST / INESC-ID, Av. Prof. Dr. Aníbal Cavaco Silva, 2744-016 Porto Salvo, [email protected] Abstract Being able to assess the
Quality Assessment for Geographic Web Services Pedro Medeiros (1) (1) IST / INESC-ID, Av. Prof. Dr. Aníbal Cavaco Silva, 2744-016 Porto Salvo, [email protected] Abstract Being able to assess the
GIS Initiative: Developing an atmospheric data model for GIS. Olga Wilhelmi (ESIG), Jennifer Boehnert (RAP/ESIG) and Terri Betancourt (RAP)
, Jennifer Boehnert (RAP/ESIG) and Terri Betancourt (RAP)") GIS Initiative: Developing an atmospheric data model for GIS Olga Wilhelmi (ESIG), Jennifer Boehnert (RAP/ESIG) and Terri Betancourt (RAP) Unidata seminar August 30, 2004 Presentation Outline Overview
GIS Initiative: Developing an atmospheric data model for GIS Olga Wilhelmi (ESIG), Jennifer Boehnert (RAP/ESIG) and Terri Betancourt (RAP) Unidata seminar August 30, 2004 Presentation Outline Overview
PERFORMANCE TESTING OF WEB MAP SERVICES IN THREE DIMENSIONS X, Y, SCALE
 , DOI: 10.2478/sjce-2013-0005 Dušan CIBULKA PERFORMANCE TESTING OF WEB MAP SERVICES IN THREE DIMENSIONS X, Y, SCALE Abstract Dušan CIBULKA Email: [email protected], [email protected] Research
Integrating AJAX Approach into GIS Visualization Web Services
 Integrating AJAX Approach into GIS Visualization Web Services Ahmet Sayar 1, 2, *, Marlon Pierce 1 1, 2, 3, 4 and Geoffrey Fox 1 Community Grids Lab, Indiana University, Bloomington, Indiana, 47404, USA
INPE Spatial Data Infrastructure for Big Spatiotemporal Data Sets. Karine Reis Ferreira (INPE-Brazil)
") INPE Spatial Data Infrastructure for Big Spatiotemporal Data Sets Karine Reis Ferreira (INPE-Brazil) INPE (Brazil) and Big Data I work at INPE (Brazilian National Institute for Space Research). Main gate
INPE Spatial Data Infrastructure for Big Spatiotemporal Data Sets Karine Reis Ferreira (INPE-Brazil) INPE (Brazil) and Big Data I work at INPE (Brazilian National Institute for Space Research). Main gate
HELCOM Data and Map Service. User Manual
 HELCOM Data and Map Service User Manual Version 2.2 - February 2015 1 Table of contents 1. General Information... 3 1.1 Background... 3 1.2 Technical requirements... 3 1.3 Contact... 3 2. Accessing HELCOM
TRMM and Other Global Precipitation Products and Data Services at NASA GES DISC. Zhong Liu George Mason University and NASA GES DISC
 TRMM and Other Global Precipitation Products and Data Services at NASA GES DISC Zhong Liu George Mason University and NASA GES DISC Outline Introduction of data and services at GES DISC TRMM and other
13.2 THE INTEGRATED DATA VIEWER A WEB-ENABLED APPLICATION FOR SCIENTIFIC ANALYSIS AND VISUALIZATION
 13.2 THE INTEGRATED DATA VIEWER A WEB-ENABLED APPLICATION FOR SCIENTIFIC ANALYSIS AND VISUALIZATION Don Murray*, Jeff McWhirter, Stuart Wier, Steve Emmerson Unidata Program Center, Boulder, Colorado 1.
Access to ESPON Database by third- party applications An expertise on the potentialities of web services for accessing the ESPON metadata and data
 Access to ESPON Database by third- party applications An expertise on the potentialities of web services for accessing the ESPON metadata and data UNEP/GRID- Geneva 27/06/2013 ABOUT THIS DOCUMENT A technical
Data and data product visualization in EMODNET Chemistry
 Data and data product visualization in EMODNET Chemistry Alexander Barth (1), Giorgio Santinelli (2), Gerrit Hendriksen (2), Jean-Marie Beckers (1) (1) University of Liège (Belgium), (2) Deltares (Netherlands)
Implementation of information system to respond to a nuclear emergency affecting agriculture and food products - Case of Morocco
 Centre National de l énergie des sciences et techniques nucléaires (CNESTEN-Morocco) Implementation of information system to respond to a nuclear emergency affecting agriculture and food products - Case
The THREDDS Data Repository: for Long Term Data Storage and Access
 8B.7 The THREDDS Data Repository: for Long Term Data Storage and Access Anne Wilson, Thomas Baltzer, John Caron Unidata Program Center, UCAR, Boulder, CO 1 INTRODUCTION In order to better manage ever increasing
County of Los Angeles. Chief Information Office Preferred Technologies for Geographic Information Systems (GIS) September 2014
 September 2014") County of Los Angeles Chief Information Office Preferred Technologies for Geographic Information Systems (GIS) September 2014 CIO Preferred Technologies for GIS This document lists the preferred Geographic
County of Los Angeles Chief Information Office Preferred Technologies for Geographic Information Systems (GIS) September 2014 CIO Preferred Technologies for GIS This document lists the preferred Geographic
Investigating Hadoop for Large Spatiotemporal Processing Tasks
 Investigating Hadoop for Large Spatiotemporal Processing Tasks David Strohschein [email protected] Stephen Mcdonald [email protected] Benjamin Lewis [email protected] Weihe
smespire - Exercises for the Hands-on Training on INSPIRE Network Services April 2014 Jacxsens Paul SADL KU Leuven
 smespire - Exercises for the Hands-on Training on INSPIRE Network Services April 2014 Jacxsens Paul SADL KU Leuven These exercises aim at people who already have some basic knowledge of INSPIRE Network
Visualizing Multi-Dimensional WMS within ArcGIS For JavaScript API
 Visualizing Multi-Dimensional WMS within ArcGIS For JavaScript API Data Prep: 1. Obtain a netcdf File with a time dimension and another dimension. For example depth, altitude 2. Open ArcGIS Desktop 3.
From Geoportal to Spatial Data Service Platform. Jani Kylmäaho National Land Survey of Finland Development Centre
 From Geoportal to Spatial Data Service Platform Jani Kylmäaho National Land Survey of Finland Development Centre 29.6.2012 Introduction National Land Survey of Finland - 1900 employees Development Centre
Primary author: Kaspar, Frank (DWD - Deutscher Wetterdienst), [email protected]
, Frank.Kaspar@dwd.de") Primary author: Kaspar, Frank (DWD - Deutscher Wetterdienst), [email protected] Co-authors: Johannes Behrendt (DWD - Deutscher Wetterdienst), Klaus-Jürgen Schreiber (DWD - Deutscher Wetterdienst) Abstract
Primary author: Kaspar, Frank (DWD - Deutscher Wetterdienst), [email protected] Co-authors: Johannes Behrendt (DWD - Deutscher Wetterdienst), Klaus-Jürgen Schreiber (DWD - Deutscher Wetterdienst) Abstract
Neues vom QGIS Server und QGIS-Webclient
 FOSSGIS 2012 Neues vom QGIS Server und QGIS-Webclient Pirmin Kalberer Sourcepole AG, Pfäffikon SZ www.sourcepole.ch Über Sourcepole > QGIS > Core dev. & Project Steering Commitee > Printing, QGIS Server,
The distribution of marine OpenData via distributed data networks and Web APIs. The example of ERDDAP, the message broker and data mediator from NOAA
 The distribution of marine OpenData via distributed data networks and Web APIs. The example of ERDDAP, the message broker and data mediator from NOAA Dr. Conor Delaney 9 April 2014 GeoMaritime, London
PDOK Kaart, the Dutch Mapping API
 PDOK Kaart, the Dutch Mapping API Haico van der Vegt*, Leo van der Sluijs* * Cadastre, Land Registry and Mapping Agency of the Netherlands Abstract. PDOK (public services on the map) is a partnership of
Overview of Data Visualization Tools. (Submitted by the Secretariat) Summary and Purpose of Document
 Summary and Purpose of Document") WORLD METEOROLOGICAL ORGANIZATION COMMISSION FOR BASIC SYSTEMS OPEN PROGRAMME AREA GROUP ON INTEGRATED OBSERVING SYSTEMS EXPERT TEAM ON SATELLITE UTILIZATION AND PRODUCTS SCOPE-Nowcasting Ad-hoc Steering
WORLD METEOROLOGICAL ORGANIZATION COMMISSION FOR BASIC SYSTEMS OPEN PROGRAMME AREA GROUP ON INTEGRATED OBSERVING SYSTEMS EXPERT TEAM ON SATELLITE UTILIZATION AND PRODUCTS SCOPE-Nowcasting Ad-hoc Steering
Product Description KNMI14 Daily Grids
 Product Description KNMI14 Daily Grids Dr. R. Sluiter De Bilt, July 2014 Technical report; TR-346 Product Description KNMI14 Daily Grids Version 1.0 Date July 2014 Status Final Colofon Title Product Description
Documentation of open source GIS/RS software projects
 Contract no. Workpackage Delivery Delivery Date 030776 WP1 D1.6 2007-07-02 CASCADOSS Development of a trans-national cascade training programme on Open Source GIS&RS Software for environmental applications
McIDAS-V - A powerful data analysis and visualization tool for multi and hyperspectral environmental satellite data
 McIDAS-V - A powerful data analysis and visualization tool for multi and hyperspectral environmental satellite data Thomas Achtor, Thomas Rink, Thomas Whittaker, David Parker and David Santek Space Science
Web Map Context Service for Adaptive Geospatial Data Visualization
 Web Map Context Service for Adaptive Geospatial Data Visualization Miloš Bogdanović, Danilo Vulović, Leonid Stoimenov INTRODUCTION Faculty of Electronic Engineering, University of Niš, Serbia {milos.bogdanovic,
AN OPENGIS WEB MAP SERVER FOR THE ESA MULTI-MISSION CATALOGUE
 AN OPENGIS WEB MAP SERVER FOR THE ESA MULTI-MISSION CATALOGUE T. Westin a, *, C. Caspar b, L. Edgardh a, L. Schylberg c a Spacemetric AB, Tingsv 19, 19161 Sollentuna, Sweden - [email protected] b ESA Esrin,
MrSID Plug-in for 3D Analyst
 LizardTech MrSID Plug-in for 3D Analyst User Manual Copyrights Copyright 2009 2010 LizardTech. All rights reserved. Information in this document is subject to change without notice. The software described
Developing of A GIS Based Enviromental Monitoring System with Open Source Softwares
 L. Kottyán, G. Nagy, A. Szepes Developing of A GIS Based Enviromental Monitoring System with Open Source Softwares Developing of A GIS Based Enviromental Monitoring System with Open Source Softwares László
What s new in Carmenta Server 4.2
 What s new in Carmenta Server 4.2 A complete solution for cost-effective visualisation and distribution of GIS data through web services Carmenta Server provides cost-effective technology for building
FME 2007 Release Giving Raster the Vector Treatment. By Mary Jo Wagner
 FME 2007 Release Giving Raster the Vector Treatment By Mary Jo Wagner Giving Raster the Vector Treatment By Mary Jo Wagner Spatial extract, transform and load (ETL) tools such as Safe Software s FME have
HTAP Data Network: Application Examples for NOx Analysis
 HTAP Data Network: Application Examples for NOx Analysis Collaborators: Rudolf Husar, Washington U. St. Louis Stefan Falke, Northrop, Wash U. Greg Leptoukh, NASA, Goddard Martin Schultz, FZJ, Juelich TF
Geographic Web Application
 University of L Aquila Department of Electrical and Information Engineering Geographic Web Application Enrico Ippoliti Building complete web applications This section discuss how to build complete web
 Development tools to create Web-GIS applications DbMAP ASJ the best solution to easily publish GIS data from existing spatial databases and distributed GIS data sources Easily designs, produces, and publishes
Integrated Climate Data Center How to use our data center? Integrated Climate Data Center - Remon Sadikni - [email protected]
 Integrated Climate Data Center How to use our data center? Contents Which Data Formats do we offer? Which Tools do we provide? What is the Structure of our data center? Data Formats Data Formats ASCII