Socialbakers Analytics User Guide
|
|
|
- Rosemary Ross
- 10 years ago
- Views:
Transcription
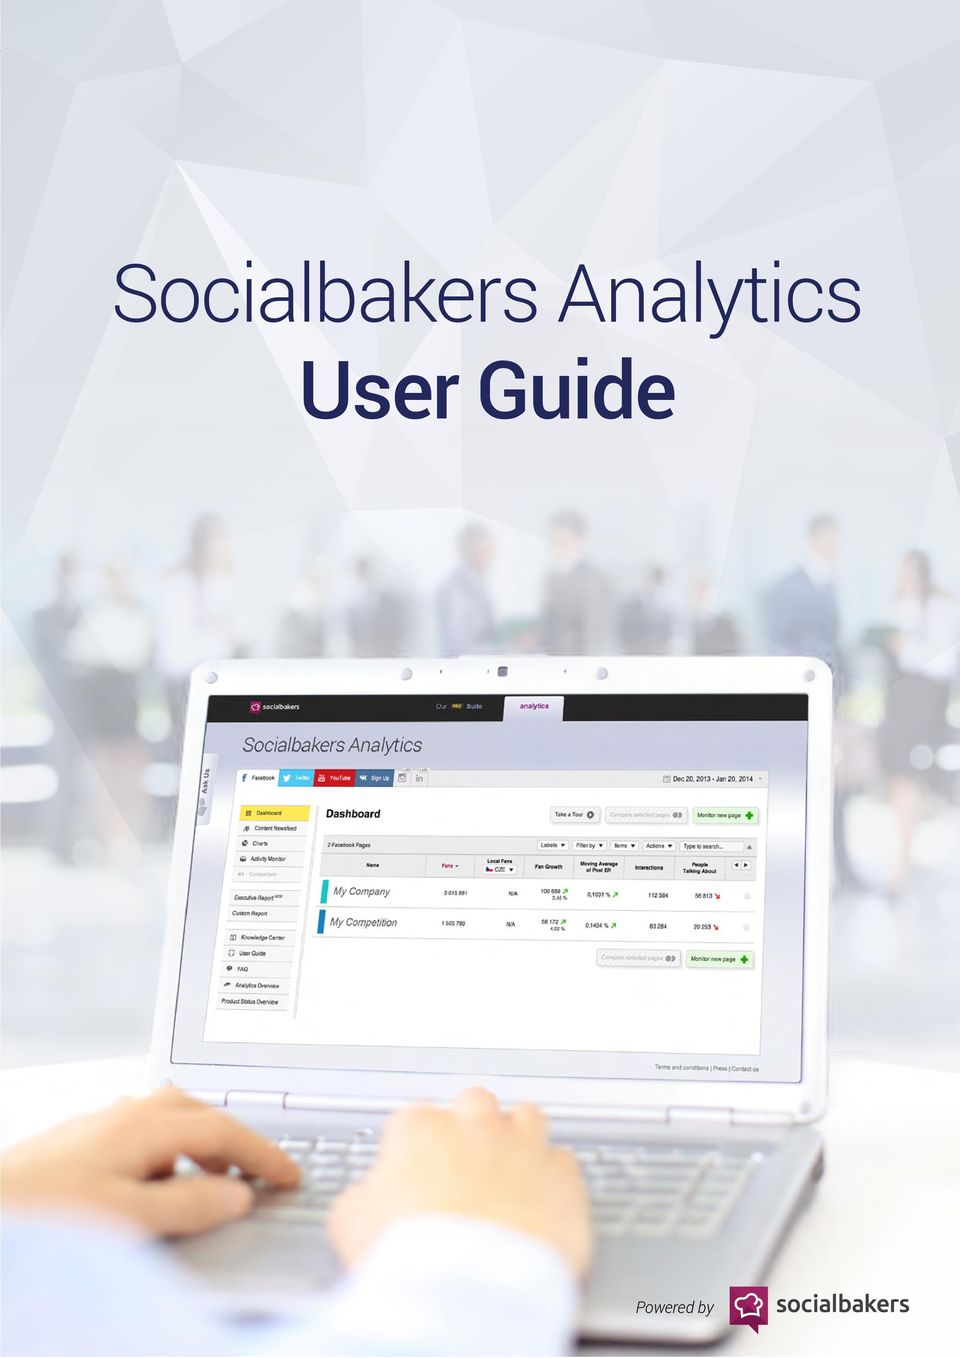
1 1 Socialbakers Analytics User Guide Powered by
2 2 Contents Getting Started Analyzing Facebook Ovierview of metrics Analyzing YouTube Reports and Data Export Social visits KPIs Fans and Fan Growth Analyzing the Posted Content Engagement Rate Response Rate Other Analyzing Twitter Overview of metrics Mobile Application LinkedIn, Instagram and VKontakte Contact

3 Getting started 3 Getting Started Get started by logging in to the application at via your Facebook Profile In the upper left menu, there are these platforms - Facebook, Twitter and YouTube (on demand, we also offer VKontakte if you are interested, please contact [email protected]). For each platform you can measure the performance of your and your competitors social media profiles/pages. Facebook Twitter YouTube 2 In each section, you can see a dashboard where you can add the pages that you want to monitor, an overview of the monitored pages, and the basic metrics for them. Monitor new page 3 In each section by clicking on Monitor new page, you can add any social media profile that you wish to monitor by pasting its URL. (Example: For Facebook pages do not forget to select the right time zone. If a brand is set to the wrong time zone, it can affect the data for all of the brandʼs metrics.

4 Getting started 4 4 After clicking on Labels, you can create your own labels representing your customized benchmarks. To filter the pages displayed in your Dashboard, click Or/And under the Select All/Deselect All box. You can now choose which industries you would like to gather analysis for. After filtering for the desired benchmark, click on the charts and you will see a comparison of the performance for pages within the benchmark. Item There are a whole slew of metrics to choose from when looking at your pages on the Dashboard. If youʼd like to change the number of visible metrics, go to the Items tab in your Dashboard. Actions You can delete pages, see a labelled view (categorized by the labels you created and applied on the monitored pages), and export data. If you would like to export all of the data from the Dashboard, go to the Actions menu and click on the Full Dashboard export button. We also offer a Full Data Export, which is a premium feature. If you would like to have access to the complete set of available data, please contact us at [email protected]

5 Getting started 5 Setting the Time Range 5 Set a time range in which you want to monitor the social media performance. Click on the icon next to the date and select your preferred time range. 6 Compare 2 pages: To compare 2 pages, tick on the dashboard the pages that you want to monitor and click on Compare selected pages.

6 Analyzing Facebook 6 Analyzing Facebook

7 Analyzing Facebook 7 Page Detail Once you click Page Detail, a menu will appear on the left hand side. On the right hand side, you can see graphs which depict the overall performance of the monitored page. Dashboard Here you will find the list of pages you are monitoring. You have the ability to add as many pages that are included in your Socialbakers Analytics package. Monitor competitors pages to compare your page to others in the industry. Content Newsfeed One of the most important roles of a social media manager is content optimization. If competitors are posting more engaging content, attempt to emulate their posts to increase your engagement rates and visibility. Charts This section provides additional comparative charts to allow you to easily compare and analyze further fan information. Activity Monitor The Activity Monitor allows you to see when a competitor launches a new tab or adds engaging content to one of their pages. General Info Gives you a quick overview of a selected page. Fans Detailed information about fan acquisition. Posts In-depth analysis of individual posts and general analysis of posts during a selected time frame. Engagement Rating Analysis of post engagement and fan activity data. Key Influencers Who are your key influencers? How active is your fan base? Response Rate In-depth analysis of your communication with your fans. Are you responding enough to your fan s posts? Executive report and Custom reports With this function, you can easily export all information into a visually-appealing PDF file or use CSV formatting to export each graph individually. Comparison Enables you to see a detailed comparison of two Facebook pages.

8 Analyzing Facebook 8 Benchmarking In Socialbakers Analytics you can find a broad scope of various benchmarks created by specific industries and across geographies. By comparing your performance to these benchmarks, you can evaluate your own results and set realistic future goals. First, just select on the dashboard your desired brand. After that, you will be redirected to the Page comparison where you can select a benchmark for comparison. An Overview of Metrics Socialbakers Analytics enables social media marketers to make informed decisions based on comparative social analysis of their performance across platforms, geographies, competitors, and industries. Let s have a look at the metrics that enable you to compare your social media performance against your competitors.

9 Analyzing Facebook 9 Social is not about one metric In your social media efforts, keep focusing on evaluating these 4 key groups of metrics using Socialbakers Analytics: Fans and Fan Growth Analyzing Posted Content Engagement Level of Social Customer Care Response Rate and Time Let s have a closer look at them...

10 Analyzing Facebook 10 Key Performance Indicators (KPIs) With the KPI Check, you can easily observe the most important key performance indicators. In form of a radar chart, you can compare your social media performance with your competitors, industry benchmarks, or your own customized benchmarks that you can create using labels. The metrics in KPI Check: Absolute change in Fans The absolute increase or decrease in the number of fans following a page during a selected time frame. Relative change in Fans The percentage increase or decrease in the number of fans following a page during a selected time frame. Admin Posts The number of posts that were posted by admin during a selected time frame. Average Page Engagement Rate The engagement rate of a page is calculated by averaging the engagement rate of all posts during a 30 day time range. Average Post Engagement Rate The engagement rate of a post is calculated as the number of likes, comments and shares made on a post divided by the total number of page fans during a 30 day time range. Total Interactions Shows the total Interactions (Likes, Comments and Shares) during a selected time range. User posts Shows the number of posts posted by users on a company s wall. Response Rate for Questions Shows the average percentage of user questions that the monitored page responded during the selected time range

11 Analyzing Facebook 11 Fans and Fan Growth The Fans Category section displays information about pages increase or decrease in fans. Offers pages total growth information, daily fan change, and whether a particular day had a significant increase or decrease in the number of fans. Fans Category Total Fans Shows the total number of fans and the percentage change in the number of fans during a selected time frame. Distribution of Fans Shows the distribution of countries that a Page s Fans are from. Growth of Total Fans Shows the number of fans gained or lost on a daily basis. You can also monitor the days that had the most significant increase or decrease in fans during a selected time range. By analyzing a particular day that had high Fan Growth, you can determine why a page increased their Fan/Follower Growth (i.e., engaging content, time of admin post, type of content). People Talking About (PTA) This is a Facebook metric that shows how many people are talking about your brand on a weekly basis. This section shows the daily PTA score and the days that experienced the highest and lowest PTA during a selected time range. Fan Growth by Day of the Week This shows aggregated fan growth data by day. The results help illustrate which days of the week your fan growth is highest. Fan Growth by Week Shows aggregated fan growth by week. This data shows which week your fan growth was greatest during a selected time range.

12 Analyzing Facebook 12 Distribution of Fans The Fans Category section displays information about pages increase or decrease in fans. Offers pages total growth information, daily fan change, and whether a particular day had a significant increase or decrease in the number of fans. With the metric Distribution of Fans, you can easily find out from which countries your audience is coming from and which markets are experiencing the greatest fan increase. This should help you to decide how to tailor posts and the time of posting so that the majority of your fans find your content engaging.

13 Analyzing Facebook 13 Analyzing Posted Content Posts Category The posts category analyzes posts made on a Facebook page. This category measures how many times the page administrator posted content, the number of fan posts made on the page wall, and the distribution of the types of content posted. Admin Posts and Fan Growth This shows the relationship between the number of admin posts and fan growth during a selected time range. The solid line represents fan growth and the bubbles on the line represent admin posts. Posts Made by Fans This graph shows the total number of fan posts made per day. This section also shows the total and average number of fan posts per day and the day that fans posted the most amount of times. Post Types This section shows the distribution of post types. Offers data about how often the admin posted links, statuses, photos, or videos. In Post Sentiment Overview and Post Sentiment Daily you will be able to access data based on sentiment that you assign to selected fan posts. All Posts See a general overview of all posts on a monitored page. Content newsfeed Content newsfeed is one of the most powerful features of Analytics. You can see particular posts of your and your competitors fan pages and the engagement rate of each post, the number of likes, comments, and shares! You can view these posts on Facebook as well and the comments of fans.

14 Analyzing Facebook 14 Content newsfeed You can filter the content by labels which you can create and apply on particular Facebook fan pages. You can even create and apply labels on individual posts in the newsfeed and then make a qualitative analysis about which content works best. You can filter the posts by post type. You can sort the posts by Engagement rate, Created time, and Number of Shares.

15 Analyzing Facebook 15 Engagement Rating Increasing the number of page fans is important for increasing your social media presence. However, if these Facebook users never return to your page after initially becoming a fan, then they are not viewing any future content that you are posting. For this reason, Socialbakers created a metric called engagement rate (ER), which measures how engaged your fans are with the content posted by the page admin. Engagement Rate (ER) The engagement rate is calculated as the number of likes, comments and shares made on a post divided by the total number of page fans. The engagement rate of a page is calculated by averaging the engagement rate of all posts during a selected time range. Average Post Engagement Rate Daily Page Engagement Rate # Likes + Comments + Shares on a given date # of wall posts made by page on a given date Total Fans on a given date # Likes + Comments + Shares on a given date Total Fans on a given date Moving Average of Engagement Rates This graph shows the engagement rate moving averages during a 7 or 30 day time range. Below are the formulas for two types of moving averages. Moving Average of Post ER Calculated as the sum of all Engagement Rates of posts that were made in the last 30 days divided by total posts made during that selected time period. Moving Average of Page ER Shows the evolution of both the 7 day and the 30 day moving average of the Daily Page Engagement Rate during a selected time range. It is calculated from the sum of all daily values of Daily Page Engagement Rates in the last 7 or 30 day period. Days with Daily Page Engagement Rates of 0 are excluded.
 The engagement rate is calculated as the number of likes, comments and shares made on a post divided by the total number of page fans.")
16 Analyzing Facebook 16 Most Engaging Post Types See which types of content a pages fans find most engaging. Are they links, statuses, photos, or videos? Total Interactions By Hour This will show you which hours of the day your fans are most engaged. This metric is helpful for determining when the page admin should post content. Daily Average Post Engagement Rate by Hour / Week These graphs show fan engagement by each hour over the course of the week. Facebook Likes, Comments and Shares by Day Will show you the amount of daily Facebook likes, comments and shares during a selected time range. Interactions by Post Type This shows the number of likes, comments and shares for each post type during a selected time range. User Activity A general overview to determine the times of day and the days of the week that fans are most engaged for a monitored page.

17 Analyzing Facebook 17 The key influencers section provides insight about your most active fans. This section details the number of interactions each key influencer has with your page and the time of their last activity with your page. Additionally, you can click on individual posts to see their comments.

18 Analyzing Facebook 18 Response Rate Response Rate and Response Time Good social media customer care has become a standard in the world of social media. Which metrics are the most important to observe? General Response Rate for User Questions / Posts This graph shows the percentage of user questions/posts the monitored page responded to versus the percentage of user questions that did not receive a response during the selected time range. A user question is a user post on the company s page that contains the question mark in one of several possible languages (English, Armenian, Arabic, Japanese, and others). User questions that were either marked as spam, hidden, or deleted by the admin are not included. Daily Response Rate For User Questions/Posts This graph shows the daily percentage of user questions/user posts the monitored page responded to during a selected time range. A user question is a user post on the company s page that contains the question mark in one of several possible languages (English, Armenian, Arabic, Japanese, and others). User questions/posts that were either marked as spam, hidden, or deleted by the admin are not included. Responded vs. Unresponded User Questions / User Posts This graph shows the daily number of responded and unresponded user questions / User posts. It also shows the daily percentage of user questions the monitored page responded to and average amount of time it took (in minutes) for the monitored page to respond to a user s question per day for a selected time range. A user question is a user post on the company s page that contains the question mark in one of several possible languages (English, Armenian, Arabic, Japanese, and others). User questions / posts that were either marked as spam, hidden, or deleted by the admin are not included. Response Time for User Questions / Posts This graph shows a breakdown of the time it took the monitored page to respond to a user question/post during a selected time range. This graph shows the relative distribution of page responses to user posts according to time needed for the page to reply. The following time intervals are used: under 10 minutes, minutes, 90 minutes-6 hours, 6-12 hours, hours, hours, or more than 72 hours. A user question is a user post on the company s page that contains the question mark in one of several possible languages (English, Armenian, Arabic, Japanese, and others). User questions / posts that were either marked as spam, hidden, or deleted by the admin are not included. Response Rate vs. Number of Questions / Posts This chart represents the monitored page s performance in responding to user questions / posts. The number of user questions is displayed on the X-axis and the Response Rate for user questions/posts is on the Y-Axis. A user question is a user post on the company s page that contains the question mark in one of several possible languages (English, Armenian, Arabic, Japanese, and others). User questions/posts that were either marked as spam, hidden, or deleted by the admin are not included.
.")
19 Analyzing Facebook 19 Labels and Charts Labels After clicking on Labels on the Dashboard you can create your own labels representing your customized benchmarks. To filter the pages displayed in your Dashboard, click Or/And under the Select All/Deselect All box. You can now choose which industries you would like to gather analysis for. After filtering out the desired benchmark, click on the charts and you will see the comparison of performance for the pages within the benchmark. Charts Section After selecting the correct labels for the pages that you are monitoring, you can begin to receive great comparative analysis of multiple pages throughout an industry. You will find this section in the menu on the left hand side. Check it out by clicking on the button Charts, After opening the chart section, you will see beautiful graphical charts which analyze KPIs like Fan Growth, Interactions, Engagement Rates, Response Rates and more!

20 Analyzing Facebook 20 Share of Fans This shows you the percentage share of fans amongst the labeled pages. The pie chart depicts the share of fans on the last day of the selected time range. You can add or delete pages which you want to have in this pie chart. Total Share of Interactions This pie chart shows the total number of interactions by percentage share during the selected time range. Response Rate vs. Number of Posts This graph illustrates how the page responds to their fans compared to the number of posts received from their fans. All brands should aim for being above the 65% ratio.

21 Analyzing Facebook 21 Fan Engagement and Wall Activity Fan s Engagement Here you will find a comparison of multiple pages 30 day moving average engagement rates. Wall Activity Index In this chart you can see a comparison of pages based on the number of fan posts divided by the number of fans on the last day of a selected time range. Other Page Swap Socialbakers Analytics allows you to swap pages on your dashboard. This feature is limited to the master user only. To remove one or more pages, select them on your dashboard, go into the Actions tab and click the Delete Pages button. You will be asked to confirm your selection. In this view, you also learn how many pages your subscription allows you to remove. If you should need to remove more pages than the subscription allows, you can reach out to your Account Manager or our Support team at support@socialbakers. com. Facebook Insights Facebook Insights bring the page administrators valuable perspective on the performance of the pages they manage. Socialbakers Analytics allows integration of the Insights data to offer greater detail of page analysis for the Pages you administrate.this can be done in three, easy steps. Find how to integrate the Facebook Insights here. If you have trouble with these steps, don t hesitate to contact our support team at [email protected].
22 Analyzing Twitter 22 Analyzing Twitter
23 Analyzing Twitter 23 Profile Detail Once you click on profile detail, a menu will appear on the left hand side. On the right hand side you will see graphs which depict the overall performance of the monitored profile. Dashboard Here you will find the list of profiles you are monitoring. You have the ability to add as many profiles that are included in your Socialbakers Analytics package. Monitor competitors profiles to compare your profile to others in the industry. Content Newsfeed One of the most important roles of a social media manager is content optimization. If competitors are tweeting more engaging content, attempt to emulate their tweets to increase your engagement rates and visibility. Comparision Enables you to see a detailed comparison of two Twitter profiles. Followers Detailed information about a profiles followers. Tweets In depth analysis of individual tweets and general analysis of tweets during a selected time range. Engagement Rate Analysis of tweet engagement and follower activity data. Key Influencers Who are your key influencers? How active is your follower base? Response Time In depth analysis of your communication with your followers. Do you respond enough to your follower s posts?
24 Analyzing Twitter 24 Overview of metrics General Overview Total Followers This shows the total number of Profile followers and the follower / following (FF) ratio during a selected time range. Growth of Total Followers This graph shows the daily increase (or decrease) in Followers during a selected time range. Also shows the average growth rate, and the day with the smallest and largest follower change. Total Following Shows the daily increase (or decrease) in the number of users a Profile is Following as well as the FF ratio during a selected time range. Growth of Total Following Shows you the daily increase (or decrease) in the number of users a Profile is Following during a selected time range. Also shows the average growth rate, and the day with the smallest and largest following change. Total Listed This shows the total number of public Lists the Profile is a member of during a selected time range. Also shows the daily increases and decreases of the total number of public Lists the Profile was a member of during a selected time range. Daily Growth of Total Listed Shows the daily increases and decreases of the total number of public Lists the Profile was a member of during a selected time range. Also shows the average growth, the days with the largest change and the days with the lowest change during a selected time range. Change of Followers by Day of the Week This graph shows the growth in total Followers for each day of the week during a selected time range. Tweets vs. Retweets This graph shows the actual value of tweets and retweets for a given day made by the Profile. It also shows the average number of tweets per day, the day with the highest number of tweets, the total number of retweets and the average number of retweets per day during the selected time range.
25 Analyzing Twitter 25 Tweets vs. Retweets vs. Replies Ratio This graph shows the actual value of tweets, retweets and replies for a given day made by the Profile during a selected time range. Tweets by Hour Shows the total number of tweets (tweets, retweets and replies) made by the Profile at each hour of the day during a selected time range. For example, if you have selected a four week time range, then the total tweets by hour for 9:00 AM would be the sum of all 9:00 AM tweets during the four week time range. Total Mentions Shows the total number of mentions the Profile received, the average number of mentions per day, and the day with the least and most amount of mentions during a selected time range. Average Tweet Engagement Rate Is calculated on a daily basis as the sum of all Engagement Rates of tweets that were made on a particular day divided by their count. Daily Profile Engagement Rate Is calculated on a daily basis as the sum of all Engagement Rates of tweets that were made on a particular day. Moving average of Tweet Engagement Rate This graph shows the evolution of both the 7 day and the 30 day moving average of the Tweet Engagement Rate during a selected time range. Calculated as the sum of all Engagement Rates of tweets that were made in the last 7 or 30 days divided by total tweets made during that selected time period. Moving average of Profile Engagement Rate This graph shows the evolution of both the 7 day and the 30 day moving average of the Daily Profile Engagement Rate during a selected time range. It is calculated from the sum of all daily values of Daily Profile Engagement Rates in the last 7 or 30 day period. Days with Daily Profile Engagement Rate of 0 are excluded.
26 Analyzing Twitter 26 Followers The followers section displays data about a monitored profiles increase or decrease in the number of followers. Total Followers Shows the growth in the total number of Profile Followers, total number of users the Profile is Following and the FF ratio during a selected time range. Growth of Total Followers Displays the daily increase (or decrease) in Followers, the days with largest and smallest changes and the the average change in Follower growth during a selected time range. Total Following This graph shows the daily increase (or decrease) in the number of users a Profile is Following during a selected time range. Growth of Total Following This graph shows the daily increase (or decrease) in the number of users a Profile is Following during a selected time range. Total Listed This shows the increase (or decrease) in the total number of users added or removed from the Profile s list during a selected time range. Daily Growth of Total Listed This graph shows the daily increase (or decrease) in total number of users added or removed from the Profile s list during a selected time range. Change of Followers by Day of the Week This shows aggregated follower growth data by day. The results help illustrate which days of the week your follower growth is highest.
27 Analyzing Twitter 27 Tweets The tweets category evaluates tweets of the monitored Twitter profile. It measures how many times the profile owner tweeted, retweeted or replied others as well as the number of mentions of the Twitter handle and the sources of the tweet. Tweets vs. Retweets vs. Replies This graph shows the actual value of tweets, retweets and replies for a given day made by the Profile during a selected time range. Tweets by Day of the Week Shows what days the Twitter handle tweeted the most and least often. Tweets by Hour Shows what hours of the day the Twitter handle tweeted the most and least often. Total Mentions Shows the total number of tweets that mention the Twitter handle, the average number of mentions per day and the days with the most and least mentions during a selected time range. Mentions by Day of the Week Shows what days the Twitter handle is mentioned the most and least often. Tweet Sources This graph shows the different applications the Profile used to post a tweet and the number of times times that application was used. Who is being Retweeted A list of people who you retweet most frequently. Who Retweets A list of followers that retweet you most frequently.
28 Analyzing Twitter 28 Engagement Rating Similar to Facebook, tweeting engaging content is critical for optimizing your Twitter communication. For this reason, the Twitter metric engagement rate allows you to measure the engagement rate of tweets. The engagement rate for Twitter is calculated as the number of replies and retweets divided by the number of tweets made by the monitored Twitter handle during a selected time range. Below you will find the formulas for measuring engagement rates on Twitter: Replies + Retweets on a given date TW average Tweet Engagement Rate # of tweets made by profile on a given date Total Followers on a given date TW daily Profile Tweet Engagement Rate Replies + Retweets on a given date Total Followers on a given date Engagement Rate Summary A general overview of the daily engagement rate. Data showing the average engagement rate and the days with the highest and lowest engagement rates during a selected time range. Moving Average of Tweet Engagement Rate This graph depicts how the engagement rate evolves during a selected time range. Average Tweet Engagement Rate by Hour This graph shows fan engagement by each hour over the course of the week. Average Tweet Engagement Rate by Day of the Week This graph shows what the Engagement Rate was for each day of the week during a selected time period. Distribution of Incoming Interactions This chart shows the number of replies, retweets and mentions other people made towards the monitored Twitter profile during a selected time range. Distribution of Outgoing Interactions This graph shows the number and type of Outgoing Interactions made by the Profile during a selected time range. The interaction can be a reply (a reply to a user s tweet made by the Profile), a retweet (retweet of a user s tweet made by the Profile), or a mention (mention of a user in the Profile s tweet).
29 Analyzing Twitter 29 Distribution of Incoming Interactions This graph shows the number and type of Incoming Interactions made about the Profile during a selected time range. Key Influencers The key influencers section provides insight about the most active followers of a monitored Twitter profile. This section details the number of interactions each key influencer has with your profile and the time of their last activity with your page. Additionally, you can click on individual tweets to see what they wrote.
30 30 Response Rate Good social media customer care has become a standard in the world of social media. Which metrics are the most important to observe? General Response Rate This graph shows the share of responded user s mentions, versus the share of not responded user s mentions, during a selected time range. Before October 1st, 2014, data was calculated only from organic mentions - those starting with symbol. From October 1st, we will include all mentions with anywhere in the Tweet. Data taken from before October 1st will be calculated according to the old formula. General Response Time This graph shows the distribution of Profile responses according to the time it takes for the Profile to respond to a user s mention during a selected time range. Before October 1st, 2014 the data was calculated from only organic mentions - mentions starting with symbol. From October 1st, we will include all mentions with anywhere in the Tweet. Data from before October 1st will stay calculated according to the old formula Total Organic Mentions The total number of organic mentions made about the Profile by users during a selected time range. Responded Organic Mentions The total number of organic mentions the Profile has responded to and the percentage of the responded organic mentions out of the total organic mentions during a selected period. Most Organic Mentions Responded on The day the Profile responded to the most organic mentions made by users during a selected time range and the number of responses on that day. Average Response Time The average amount of time it took for the Profile to respond to a user s organic mention during a selected time range Response Time for Questions This graph shows the distribution of Profile responses according to the time it takes for the Profile to respond to a user s mention that contains a question mark in one of several possible languages (English, Armenian, Arabic, Japanese, and others) during a selected time range. Before October 1st, 2014 the data was calculated only from organic mentions - mentions starting with symbol. From October 1st we will include all mentions with anywhere in the Tweet. Data from before October 1st will stay calculated according to the old formula. Total Questions This graph shows the total number of user s mentions that contain a question mark in one of several possible languages (English, Armenian, Arabic, Japanese, and others) during a selected time range. Before October 1st, 2014 the data was calculated only from organic mentions - mentions starting with symbol. From October 1st we will include all mentions with anywhere in the Tweet. Data from before October 1st will stay calculated according to the old formula.
31 31 Responded Questions The total number of questions to which the Profile has responded, and the percentage of responded questions out of total questions during a selected period. Questions are defined as mentions containing a question mark in one of several possible languages (English, Armenian, Arabic, Japanese, and others) during a selected time range. Before October 1st, 2014 the data was calculated only from organic mentions - mentions starting with symbol. From October 1st we will include all mentions with anywhere in the Tweet. Data from before October 1st will stay calculated according to the old formula. Most Questions Responded On The day the Profile responded to the most questions during a selected time range and the number of responses on that day. Questions are defined as mentions containing a question mark in one of several possible languages (English, Armenian, Arabic, Japanese, and others) during a selected time range. Before October 1st, 2014 the data was calculated only from organic mentions - mentions starting with symbol. From October 1st we will include all mentions with anywhere in the Tweet. Data from before October 1st will stay calculated according to the old formula. Average Response Time The average amount of time that it took for the Profile to respond to user s questions. Questions are defined as mentions containing a question mark in one of several possible languages (English, Armenian, Arabic, Japanese, and others) during a selected time range. Before October 1st, 2014 the data was calculated only from organic mentions - mentions starting with symbol. From October 1st we will include all mentions with anywhere in the Tweet. Data from before October 1st will stay calculated according to the old formula.
32 Analyzing Youtube 32 Analyzing YouTube
33 Analyzing Youtube 33 Overview of metrics Channel Detail Once you click channel detail, a menu will appear on the left hand side. On the right hand side you will see graphs which depict the overall performance of the monitored channel. The following metrics can be measured: Total Uploaded Video Views The total amount of Video Views on the last day of a selected time range. Growth of Total Uploaded Video Views The graph shows the total number of Video Views a channel receives per day during a selected time range. Additionally this section also shows the average channel views and the days with the largest and the smallest growth in the number of Video Views during a selected time range. Total Subscribers This shows the total number of channel Subscribers by day during a selected time range. The table below shows the total number of Subscribers to a channel on the last day of a selected time range as well as the the sum of all daily growth rates in the number of channel Subscribers. Growth of Total Subscribers This graph shows the daily increase or decrease in the total number of Subscribers to the channel during a selected time range. Additionally, this section shows the average growth and the days with the maximum change in the number of subscribers during a selected time range. Total Time Viewed The graph shows the total amount of time that users watched videos on this channel during a selected time range. In addition, this section shows the change in the amount of time users watched videos on this channel during a selected time range. This metric does not include views from private or removed videos of a channel.
34 Analyzing Youtube 34 Total Time Viewed Growth This growth shows the increase in total viewing time for a channel by day for a selected time range. Additionally the tables below will show you the average growth and the days with the largest and the smallest change in the amount of time a channel was viewed during a selected time range. This metric does not include views from private or removed videos of a channel. Total Channel Like/Dislike Ratio This graph shows the total number of Likes and Dislikes a channel has on a selected day. This is calculated by adding all Likes and Dislikes for each video of a channel. The table displays the average ratio and the days with the best and worse ratios during a selected time range. Evolution of Channel Like/Dislike Ratio This graph shows the evolution of a channel s Like/Dislike ratio over a selected time range. Absolute Growth of Channel Like/Dislike Ratio Shows the daily increase or decrease in Ratio of Likes and Dislikes. The growth is expressed in numerical values. Relative Growth of Channel Like/Dislike Ratio Shows the daily increase or decrease of the Ratio of Likes and Dislikes. The growth is expressed as a percentage. Channel Engagement Rate The YouTube Engagement Rate is calculated as the number of Likes, Dislikes and Comments divided by the number of Subscribers (on a selected day). Additionally it shows the average of all daily Engagement Rates over a selected period of time. Channel View Rate The YouTube channel View Rate is calculated as the number of Likes, Dislikes and Comments divided by the View Growth rates (on a selected day). Additionally it shows the average all View Rates during a selected time range. This metric does not include views from private or removed videos of a channel. Total Videos The graph shows the total number of Videos a channel has on a given day during a selected time period. In addition it shows the average number of Videos added to a channel by day as well as the day with the most amount of Videos added to a channel during a selected time range.
35 Reports and Data Export 35 Reports and data export
36 Reports and Data Export 36 How can I export data from my account? You can easily create Custom reports and Executive Reports with an overview of the results of your social media performance compared to either another page or an entire industry benchmark. On the dashboard, you can export data from the full dashboard or only for selected pages. You can also export data by clicking on the icon located above each graph.
37 Reports and Data Export 37 Custom Report The Custom Report section allows you to easily export all information into one PDF file or use our CSV form and export each graph individually. Executive Reports Executive Reports can help you to compare yourself against your competitors with visually appealing and easy-to-understand charts; they give you a quick summary of 2 brands (usually your own and a competitor s brand), compared to other brands in your industry. It arranges the data in a simple way that you can use for yourself, for your co-workers, your boss, or your employees. Generate this report with only a few clicks. Click on the tab, Executive Report, in menu to use this feature. Selecting Pages, Labels & Time After that select the Page(s) that you would like visual analysis for. In order to get accurate benchmarking data, it is important to select the correct label for comparative purposes. Then pick the time range that you would like to run the report for. Lastly, click the Generate PDF and receive your instant report via .
38 Reports and Data Export 38 Executive Reports - Overview Overall Performance Compare two Pages to see how they are performing to other Pages you are monitoring in your dashboard Fan Growth Executive reports provides metrics on Fan Growth, Total Fans and the Country Distribution of Fans. Benchmarking Analysis Make sure to select the appropriate label in order to set up proper benchmarking analysis. Engagement Rates On the right you can see information about the most engaging post times, Fan interaction data and Posts shared by Fans
39 Reports and Data Export 39 Post Engagement Rates Make sure not to miss out on important engagement analysis. Response Rates Quickly find out how your Page is performing to competitors. Most Engaging Post Overview Make sure to check out all interaction and engagement data about the most popular posts of a Page during a selected time range.
40 Mobile Application 40 Mobile Application Using our mobile application, you can easily benchmark your brand s performance against competitors or your industry, looking into all of your most vital KPIs. How to do it? Firstly, you have to download the app in AppStore or as an Android App here Create a new set Select pages that you want to add to the set Select the desired time range And then choose the graphs you want to display After that, your report is ready for viewing
41 LinkedIN, Instagram and VKontakte 41 LinkedIN and Instagram By clicking on the icon of Instagram and LinkedIN LABS, you will be redirected to a landing page where you can access the application for monitoring these 2 platforms. You just need to add the company social profiles you desire. After that, you will be able to receive visually appealing PowerPoint reports with powerful social media metrics. Facebook Twitter YouTube VK.com Social Visits If you are interested in accessing either of these applications, please contact your account manager or [email protected]. VKontakte VKontakte is the most popular social network on Russian-speaking markets. If your company is active there, it is a must to be present there. If you are interested in monitoring your social media performance on this platform, please contact [email protected].
42 Social Visits 42 Social Visits Social Visits is an add-on tool to Analytics that monitors the correlation between website traffic and social media interactions on Twitter and Facebook. The tool helps you to see how your social media performance affects the number of visits to your website from Facebook and Twitter, and therefore helps you to better optimize your social media activities. Facebook Twitter YouTube VK.com Social Visits At the top of the dashboard, click on the Social Visits tab. Once in the tool, connect to your Google account. After you re connected, you can add your Facebook and/or Twitter accounts as well. Your accounts will be authorized and added. Up to three graphs will be available, depending on whether you ve connected to Facebook, Twitter, or both. Note Facebook & Twitter visits are calculated by the number of times a user visits a website via one of these social networks.
43 Socialbakers contact 43 We hope you enjoyed the Socialbakers Analytics User Guide! If you have any further questions, please do not hesitate to contact us. You can reach our support team at Contact Social Media Experts Get more information at analytics.socialbakers.com
Measure Social Media like a Pro: Social Media Analytics Uncovered SOCIAL MEDIA LIKE SHARE. Powered by
 1 Measure Social Media like a Pro: Social Media Analytics Uncovered # SOCIAL MEDIA LIKE # SHARE Powered by 2 Social media analytics were a big deal in 2013, but this year they are set to be even more crucial.
Builder 2.0 Guide and Walkthrough
 Builder 2.0 Guide and Walkthrough Getting Started Get started with Builder 2.0 by logging in to the application via your Facebook. Once you have logged into the application, the main dashboard will appear.
Social Media Analytics, from Data to Deliverables. REQUEST A FREE TRIAL. Visit www.simplymeasured.com or call 855-530-6040
 Social Media Analytics, from Data to Deliverables. REQUEST A FREE TRIAL Visit or call 855-530-6040 Measure all your social media channels in one place Analyze the performance of your social profiles with
6 TWITTER ANALYTICS TOOLS. SOCIAL e MEDIA AMPLIFIED
 6 TWITTER ANALYTICS TOOLS SOCIAL e MEDIA AMPLIFIED 2 WHY USE TWITTER ANALYTICS TOOLS? Monitor and analysing Twitter projects are key components of Twitter campaigns. They improve efficiency and results.
Create Beautiful Reports with AWR Cloud and Prove the Value of Your SEO Efforts
 Create Beautiful Reports with AWR Cloud and Prove the Value of Your SEO Efforts It can be difficult sometimes to show your clients the value that they get from your service. Your job, as an SEO, is to
Executive Dashboard. User Guide
 Executive Dashboard User Guide 2 Contents Executive Dashboard Overview 3 Naming conventions 3 Getting started 4 Welcome to Socialbakers Executive Dashboard! 4 Comparison View 5 Setting up a comparison
5 Tips For Setting Measurable. Social Media Goals. 5 Tips for Measurable social media goals
 5 Tips For Setting Measurable Social Media Goals 1 introduction Five practical tips for setting measurable social media goals Social media participation has become a must for businesses today. A survey
Easy Social Media Management with Hootsuite
 Easy Social Media Management with Hootsuite Hootsuite is the largest social media integration and management platform on the Internet. It has sent over 700 million messages to date and has over 3 million
MEMBER SOCIAL MEDIA SETUP GUIDEBOOK
 MEMBER SOCIAL MEDIA SETUP GUIDEBOOK I n t r o d u c t i o n The use of social media to support Have the Talk of a Lifetime SM Social media has become a part of everyone s life and provides a powerful platform
Take Advantage of Social Media. Monitoring. www.intelligencepathways.com
 Take Advantage of Social Media Monitoring WHY PERFORM COMPETITIVE ANALYSIS ON SOCIAL MEDIA? Analysis of social media is an important part of a competitor overview analysis, no matter if you have just started
SOCIAL LISTENING AND KPI MEASUREMENT Key Tips for Brands to Drive Their Social Media Performance
 SOCIAL LISTENING AND KPI MEASUREMENT Key Tips for Brands to Drive Their Social Media Performance With social media marketing, the power is derived from being able to directly communicate with consumers
1 www.socialscoup.com
 www.socialscoup.com 1 Index Revision History Revision Date Description 01 Jan 2015 Socialscoup User Guide 1.0.1 Contents 1. Login 6 1.1 Using Facebook 6 1.2 Using Google+ 7 1.3 Using Registered mail id
5 TIPS FOR SETTING MEASURABLE SOCIAL MEDIA GOALS
 TIP SHEET 5 TIPS FOR SETTING MEASURABLE SOCIAL MEDIA GOALS Social media participation has become a must for businesses today. A survey by CMO in February 2012 revealed that marketers expect to spend almost
Speaker Monique Sherrett
 Speaker Monique Sherrett Monique Sherrett has a passion for all things digital, in particular using analytics to measure and improve marketing communications. She began her career as the web marketing
Impressive Analytics
 Impressive Analytics and Insight on a Shoestring Lisa Ikariyama & Tracy Anderson Cabbage Tree Creative www.cabbagetree.co.nz Getting Started Before you design a page on your website or get started with
Socioboard. User Guide 2.1
 Socioboard User Guide 2.1 Index Revision History Revision Date Description 01 Jan 2014 Socioboard User Guide 1.0.1 02 Jun 2014 Socioboard User Guide 1.0.2 03 Oct 2014 Socioboard User Guide 2.0 04 April
What You Need to Know Before Distributing Your Infographic
 What You Need to Know Before Distributing Your Infographic Improve your audience outreach efforts by learning why and how to use the best social, owned and earned platforms available. Targeting specific
>>> SOCIAL MEDIA MARKETING ROI CHEATSHEET 40 WAYS TO MEASURE YOUR SOCIAL MEDIA ROI. we inspire people to take action
 >>> SOCIAL MEDIA MARKETING ROI CHEATSHEET 40 WAYS TO MEASURE YOUR SOCIAL MEDIA ROI we inspire people to take action OBJECTIVE KPI METRIC + REVENUE SALES LEADS CUSTOMERS WEBSITE CONVERSIONS - COSTS STAFF
Social media 101. Social Enterprise East of England: Boot Camp. 5 June 2014
 Social media 101 Social Enterprise East of England: Boot Camp 5 June 2014 Programme How you can build a great personal social media presence Social media strategy essentials How to measure success Community
Technology for Small Business
 Technology for Small Business Steinar Knutsen February 2015 Agenda Importance of Online Marketing Online Marketing Blueprint Social Media Networks Tools of the Trade 2 Every 1 Second on the Internet Source:
A Marketer's Guide. to Facebook Metrics
 A Marketer's Guide to Facebook Metrics 2 Whether you ve invested big in social or are starting to consider a new strategy for 2014, one of the key aspects to think about is social media metrics - namely
IFF SOCIAL MEDIA GUIDE
 IFF SOCIAL MEDIA GUIDE 2014 INTERNATIONAL Table of content Social Media in short:...2 Basic Social Media Guidelines...2 Social Media Use Policy in short...3 The Golden Rules of Social Marketing (Marketo)...4
Social Media, How To Guide for American Express Merchants
 Social Media, How To Guide for American Express Merchants americanexpress.com.au/merchant How to use Social Media successfully for small independent businesses 1 Contents Introduction - Page 3 1. What
SETTING UP THE NEW FACEBOOK BUSINESS PAGE DESIGN
 SETTING UP THE NEW FACEBOOK BUSINESS PAGE DESIGN CREATIVE After logging in and accessing your Facebook business page as an administrator, you ll be presented with the following message: Start Tour: Click
Content. Basic Navigation Dashboard Leads Contacts Deals Documents Tasks Emails Voice Reports Mobile M A O B C J D E
 Base Guide Content The purpose of this deck is to give you a better understanding of the basic features of Base CRM. M A O B C J D E F Basic Navigation Dashboard Leads Contacts Deals Documents Tasks Emails
Facebook Page Management for Beginners Training Manual
 Facebook Page Management for Beginners Training Manual Contents 1.0 Executive Summary... 4 2.0 Introduction to Facebook... 4 2.1 Facebook Statistics... 4 2.2. Facebook Pages... 5 2.3 Facebook Demographics...
Contents. Meltwater Quick-Start Guide
 Meltwater Quick-Start Guide Contents Introduction... 2 Meltwater at a Glance... 2 Logging in... 3 Account Management... 3 Searches... 4 Keyword Search... 6 Advanced Search... 7 Source Selections... 9 Inbox...
Inbound Digital Marketing Proposal Webfactories
 Inbound Digital Marketing Proposal Webfactories Prepared For Sample Company SAMPLE COMPANY Created By Richie Parsotan Webfactories [email protected] http://www.webfactories.biz Proposal Letter Sample
How NewZapp Track can help your Email Marketing
 How NewZapp Track can help your Email Marketing NewZapp s Track Reporting system allows you to see your campaign results in real time. Not just the opens and clicks but also Twitter and Facebook shares
Social Media. Marketing Guide B2B
 Social Media Marketing Guide B2B Introduction Social media has revolutionised how people communicate and consume information online. By harnessing the power of the social media buzz and effectively incorporating
Paul Mosenson, Founder of NuSpark Marketing
 Paul Mosenson, Founder of NuSpark Marketing For sales and business development people to find and nurture prospects through social media For marketing people to support the sales efforts by providing content,
Social Media Measurement Meeting Robert Wood Johnson Foundation April 25, 2013 SOCIAL MEDIA MONITORING TOOLS
 Social Media Measurement Meeting Robert Wood Johnson Foundation April 25, 2013 SOCIAL MEDIA MONITORING TOOLS This resource provides a sampling of tools available to produce social media metrics. The list
Social Media Marketing Strategies
 Social Media marketing.ca.uky.edu LISTEN FIRST and visit your wall or feed and begin to build a list of people you want to follow. and research who is talking about the organization, county, events, people.
White Paper Series: Social Media
 Measuring Social Media How to Determine the Combined Impact of Social Media Engagement 8136 Old Keene Mill Road, Suite A-207, Springfield, Virginia 22152 / 703.451.8675 Social Media Engagement Online Goals
Using Google Analytics
 Using Google Analytics Overview Google Analytics is a free tracking application used to monitor visitors to your website in order to provide site designers with a fuller knowledge of their audience. At
Starting User Guide 11/29/2011
 Table of Content Starting User Guide... 1 Register... 2 Create a new site... 3 Using a Template... 3 From a RSS feed... 5 From Scratch... 5 Edit a site... 6 In a few words... 6 In details... 6 Components
Social Marketing & Reputation Management
 Social Marketing & Reputation Management > TOUCH POINTS 1. 2. 3. Customer Behavior General Facts and Trends Value of each Platform & Opportunities > WHERE DO YOU BEGIN? > GET REAL ABOUT SOCIAL MEDIA Social
Broadcast Yourself. User Guide
 Broadcast Yourself User Guide 2015 American Institute of CPAs. All rights reserved. DISCLAIMER: The contents of this publication do not necessarily reflect the position or opinion of the American Institute
Social media 101. Fuse Social Media Content Development Brand Experience
 Social media 101 Fuse Social Media Content Development Brand Experience OMD Building, 33 College Hill, Auckland 1011, New Zealand E: [email protected] P: +64 9 352 3019 W: www.nz.fuseint.com
Executive Dashboard Cookbook
 Executive Dashboard Cookbook Rev: 2011-08-16 Sitecore CMS 6.5 Executive Dashboard Cookbook A Marketers Guide to the Executive Insight Dashboard Table of Contents Chapter 1 Introduction... 3 1.1 Overview...
5 Point Social Media Action Plan.
 5 Point Social Media Action Plan. Workshop delivered by Ian Gibbins, IG Media Marketing Ltd ([email protected], tel: 01733 241537) On behalf of the Chambers Communications Sector Introduction: There
WHITE PAPER Closing the Loop on Social Leads. A Hootsuite & 2DiALOG HubSpot White Paper
 WHITE PAPER Closing the Loop on Social Leads A Hootsuite & 2DiALOG HubSpot White Paper Closing the Loop on Social Leads A Guide to Measuring Social Media Lead Generation Social media has outgrown its infancy
Implementation Guide. Implementation set up: Configure your channel. Implementation customization: Enable your social profiles
 Implementation Guide Welcome to the Buddy Media social marketing suite! Now that your channel and admin account have been created, this guide walks through the steps to configure your channel, users and
[REFERENCES] newsroom.fb.com/company-info http://www.searchenginejournal.com/facebook-reaches-1-39b-monthly-active-users
![[REFERENCES] newsroom.fb.com/company-info http://www.searchenginejournal.com/facebook-reaches-1-39b-monthly-active-users](/thumbs/30/13957467.jpg "[REFERENCES] newsroom.fb.com/company-info http://www.searchenginejournal.com/facebook-reaches-1-39b-monthly-active-users") 1 2 3 [REFERENCES] newsroom.fb.com/company-info http://www.searchenginejournal.com/facebook-reaches-1-39b-monthly-active-users 4 [REFERENCES] https://about.twitter.com/company 5 [REFERENCES] https://press.linkedin.com/about-linkedin
1 2 3 [REFERENCES] newsroom.fb.com/company-info http://www.searchenginejournal.com/facebook-reaches-1-39b-monthly-active-users 4 [REFERENCES] https://about.twitter.com/company 5 [REFERENCES] https://press.linkedin.com/about-linkedin
Dean College Social Media Handbook
 Dean College Social Media Handbook Goals of this Handbook To help Dean College employees and groups engage with social media in constructive and fun ways while contributing to the overall goals of the
User s Guide Microsoft Social Engagement 2015 Update 1
 User s Guide Microsoft Social Engagement 2015 Update 1 Version 2.0 1 This document is provided "as-is". Information and views expressed in this document, including URL and other Internet Web site references,
Social Media Monitoring: Engage121
 Social Media Monitoring: Engage121 User s Guide Engage121 is a comprehensive social media management application. The best way to build and manage your community of interest is by engaging with each person
Introduction. Regards, Lee Chadwick Managing Director
 User Guide Contents Introduction.. 2 Step 1: Creating your account...3 Step 2: Installing the tracking code.. 3 Step 3: Assigning scores to your pages.....4 Step 4: Customising your lead bands..5 Step
A quick guide to. Social Media
 A quick guide to Social Media In this guide... Learn how to integrate your email marketing with social media to get the most out of online buzz! Use Twitter and Facebook integrations to enable readers
Online Marketing Training
 Online Marketing Training Level: 1 Duration: 3 Days Time: 9:30 AM - 4:30 PM Cost: 697 Overview Online Marketing is all about ensuring your business, product or service is maximising the potential of the
How to Integrate Email Marketing With Your Social Media Efforts
 How to Integrate Email Marketing With Your Social Media Efforts Here are the 4 methods of integrating social media with your email marketing. 1. Put faces to your email subscribers and retarget them All
A Quick Start Guide On How To Promote Your Site Using Do It Myself SEO
 A Quick Start Guide On How To Promote Your Site Using Do It Myself SEO Introduction Welcome to Do It Myself SEO, a set of tools for SEO, Social Media Analytics and Competitive Analysis. This platform boasts
PASSPORT USER GUIDE. This guide provides a detailed overview of how to use Passport, allowing you to find the information you need more efficiently.
 PASSPORT USER GUIDE Euromonitor International s Passport is an integrated online database, providing business intelligence on industries, economies and consumers. Its simple-to-use interface makes it easy
Ads Analytics. User Guide
 Ads Analytics User Guide For many marketers, measuring ad performance is either too complicated or time-consuming. Too much time is wasted wading through meaningless metrics, struggling to get an aggregated
What is FTH 2.0? replacement for
 Free Toast Host 2.0 What is FTH 2.0? FreeToastHost 2.0 is the replacement for FreeToastHost 1.0. It is not a competitor of FTH, or a alternative for FTH. It is a complete rebuild using the latest web
EDIT YOUR FUNDRAISING PAGE AND MANAGE YOUR HEADQUARTERS
 EDIT YOUR FUNDRAISING PAGE AND MANAGE YOUR HEADQUARTERS TABLE OF CONTENTS Related To: Subject Page(s) Edit Your Fundraising Page Access Your Personal Fundraising Page 3 Edit Your Fundraising Page Update
Google Analytics 101
 American Marketing Association San Antonio Chapter presents Google Analytics 101 Instructor: Maria Haase Workshop Objectives Learn how to create an effective Measurement Plan for your organization Learn
An Introduction to using. Twitter for Business By Business Training Made Simple
 An Introduction to using Twitter for Business By Twitter for Business 2 Welcome Using Twitter personally and professionally are two very different things. In this highly practical guide, we ll take a look
Marketing Communications Essentials: B2B Marketing for Small Businesses. June 18, 2014
 Marketing Communications Essentials: B2B Marketing for Small Businesses June 18, 2014 Agenda B2B Marketing Consumer vs. B2B Decision-Makers Messaging: Rational or Emotional? Key Steps: Developing a B2B
Teleconference information: Call-in toll-free number: 1-866-410-6539 (US) Conference Code: 597 987 4688. Webinar call-in number: 1-866-410-6539
 Conference Code: 597 987 4688. Webinar call-in number: 1-866-410-6539") The audio for this webinar will be broadcast through your computer. Once you join the presentation, a small audio broadcast box will appear on your screen and you will hear the host through your computer
The audio for this webinar will be broadcast through your computer. Once you join the presentation, a small audio broadcast box will appear on your screen and you will hear the host through your computer
THE ECOMMERCE MARKETING GUIDE TO FACEBOOK
 ADVANCED THE ECOMMERCE MARKETING GUIDE TO FACEBOOK A publication of 2 IS THIS BOOK RIGHT FOR ME? Not quite sure if this ebook is right for you? See the below description to determine if your level matches
GUIDE TO POSITIONLY. Everything you need to know to start your first SEO campaign with Positionly!
 GUIDE TO POSITIONLY Everything you need to know to start your first SEO campaign with Positionly! 1 Introduction In this guide, you'll learn everything you need to get started with Positionly. We'll walk
DEVELOPING A SOCIAL MEDIA STRATEGY
 DEVELOPING A SOCIAL MEDIA STRATEGY Creating a social media strategy for your business 2 April 2012 Version 1.0 Contents Contents 2 Introduction 3 Skill Level 3 Video Tutorials 3 Getting Started with Social
THE ICDD & SOCIAL MEDIA. By Betsy Potter, Director of Operations
 THE ICDD & SOCIAL MEDIA By Betsy Potter, Director of Operations BENEFITS n Relationships n Branding n Learning HOW SHOULD SOCIAL MEDIA BE USED n Integrate n Amplify n Repurpose n Build community n Learn
How-To Guide: Twitter Marketing. Content Provided By
 How-To Guide: Twitter Marketing Content Provided By About Twitter Tumblr is a free microblogging service. It is made up of 140 character bursts of information called tweets. Over 555 million users with
End User Guide Wazoku s Idea Spotlight
 End User Guide Wazoku s Idea Spotlight CONTENTS Homepage Homepage Analytics Update Profile Dashboard Manage Notifications Creating an Idea Working in Teams Feedback on an Idea Reviewing Ideas Task Management
Do I need anything special to use it? All you need to use Twitter is an Internet connection or a mobile phone with Internet capability.
 Twitter Guide What is Twitter? Twitter is a real-time communication platform that allows you to quickly share thoughts, opinions, and interesting links with friends, family, and the general public. People
Base CRM Guide. Getting started and understanding of the basic features of Base CRM.
 Base CRM Guide Getting started and understanding of the basic features of Base CRM. Table of Contents BASIC NAVIGATION 03 Logging in 04 Desktop Navigation 05 Settings DASHBOARD 06 Your Dashboard LEADS
Market Pricing Override
 Market Pricing Override MARKET PRICING OVERRIDE Market Pricing: Copy Override Market price overrides can be copied from one match year to another Market Price Override can be accessed from the Job Matches
ZOINED RETAIL ANALYTICS. User Guide
 ZOINED RETAIL ANALYTICS User Guide Contents Using the portal New user Profile Email reports Portal use Dashboard Drilling down into the data Filter options Analytics Managing analysis Saving the analysis
Integrated Search Engine Marketing. Merge your marketing efforts for a commanding online presence
 Integrated Search Engine Marketing Merge your marketing efforts for a commanding online presence Table of Contents Introduction...3 Successful Integration...4 Search Engine Optimization...5 Pay Per Click
An easy guide to... MARKETING FOR CLUBS
 An easy guide to... MARKETING FOR CLUBS Inspiration to Participation Lincolnshire Sport www.lincolnshiresport.com Marketing your Club and Activities Does your club have a media lead? Think about appointing
Salesforce ExactTarget Marketing Cloud Radian6 Mobile User Guide
 Salesforce ExactTarget Marketing Cloud Radian6 Mobile User Guide 7/14/2014 Table of Contents Get Started Download the Radian6 Mobile App Log In to Radian6 Mobile Set up a Quick Search Navigate the Quick
oneforty. Social Media KPIs and You: A Love Story Janet Aronica Directory, Marketing & Community oneforty
 oneforty. Social Media KPIs and You: A Love Story Janet Aronica Directory, Marketing & Community oneforty Social Media KPIs and You: A Love Story Establishing a social media measurement plan is a crucial
Social Media Analytics. Social Media Workshop Twitter Facebook Instagram
 Social Media Analytics Social Media Workshop Twitter Facebook Instagram 1 What are your communication goals? Community building Informational Complimentary What is your call to action? What do you want
WEB ANALYTICS Where to Begin
 WEB ANALYTICS Where to Begin e-book SPOILER ALERT! People love the Internet. A lot. In fact, 92% of online adults rely on search engines when looking for information 1. That means your audience s first
Creating Dashboards in Google Analytics
 Creating Dashboards in Google Analytics 12/10/2011 TABLE OF CONTENTS Introduction to Dashboards... 3 Adding Data to Dashboards... 3 Creating a Management Dashboard... 4 1. Starting the Dashboard... 4 2.
How To Track Your Mobile Marketing On A Mobile Device
 emma Mobile Business Intelligence The big problem in ecommerce is the recurrency Best customers comes from Mobile emma is Mobile Business Intelligence. The ultimate mobile marketing technology in the market
Katy Young s Guide to... Twitter
 21/08/13 Step by step guide followed by advanced techniques guide INTRODUCTION Twitter is a social media platform where users tweet content. It s culture is open and encourages users to tweet without needing
DIGITAL MARKETING. The Page Title Meta Descriptions & Meta Keywords
 DIGITAL MARKETING Digital Marketing Basics Basics of advertising What is Digital Media? Digital Media Vs. Traditional Media Benefits of Digital marketing Latest Digital marketing trends Digital media marketing
A 7-Step Analytics Reporting Framework
 A 7-Step Analytics Reporting Framework By Feras Alhlou, Principal Marketing Consultant 2 Marketing Optimization Imagine that you just attended a conference on digital marketing and analytics. You re pumped
A quick guide to setting up your new website
 A quick guide to setting up your new website Hi there. Welcome to MrSite we re really happy you chose to build your brand new website with us and look forward to seeing what you create! We re sure you
Social Listening & Analytics:
 Social Listening & Analytics: A focus on TV broadcasters/producers Listening What is happening around a TV broadcast in social/online media? Analytics How is a TV broadcast performing/benchmarking? Benchmarking
DIGITAL MARKETING TRAINING
 DIGITAL MARKETING TRAINING Digital Marketing Basics Keywords Research and Analysis Basics of advertising What is Digital Media? Digital Media Vs. Traditional Media Benefits of Digital marketing Latest
Social media metics How to monitor a Social Media campaign?
 Social media metics How to monitor a Social Media campaign? White paper Summary I II III IV V VI VII VIII IX X Introduction Preparing the website Setting up the objectives Measuring the traffic on the
Nonprofit Technology Collaboration. Web Analytics
 Web Analytics Contents What is Web Analytics?... 2 Why is Web Analytics Important?... 2 Google Analytics... 3 Using Major Metrics in Google Analytics... 6 Traffic Sources... 6 Visitor Loyalty... 9 Top
Reference Guide TEAM. Pogoplug Team. Reference Guide. 2012 Cloud Engines Inc., All Rights Reserved.
 Reference Guide Pogoplug Team Reference Guide Table of Contents Table of Contents 1. What s Included 2. Getting Started 3. Customizing the Pogoplug Interface a. Custom UI b. Custom Domain Name c. Custom
Yammer Training Guide Facilitator s Notes
 Yammer Training Guide Facilitator s Notes Purpose This presentation provides an overview of Yammer to help new users get started. This is meant to be a slide library, so please pick and pull what is appropriate
Creating an Email with Constant Contact. A step-by-step guide
 Creating an Email with Constant Contact A step-by-step guide About this Manual Once your Constant Contact account is established, use this manual as a guide to help you create your email campaign Here
Online Reputation Management Services
 Online Reputation Management Services Potential customers change purchase decisions when they see bad reviews, posts and comments online which can spread in various channels such as in search engine results
Pinterest Beginner s Guide for Attorneys
 Pinterest Beginner s Guide for Attorneys Are you looking for an additional source of website traffic and leads? Pinterest can deliver them. This guide will walk you through setting up your account, how