Information Visualization. Texas Advanced Computing Center
|
|
|
- Shona Terry
- 7 years ago
- Views:
Transcription
1 Information Visualization Texas Advanced Computing Center
2 Data Analysis vs. information visualization Data analysis: process data to extract knowledge. What information visualization does? Human Data Information Transfer
3 What information visualization does? Anscombe's Quartet
4 What information visualization does? Simple statistical analysis mean variance correlation regression Y=3+0.5x Y=3+0.5x Y=3+0.5x Y=3+0.5x Conclusion? Four data sets are, statistically, same?
5 What information visualization does? Positive linear Linear? Is something wrong here? Linear with outliers
6 In the simple case Line Graph x-axis requires quantitative variable Variables have contiguous values Familiar/conventional ordering among ordinals 100% 80% R 2 = % 40% 20% 0% Scatter Plot Convey overall impression of relationship between two variables Bar Graph Comparison of relative point values Pie Chart Emphasizing differences in proportion among a few numbers Histogram vs. Pie
7 From Data to Graph Information Type: Easy case: 1D, 2D, 3D spatial What about more dimensions Graph data Tree Network Graph Text and document collections
8 Simple InfoVis Model Data Visual Mapping View Port
9 Visual Mapping: Step 1 1. Map: data items visual marks Visual marks: Points Lines Areas Volumes Glyphs
10 Visual Mapping: Step 2 1. Map: data items visual marks 2. Map: data attributes visual properties of marks Visual properties of marks: Position, x, y, z Size, length, area, volume Orientation, angle, slope Color, gray scale, texture Shape Animation, blink, motion
11 Example: A movie database Attributes Types: Quantitative Ordinal Nominal/Categorical Items (aka: cases, tuples, data points, )
12 Example: A Movie database Year X Length Y Popularity size Subject color Award? shape
13 Example: A movie database
14 Accuracy of Visual Attributes Position Length Angle, Slope Size Color Shape Increased accuracy for quantitative data
15 Map n-d space onto 2-D screen Visual representations: Multiple views E.g. plot matrices, brushing histograms, Complex glyphs E.g. star glyphs, faces More axes E.g. Parallel coords, star coords,
16 Using Multiple Views Basic idea: Showing multiple views of same data set at the same time. Each individual visualizations might be of same or different types. Brushing and linking With interactive visualizations, All views might be linked so that action, such as selection, on one view might be reflected in all other views. Example: Scatter plot matrix Create a 2d views for all attributes pairs

17 Example Data
18 Scatter plot Matrix Example
19 Glyph Glyphs composite graphical objects where different geometric and visual attributes are used to encode multidimensional data structures in combination. Example: Chernoff Face* mapping k-dimensions to facial features *Herman Chernoff, "The use of faces to represent points in k-dimensional space graphically," J. Am. Stat. Assoc., v68, (1973).

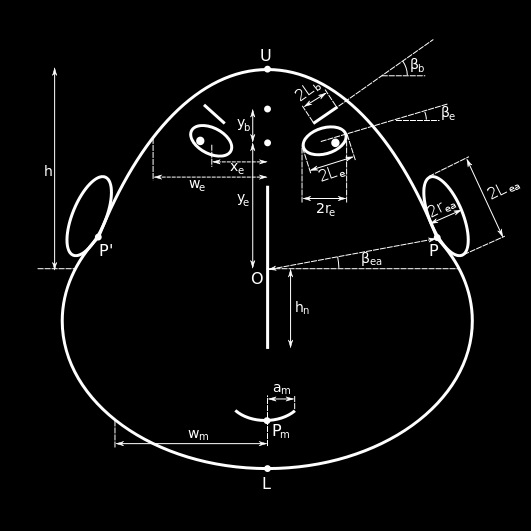
20 Glyphs: Chernoff Faces
21 Chernoff Face Example Map to 10 dimension binary vector Evaluation Of Judges [0, 0, 0, 0, 0, 0, 0, 0, 0, 0] [1, 1, 1, 1, 1, 1, 1, 1, 1, 1]
22 2007 Baseball season statistics
23 Glyph Star Glyph d7 d1 d2 d6 d3 d5 d4 What s the limitations with using glyph?3
24 Using additional axes Easy example: 2D scatter plot 3D scatter plot Space > 3D?
25 Parallel Coordinates Instead of orthogonal axes, let s go parallel x y z w (0,1,-1,2)= Inselberg, Multidimensional detective (parallel coordinates)
26 Parallel Coordinates Important factors: the scaling of the axes. the order of the axes the rotation of the axes
27 Parallel Coordinates
28 Better visualizations Parallel Coordinates
29 Parallel Coordinates 3D parallel coordinates
30 Using non- orthogonal axes Star plot Parallel Coordinates with axes arranged radially
31 Star Plot example
32 Cartesian Coordinates Star Coordinates Eser Kandogan Star Coordinates: A Multi-dimensional Visualization Technique with Uniform Treatment of Dimensions (2000) In Proceedings of the IEEE Information Visualization Symposium d1 p P=(v1, v2) Star P=(v1,v2,v3,v4,v5,v6,v7,v8) d8 d1 v2 v3 d2 v4 v1 v2 d2 d7 p v1 v5 d3 Mapping: Items dots Σ attribute vectors (x,y) d6 v8 v7 v6 d4 d5
33 Star Coordinates Example
34 Star plot vs. Star coordinates
35 What information visualization does? General Aims Use human perceptual capabilities To gain insights into large and abstract data sets that are difficult to extract using standard query languages Exploratory Visualization Look for structure, patterns, trends, anomalies, relationships Provide a qualitative overview of large, complex data sets Assist in identifying region(s) of interest and appropriate parameters for more focused quantitative analysis
36 Good visualization Use of computer-supported, interactive, visual representations of abstract data to amplify cognition Visual representation can enhance recognition Recognition of patterns Abstraction and aggregation Perceptual interference Facilitate data exploration Interactive medium High data density Greater access speed Increased analytic resources Parallel perceptual processing Offload work from cognitive to perceptual system
37 Fun Websites Many Eyes: a project to encourage sharing and conversation around visualizations Features: Explore data and visualizations created by others Create new visualizations Upload data New York Times Infographics Gap Minder How to visualize data with Chernoff face using R
38 Reference materials References E.R. Tufte, The Visual Display of Quantitative Information, Graphics Press, S.K. Card, J.D. Mackinlay, and B. Shneiderman, Information Visualization: Using Vision to Think, Morgan Kaufmann Publishers, Software Matplotlib Google charts InfoVis ToolKit Titan Libraries/VTK InfoVis Libraries
Multi-Dimensional Data Visualization. Slides courtesy of Chris North
 Multi-Dimensional Data Visualization Slides courtesy of Chris North What is the Cleveland s ranking for quantitative data among the visual variables: Angle, area, length, position, color Where are we?!
What is Visualization? Information Visualization An Overview. Information Visualization. Definitions
 What is Visualization? Information Visualization An Overview Jonathan I. Maletic, Ph.D. Computer Science Kent State University Visualize/Visualization: To form a mental image or vision of [some
Data Visualization. or Graphical Data Presentation. Jerzy Stefanowski Instytut Informatyki
 Data Visualization or Graphical Data Presentation Jerzy Stefanowski Instytut Informatyki Data mining for SE -- 2013 Ack. Inspirations are coming from: G.Piatetsky Schapiro lectures on KDD J.Han on Data
Information Visualization Multivariate Data Visualization Krešimir Matković
 Information Visualization Multivariate Data Visualization Krešimir Matković Vienna University of Technology, VRVis Research Center, Vienna Multivariable >3D Data Tables have so many variables that orthogonal
Cours de Visualisation d'information InfoVis Lecture. Multivariate Data Sets
 Cours de Visualisation d'information InfoVis Lecture Multivariate Data Sets Frédéric Vernier Maître de conférence / Lecturer Univ. Paris Sud Inspired from CS 7450 - John Stasko CS 5764 - Chris North Data
Data Mining: Exploring Data. Lecture Notes for Chapter 3. Introduction to Data Mining
 Data Mining: Exploring Data Lecture Notes for Chapter 3 Introduction to Data Mining by Tan, Steinbach, Kumar What is data exploration? A preliminary exploration of the data to better understand its characteristics.
Microsoft Business Intelligence Visualization Comparisons by Tool
 Microsoft Business Intelligence Visualization Comparisons by Tool Version 3: 10/29/2012 Purpose: Purpose of this document is to provide a quick reference of visualization options available in each tool.
Diagrams and Graphs of Statistical Data
 Diagrams and Graphs of Statistical Data One of the most effective and interesting alternative way in which a statistical data may be presented is through diagrams and graphs. There are several ways in
Data Mining: Exploring Data. Lecture Notes for Chapter 3. Introduction to Data Mining
 Data Mining: Exploring Data Lecture Notes for Chapter 3 Introduction to Data Mining by Tan, Steinbach, Kumar Tan,Steinbach, Kumar Introduction to Data Mining 8/05/2005 1 What is data exploration? A preliminary
Principles of Data Visualization for Exploratory Data Analysis. Renee M. P. Teate. SYS 6023 Cognitive Systems Engineering April 28, 2015
 Principles of Data Visualization for Exploratory Data Analysis Renee M. P. Teate SYS 6023 Cognitive Systems Engineering April 28, 2015 Introduction Exploratory Data Analysis (EDA) is the phase of analysis
Iris Sample Data Set. Basic Visualization Techniques: Charts, Graphs and Maps. Summary Statistics. Frequency and Mode
 Iris Sample Data Set Basic Visualization Techniques: Charts, Graphs and Maps CS598 Information Visualization Spring 2010 Many of the exploratory data techniques are illustrated with the Iris Plant data
Information visualization examples
 Information visualization examples 350102: GenICT II 37 Information visualization examples 350102: GenICT II 38 Information visualization examples 350102: GenICT II 39 Information visualization examples
Visualization Software
 Visualization Software Maneesh Agrawala CS 294-10: Visualization Fall 2007 Assignment 1b: Deconstruction & Redesign Due before class on Sep 12, 2007 1 Assignment 2: Creating Visualizations Use existing
Exploratory Spatial Data Analysis
 Exploratory Spatial Data Analysis Part II Dynamically Linked Views 1 Contents Introduction: why to use non-cartographic data displays Display linking by object highlighting Dynamic Query Object classification
Data Exploration Data Visualization
 Data Exploration Data Visualization What is data exploration? A preliminary exploration of the data to better understand its characteristics. Key motivations of data exploration include Helping to select
Visualization Techniques in Data Mining
 Tecniche di Apprendimento Automatico per Applicazioni di Data Mining Visualization Techniques in Data Mining Prof. Pier Luca Lanzi Laurea in Ingegneria Informatica Politecnico di Milano Polo di Milano
The Value of Visualization 2
 The Value of Visualization 2 G Janacek -0.69 1.11-3.1 4.0 GJJ () Visualization 1 / 21 Parallel coordinates Parallel coordinates is a common way of visualising high-dimensional geometry and analysing multivariate
Introduction to Data Visualization
 Introduction to Data Visualization STAT 133 Gaston Sanchez Department of Statistics, UC Berkeley gastonsanchez.com github.com/gastonstat/stat133 Course web: gastonsanchez.com/teaching/stat133 Graphics
Data Visualization - A Very Rough Guide
 Data Visualization - A Very Rough Guide Ken Brodlie University of Leeds 1 What is This Thing Called Visualization? Visualization Use of computersupported, interactive, visual representations of data to
Data Exploration and Preprocessing. Data Mining and Text Mining (UIC 583 @ Politecnico di Milano)
") Data Exploration and Preprocessing Data Mining and Text Mining (UIC 583 @ Politecnico di Milano) References Jiawei Han and Micheline Kamber, "Data Mining: Concepts and Techniques", The Morgan Kaufmann
Data Exploration and Preprocessing Data Mining and Text Mining (UIC 583 @ Politecnico di Milano) References Jiawei Han and Micheline Kamber, "Data Mining: Concepts and Techniques", The Morgan Kaufmann
COM CO P 5318 Da t Da a t Explora Explor t a ion and Analysis y Chapte Chapt r e 3
 COMP 5318 Data Exploration and Analysis Chapter 3 What is data exploration? A preliminary exploration of the data to better understand its characteristics. Key motivations of data exploration include Helping
Examples of Data Representation using Tables, Graphs and Charts
 Examples of Data Representation using Tables, Graphs and Charts This document discusses how to properly display numerical data. It discusses the differences between tables and graphs and it discusses various
An example. Visualization? An example. Scientific Visualization. This talk. Information Visualization & Visual Analytics. 30 items, 30 x 3 values
 Information Visualization & Visual Analytics Jack van Wijk Technische Universiteit Eindhoven An example y 30 items, 30 x 3 values I-science for Astronomy, October 13-17, 2008 Lorentz center, Leiden x An
Visualizing Repertory Grid Data for Formative Assessment
 Visualizing Repertory Grid Data for Formative Assessment Kostas Pantazos 1, Ravi Vatrapu 1, 2 and Abid Hussain 1 1 Computational Social Science Laboratory (CSSL) Department of IT Management, Copenhagen
Human-Computer Interaction
 Human-Computer Interaction an introduction to data visualization Above all else show the data. Edward R. Tufte reality Data is no longer scarce reality Data is no longer scarce http://www.worldometers.info/
A Correlation of. to the. South Carolina Data Analysis and Probability Standards
 A Correlation of to the South Carolina Data Analysis and Probability Standards INTRODUCTION This document demonstrates how Stats in Your World 2012 meets the indicators of the South Carolina Academic Standards
Data Mining: Exploring Data. Lecture Notes for Chapter 3. Slides by Tan, Steinbach, Kumar adapted by Michael Hahsler
 Data Mining: Exploring Data Lecture Notes for Chapter 3 Slides by Tan, Steinbach, Kumar adapted by Michael Hahsler Topics Exploratory Data Analysis Summary Statistics Visualization What is data exploration?
Data Visualization Techniques
 Data Visualization Techniques From Basics to Big Data with SAS Visual Analytics WHITE PAPER SAS White Paper Table of Contents Introduction.... 1 Generating the Best Visualizations for Your Data... 2 The
an introduction to VISUALIZING DATA by joel laumans
 an introduction to VISUALIZING DATA by joel laumans an introduction to VISUALIZING DATA iii AN INTRODUCTION TO VISUALIZING DATA by Joel Laumans Table of Contents 1 Introduction 1 Definition Purpose 2 Data
CS171 Visualization. The Visualization Alphabet: Marks and Channels. Alexander Lex alex@seas.harvard.edu. [xkcd]
![CS171 Visualization. The Visualization Alphabet: Marks and Channels. Alexander Lex alex@seas.harvard.edu. [xkcd]](/thumbs/39/19465011.jpg "CS171 Visualization. The Visualization Alphabet: Marks and Channels. Alexander Lex alex@seas.harvard.edu. [xkcd]") CS171 Visualization Alexander Lex alex@seas.harvard.edu The Visualization Alphabet: Marks and Channels [xkcd] This Week Thursday: Task Abstraction, Validation Homework 1 due on Friday! Any more problems
CS171 Visualization Alexander Lex alex@seas.harvard.edu The Visualization Alphabet: Marks and Channels [xkcd] This Week Thursday: Task Abstraction, Validation Homework 1 due on Friday! Any more problems
MTH 140 Statistics Videos
 MTH 140 Statistics Videos Chapter 1 Picturing Distributions with Graphs Individuals and Variables Categorical Variables: Pie Charts and Bar Graphs Categorical Variables: Pie Charts and Bar Graphs Quantitative
Basic Understandings
 Activity: TEKS: Exploring Transformations Basic understandings. (5) Tools for geometric thinking. Techniques for working with spatial figures and their properties are essential to understanding underlying
Visibility optimization for data visualization: A Survey of Issues and Techniques
 Visibility optimization for data visualization: A Survey of Issues and Techniques Ch Harika, Dr.Supreethi K.P Student, M.Tech, Assistant Professor College of Engineering, Jawaharlal Nehru Technological
Chapter 3 - Multidimensional Information Visualization II
 Chapter 3 - Multidimensional Information Visualization II Concepts for visualizing univariate to hypervariate data Vorlesung Informationsvisualisierung Prof. Dr. Florian Alt, WS 2013/14 Konzept und Folien
TIES443. Lecture 9: Visualization. Lecture 9. Course webpage: http://www.cs.jyu.fi/~mpechen/ties443. November 17, 2006
 TIES443 Lecture 9 Visualization Mykola Pechenizkiy Course webpage: http://www.cs.jyu.fi/~mpechen/ties443 Department of Mathematical Information Technology University of Jyväskylä November 17, 2006 1 Topics
Data Visualization Techniques
 Data Visualization Techniques From Basics to Big Data with SAS Visual Analytics WHITE PAPER SAS White Paper Table of Contents Introduction.... 1 Generating the Best Visualizations for Your Data... 2 The
Data Analysis & Visualization for Security Professionals
 Data Analysis & Visualization for Security Professionals Jay Jacobs Verizon Bob Rudis Liberty Mutual Insurance Session ID: GRC- T18 Session Classification: Intermediate Key Learning Points Key Learning
Dynamic Visualization and Time
 Dynamic Visualization and Time Markku Reunanen, marq@iki.fi Introduction Edward Tufte (1997, 23) asked five questions on a visualization in his book Visual Explanations: How many? How often? Where? How
Lecture 2: Descriptive Statistics and Exploratory Data Analysis
 Lecture 2: Descriptive Statistics and Exploratory Data Analysis Further Thoughts on Experimental Design 16 Individuals (8 each from two populations) with replicates Pop 1 Pop 2 Randomly sample 4 individuals
Glencoe. correlated to SOUTH CAROLINA MATH CURRICULUM STANDARDS GRADE 6 3-3, 5-8 8-4, 8-7 1-6, 4-9
 Glencoe correlated to SOUTH CAROLINA MATH CURRICULUM STANDARDS GRADE 6 STANDARDS 6-8 Number and Operations (NO) Standard I. Understand numbers, ways of representing numbers, relationships among numbers,
Visual Data Mining : the case of VITAMIN System and other software
 Visual Data Mining : the case of VITAMIN System and other software Alain MORINEAU a.morineau@noos.fr Data mining is an extension of Exploratory Data Analysis in the sense that both approaches have the
On History of Information Visualization
 On History of Information Visualization Mária Kmeťová Department of Mathematics, Constantine the Philosopher University in Nitra, Tr. A. Hlinku 1, Nitra, Slovakia mkmetova@ukf.sk Keywords: Abstract: abstract
Big Ideas in Mathematics
 Big Ideas in Mathematics which are important to all mathematics learning. (Adapted from the NCTM Curriculum Focal Points, 2006) The Mathematics Big Ideas are organized using the PA Mathematics Standards
Current Standard: Mathematical Concepts and Applications Shape, Space, and Measurement- Primary
 Shape, Space, and Measurement- Primary A student shall apply concepts of shape, space, and measurement to solve problems involving two- and three-dimensional shapes by demonstrating an understanding of:
USING SELF-ORGANIZING MAPS FOR INFORMATION VISUALIZATION AND KNOWLEDGE DISCOVERY IN COMPLEX GEOSPATIAL DATASETS
 USING SELF-ORGANIZING MAPS FOR INFORMATION VISUALIZATION AND KNOWLEDGE DISCOVERY IN COMPLEX GEOSPATIAL DATASETS Koua, E.L. International Institute for Geo-Information Science and Earth Observation (ITC).
GRADES 7, 8, AND 9 BIG IDEAS
 Table 1: Strand A: BIG IDEAS: MATH: NUMBER Introduce perfect squares, square roots, and all applications Introduce rational numbers (positive and negative) Introduce the meaning of negative exponents for
Business Intelligence and Process Modelling
 Business Intelligence and Process Modelling F.W. Takes Universiteit Leiden Lecture 2: Business Intelligence & Visual Analytics BIPM Lecture 2: Business Intelligence & Visual Analytics 1 / 72 Business Intelligence
A Taxonomy of Visualization Techniques using the Data State Reference Model
 A Taxonomy of s using the State Reference Model Ed H. Chi Xerox Palo Alto Research Center 3333 Coyote Hill Road, Palo Alto, CA 94301 echi@parc.xerox.com ABSTRACT In previous work, researchers have attempted
Data, Measurements, Features
 Data, Measurements, Features Middle East Technical University Dep. of Computer Engineering 2009 compiled by V. Atalay What do you think of when someone says Data? We might abstract the idea that data are
NEW YORK STATE TEACHER CERTIFICATION EXAMINATIONS
 NEW YORK STATE TEACHER CERTIFICATION EXAMINATIONS TEST DESIGN AND FRAMEWORK September 2014 Authorized for Distribution by the New York State Education Department This test design and framework document
The importance of graphing the data: Anscombe s regression examples
 The importance of graphing the data: Anscombe s regression examples Bruce Weaver Northern Health Research Conference Nipissing University, North Bay May 30-31, 2008 B. Weaver, NHRC 2008 1 The Objective
Outline. Fundamentals. Rendering (of 3D data) Data mappings. Evaluation Interaction
 Data mappings. Evaluation Interaction") Outline Fundamentals What is vis? Some history Design principles The visualization process Data sources and data structures Basic visual mapping approaches Rendering (of 3D data) Scalar fields (isosurfaces
Outline Fundamentals What is vis? Some history Design principles The visualization process Data sources and data structures Basic visual mapping approaches Rendering (of 3D data) Scalar fields (isosurfaces
3D Interactive Information Visualization: Guidelines from experience and analysis of applications
 3D Interactive Information Visualization: Guidelines from experience and analysis of applications Richard Brath Visible Decisions Inc., 200 Front St. W. #2203, Toronto, Canada, rbrath@vdi.com 1. EXPERT
How To Identify Technical Debt In Java (Tty) On A Microsoft Powerbook (V0.2.2) On An Ipa (Microsoft) Microsoft Microsoft (Powerbook) On Microsoft.Com (V1
 On A Microsoft Powerbook (V0.2.2) On An Ipa (Microsoft) Microsoft Microsoft (Powerbook) On Microsoft.Com (V1") visualization and representation for scientific analysis Seminar Foundations in Empirical Software Engineering Dominik Münch Institut für Informatik Software & Systems Engineering ization The use of computer-supported,
visualization and representation for scientific analysis Seminar Foundations in Empirical Software Engineering Dominik Münch Institut für Informatik Software & Systems Engineering ization The use of computer-supported,
Choosing a successful structure for your visualization
 IBM Software Business Analytics Visualization Choosing a successful structure for your visualization By Noah Iliinsky, IBM Visualization Expert 2 Choosing a successful structure for your visualization
Time Series Data Visualization
 Time Series Data Visualization Time Series Data Fundamental chronological component to the data set Random sample of 4000 graphics from 15 of world s newspapers and magazines from 74-80 found that 75%
Visualizing Data. Contents. 1 Visualizing Data. Anthony Tanbakuchi Department of Mathematics Pima Community College. Introductory Statistics Lectures
 Introductory Statistics Lectures Visualizing Data Descriptive Statistics I Department of Mathematics Pima Community College Redistribution of this material is prohibited without written permission of the
Connecting Segments for Visual Data Exploration and Interactive Mining of Decision Rules
 Journal of Universal Computer Science, vol. 11, no. 11(2005), 1835-1848 submitted: 1/9/05, accepted: 1/10/05, appeared: 28/11/05 J.UCS Connecting Segments for Visual Data Exploration and Interactive Mining
Exercise 1.12 (Pg. 22-23)
") Individuals: The objects that are described by a set of data. They may be people, animals, things, etc. (Also referred to as Cases or Records) Variables: The characteristics recorded about each individual.
Individuals: The objects that are described by a set of data. They may be people, animals, things, etc. (Also referred to as Cases or Records) Variables: The characteristics recorded about each individual.
Universidade de Aveiro Departamento de Electrónica, Telecomunicações e Informática. Introduction to Information Visualization
 Universidade de Aveiro Departamento de Electrónica, Telecomunicações e Informática Introduction to Information Visualization www.portugal-migration.info Information Visualization Beatriz Sousa Santos,
Summarizing and Displaying Categorical Data
 Summarizing and Displaying Categorical Data Categorical data can be summarized in a frequency distribution which counts the number of cases, or frequency, that fall into each category, or a relative frequency
COMP 150-04 Visualization. Lecture 11 Interacting with Visualizations
 COMP 150-04 Visualization Lecture 11 Interacting with Visualizations Assignment 5: Maps Due Wednesday, March 17th Design a thematic map visualization Option 1: Choropleth Map Implementation in Processing
Data Visualization Handbook
 SAP Lumira Data Visualization Handbook www.saplumira.com 1 Table of Content 3 Introduction 20 Ranking 4 Know Your Purpose 23 Part-to-Whole 5 Know Your Data 25 Distribution 9 Crafting Your Message 29 Correlation
STATS8: Introduction to Biostatistics. Data Exploration. Babak Shahbaba Department of Statistics, UCI
 STATS8: Introduction to Biostatistics Data Exploration Babak Shahbaba Department of Statistics, UCI Introduction After clearly defining the scientific problem, selecting a set of representative members
Bernice E. Rogowitz and Holly E. Rushmeier IBM TJ Watson Research Center, P.O. Box 704, Yorktown Heights, NY USA
 Are Image Quality Metrics Adequate to Evaluate the Quality of Geometric Objects? Bernice E. Rogowitz and Holly E. Rushmeier IBM TJ Watson Research Center, P.O. Box 704, Yorktown Heights, NY USA ABSTRACT
Business Statistics. Successful completion of Introductory and/or Intermediate Algebra courses is recommended before taking Business Statistics.
 Business Course Text Bowerman, Bruce L., Richard T. O'Connell, J. B. Orris, and Dawn C. Porter. Essentials of Business, 2nd edition, McGraw-Hill/Irwin, 2008, ISBN: 978-0-07-331988-9. Required Computing
Why Taking This Course? Course Introduction, Descriptive Statistics and Data Visualization. Learning Goals. GENOME 560, Spring 2012
 Why Taking This Course? Course Introduction, Descriptive Statistics and Data Visualization GENOME 560, Spring 2012 Data are interesting because they help us understand the world Genomics: Massive Amounts
Graphical Representation of Multivariate Data
 Graphical Representation of Multivariate Data One difficulty with multivariate data is their visualization, in particular when p > 3. At the very least, we can construct pairwise scatter plots of variables.
Exploratory Data Analysis with MATLAB
 Computer Science and Data Analysis Series Exploratory Data Analysis with MATLAB Second Edition Wendy L Martinez Angel R. Martinez Jeffrey L. Solka ( r ec) CRC Press VV J Taylor & Francis Group Boca Raton
PLOTTING DATA AND INTERPRETING GRAPHS
 PLOTTING DATA AND INTERPRETING GRAPHS Fundamentals of Graphing One of the most important sets of skills in science and mathematics is the ability to construct graphs and to interpret the information they
Best Practices in Data Visualizations. Vihao Pham 2014
 Best Practices in Data Visualizations Vihao Pham 2014 Agenda Best Practices in Data Visualizations Why We Visualize Understanding Data Visualizations Enhancing Visualizations Visualization Considerations
Best Practices in Data Visualizations. Vihao Pham January 29, 2014
 Best Practices in Data Visualizations Vihao Pham January 29, 2014 Agenda Best Practices in Data Visualizations Why We Visualize Understanding Data Visualizations Enhancing Visualizations Visualization
Module 3: Correlation and Covariance
 Using Statistical Data to Make Decisions Module 3: Correlation and Covariance Tom Ilvento Dr. Mugdim Pašiƒ University of Delaware Sarajevo Graduate School of Business O ften our interest in data analysis
Geovisual Analytics Exploring and analyzing large spatial and multivariate data. Prof Mikael Jern & Civ IngTobias Åström. http://ncva.itn.liu.
 Geovisual Analytics Exploring and analyzing large spatial and multivariate data Prof Mikael Jern & Civ IngTobias Åström http://ncva.itn.liu.se/ Agenda Introduction to a Geovisual Analytics Demo Explore
Information Visualization. Ronald Peikert SciVis 2007 - Information Visualization 10-1
 Information Visualization Ronald Peikert SciVis 2007 - Information Visualization 10-1 Overview Techniques for high-dimensional data scatter plots, PCA parallel coordinates link + brush pixel-oriented techniques
Vertical Alignment Colorado Academic Standards 6 th - 7 th - 8 th
 Vertical Alignment Colorado Academic Standards 6 th - 7 th - 8 th Standard 3: Data Analysis, Statistics, and Probability 6 th Prepared Graduates: 1. Solve problems and make decisions that depend on un
The Forgotten JMP Visualizations (Plus Some New Views in JMP 9) Sam Gardner, SAS Institute, Lafayette, IN, USA
 Sam Gardner, SAS Institute, Lafayette, IN, USA") Paper 156-2010 The Forgotten JMP Visualizations (Plus Some New Views in JMP 9) Sam Gardner, SAS Institute, Lafayette, IN, USA Abstract JMP has a rich set of visual displays that can help you see the information
Paper 156-2010 The Forgotten JMP Visualizations (Plus Some New Views in JMP 9) Sam Gardner, SAS Institute, Lafayette, IN, USA Abstract JMP has a rich set of visual displays that can help you see the information
Number Visualization
 Number Visualization Giuseppe Santucci University of Rome "La Sapienza" santucci@dis.uniroma1.it Thanks to: Ross Ihaka (very inspiring lectures) Number visualization? Obviously information visualization
WebFOCUS RStat. RStat. Predict the Future and Make Effective Decisions Today. WebFOCUS RStat
 Information Builders enables agile information solutions with business intelligence (BI) and integration technologies. WebFOCUS the most widely utilized business intelligence platform connects to any enterprise
Visualizations. Cyclical data. Comparison. What would you like to show? Composition. Simple share of total. Relative and absolute differences matter
 Visualizations Variable width chart Table or tables with embedded charts Bar chart horizontal Circular area chart per item Many categories Cyclical data Non-cyclical data Single or few categories Many
Vector Notation: AB represents the vector from point A to point B on a graph. The vector can be computed by B A.
 1 Linear Transformations Prepared by: Robin Michelle King A transformation of an object is a change in position or dimension (or both) of the object. The resulting object after the transformation is called
Chapter 9. Systems of Linear Equations
 Chapter 9. Systems of Linear Equations 9.1. Solve Systems of Linear Equations by Graphing KYOTE Standards: CR 21; CA 13 In this section we discuss how to solve systems of two linear equations in two variables
Mario Guarracino. Regression
 Regression Introduction In the last lesson, we saw how to aggregate data from different sources, identify measures and dimensions, to build data marts for business analysis. Some techniques were introduced
COSC 6344 Visualization
 COSC 64 Visualization University of Houston, Fall 2015 Instructor: Guoning Chen chengu@cs.uh.edu Course Information Location: AH 2 Time: 10am~11:am Tu/Th Office Hours: 11:am~12:pm Tu /Th or by appointment
How To Create A Data Visualization
 CSCI 552 Data Visualization Shiaofen Fang What Is Visualization? We observe and draw conclusions A picture says more than a thousand words/numbers Seeing is believing, seeing is understanding Beware of
Exploratory data analysis (Chapter 2) Fall 2011
 Fall 2011") Exploratory data analysis (Chapter 2) Fall 2011 Data Examples Example 1: Survey Data 1 Data collected from a Stat 371 class in Fall 2005 2 They answered questions about their: gender, major, year in school,
Exploratory data analysis (Chapter 2) Fall 2011 Data Examples Example 1: Survey Data 1 Data collected from a Stat 371 class in Fall 2005 2 They answered questions about their: gender, major, year in school,
Analyzing The Role Of Dimension Arrangement For Data Visualization in Radviz
 Analyzing The Role Of Dimension Arrangement For Data Visualization in Radviz Luigi Di Caro 1, Vanessa Frias-Martinez 2, and Enrique Frias-Martinez 2 1 Department of Computer Science, Universita di Torino,
LET S GO BACK TO THE VERY FIRST HISTORICAL KNOWN EXAMPLES OF INFORMATION VISUALIZATIONS
 Introduction to InfoVis and Geovisual Analytics Prof Mikael Jern NCVA, Linköping University Prof http://ncva.itn.liu.se/ Mikael Jern 2014 Discovery consists of seeing what everybody has seen and thinking
Big Data in Pictures: Data Visualization
 Big Data in Pictures: Data Visualization Huamin Qu Hong Kong University of Science and Technology What is data visualization? Data visualization is the creation and study of the visual representation of
business statistics using Excel OXFORD UNIVERSITY PRESS Glyn Davis & Branko Pecar
 business statistics using Excel Glyn Davis & Branko Pecar OXFORD UNIVERSITY PRESS Detailed contents Introduction to Microsoft Excel 2003 Overview Learning Objectives 1.1 Introduction to Microsoft Excel
Overview of InfoVis. Exercise. Get out pencil and paper. CS 7450 - Information Visualization Aug. 19, 2015 John Stasko. Fall 2015 CS 7450 2
 Overview of InfoVis CS 7450 - Information Visualization Aug. 19, 2015 John Stasko Exercise Get out pencil and paper Fall 2015 CS 7450 2 1 Data Fall 2015 CS 7450 4 2 Data Overload Confound: How to make
Information Rich Glyphs for Software Management Data
 Information Visualization Information Rich Glyphs for Software Management Data Mei C. Chuah Carnegie Mellon University Stephen G. Eick Bell Laboratories In data exploration, glyphs refer to graphical objects
Formulas, Functions and Charts
 Formulas, Functions and Charts :: 167 8 Formulas, Functions and Charts 8.1 INTRODUCTION In this leson you can enter formula and functions and perform mathematical calcualtions. You will also be able to
Data Visualization in R
 Data Visualization in R L. Torgo ltorgo@fc.up.pt Faculdade de Ciências / LIAAD-INESC TEC, LA Universidade do Porto Oct, 2014 Introduction Motivation for Data Visualization Humans are outstanding at detecting
PCHS ALGEBRA PLACEMENT TEST
 MATHEMATICS Students must pass all math courses with a C or better to advance to the next math level. Only classes passed with a C or better will count towards meeting college entrance requirements. If
Interactive Information Visualization of Trend Information
 Interactive Information Visualization of Trend Information Yasufumi Takama Takashi Yamada Tokyo Metropolitan University 6-6 Asahigaoka, Hino, Tokyo 191-0065, Japan ytakama@sd.tmu.ac.jp Abstract This paper
Introduction to Information Visualization
 Universidade de Aveiro Departamento de Electrónica, Telecomunicações e Informática Introduction to Information Visualization www.portugal-migration.info Information Visualization Beatriz Sousa Santos,
MATH BOOK OF PROBLEMS SERIES. New from Pearson Custom Publishing!
 MATH BOOK OF PROBLEMS SERIES New from Pearson Custom Publishing! The Math Book of Problems Series is a database of math problems for the following courses: Pre-algebra Algebra Pre-calculus Calculus Statistics
RnavGraph: A visualization tool for navigating through high-dimensional data
 Int. Statistical Inst.: Proc. 58th World Statistical Congress, 2011, Dublin (Session IPS117) p.1852 RnavGraph: A visualization tool for navigating through high-dimensional data Waddell, Adrian University
The Big Picture. Describing Data: Categorical and Quantitative Variables Population. Descriptive Statistics. Community Coalitions (n = 175)
") Describing Data: Categorical and Quantitative Variables Population The Big Picture Sampling Statistical Inference Sample Exploratory Data Analysis Descriptive Statistics In order to make sense of data,
Describing Data: Categorical and Quantitative Variables Population The Big Picture Sampling Statistical Inference Sample Exploratory Data Analysis Descriptive Statistics In order to make sense of data,