COSC 6344 Visualization
|
|
|
- Timothy Cole
- 8 years ago
- Views:
Transcription
1 COSC 64 Visualization University of Houston, Fall 2015 Instructor: Guoning Chen

2 Course Information Location: AH 2 Time: 10am~11:am Tu/Th Office Hours: 11:am~12:pm Tu /Th or by appointment Office: PGH 566 Course webpage: ll2015/visualization_fall2015.html

3 Course Information Prerequisites: Knowledge and experience in programming, especially C/C++ programming. Knowledge on linear algebra, calculus, geometry, numerical analysis. Experience on computer graphics and OpenGL (recommended) Textbook: (recommended) Alexandru C. Telea, Data Visualization: Principles and Practice, A.K.Peters, 2008 Charles D. Hansen and Chris R. Johnson, Visualization Handbook, Elsevier, 2004 Introduction to Information Visualization. Riccardo Mazza, Springer, 2009 Reading materials and course notes given in class or on course page.

4 Course Information Grading: 6 assignments (50%) 1 mid term exam (15%) 1 final project presentation (%) course participation (10%) Late Policy: Late assignments will be marked off 10% for each weekday that it is late. You can ask for a delay for one assignment for up to 5 weekdays. Academic Dishonesty: Do you own work! No code copy!

5 A Glimpse of the Schedule (tentative) TIMELINE WEEK 1 WEEK 2 WEEK 3 WEEK 4 WEEK 5 WEEK 6 WEEK 7 WEEK 8 WEEK 9 MATERIAL COVERED Class Preliminaries Introduction History of visualization, Visualization pipeline, Data types and representations Elementary plots (Assignment 1 out); OpenGL tutorial, skeleton code Visualization systems; Colors coding for scalar field visualization (Assignment2 out) Iso surfacing; Direct volume rendering Ray casting (Assignment3 out) Direct volume rendering Splatting; Transfer function design (Assignment 4 out) Flow visualization introduction; Flow visualization techniques in 2D (arrow and color plots and streamlines); Streamline placement, Information theory framework Flow visualization techniques in 2D texture based (Assignment 5 out) ; Topology based vector field visualization I Topology based vector field visualization II; Final project topic review Non topological feature based flow visualization; 3D flow visualization (Assignment 6 out) (Final project proposal due) WEEK 10 Mid term exam (IEEE Visualization 2015) WEEK 11 WEEK 12 WEEK 13 WEEK 14 WEEK 15 WEEK 16 Tensor data application introduction and math; Geometric based tensor visualization Texture based tensor field visualization; Glyph based technique Information visualization graph and hierarchy data visualization Information visualization high dimensional data visualization (Thanksgiving) Visual analytics, user study theory Final project presentations
; Streamline placement, Information theory framework Flow visualization techniques in 2D texture based (Assignment 5 out) ; Topology based")
6 Background

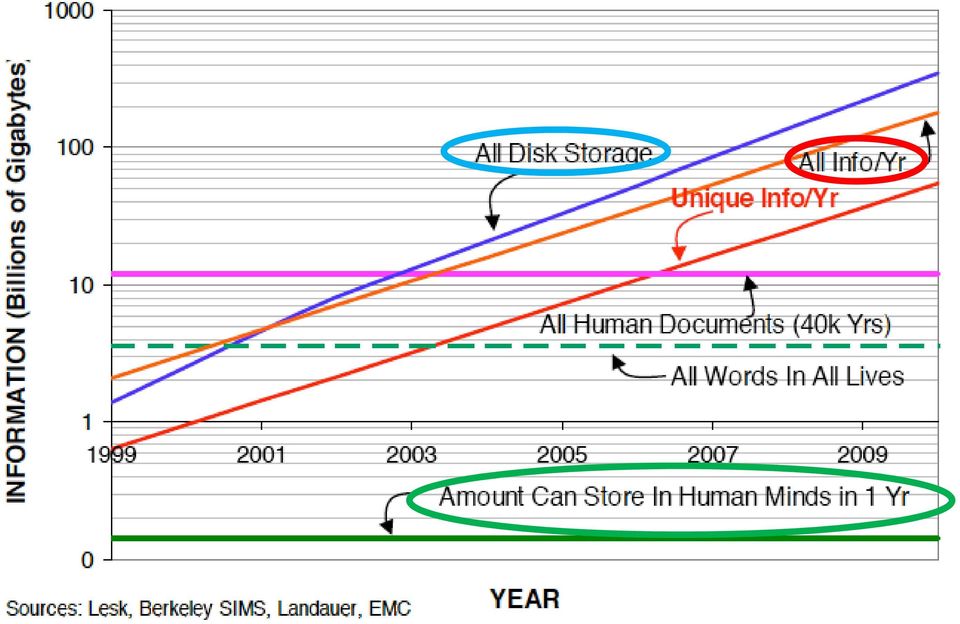
7 Data is generated everywhere and everyday

8
9 How to efficiently help data owners extract useful information (e.g., patterns and trends) and understand it?
 and")
10

11

12

13 Visual representation is one effective way to convey information Cognitive study has shown that human visual system is the most effective channel to transport information to the brain Leading to the introduction of visualization.

14 History of Visualization Visualization = rather old L. da Vinci ( ) Often an intuitive step: graphical illustration Image source:

15 What is Visualization? The Foundation of Modern Visualization? In 1987 the National Science Foundation (of the U.S.) started Visualization in scientific computing as a new discipline, and a panel of the ACM coined the term scientific visualization Scientific visualization, briefly defined: The use of computer graphics for the analysis and presentation of computed or measured scientific data. Oxford Engl. Dict., 1989 to form a mental vision, image, or picture of (something not visible or present to the sight, or of an abstraction); to make visible to the mind or imagination Visualization transforms data into images that effectively and accurately represent information about the data. Schroeder et al. The Visualization Toolkit, 2 nd ed. 1998

16 What is Visualization? The Foundation of Modern Visualization? In 1987 the National Science Foundation (of the U.S.) started Visualization in scientific computing as a new discipline, and a panel of the ACM coined the term scientific visualization Scientific visualization, briefly defined: The use of computer graphics for the analysis and presentation of computed or measured scientific data. Oxford Engl. Dict., 1989 to form a mental vision, image, or picture of (something not visible or present to the sight, or of an abstraction); to make visible to the mind or imagination Visualization transforms data into images that effectively and accurately represent information about the data. Schroeder et al. The Visualization Toolkit, 2 nd ed Means to enable the insights into Data

17 History of Modern Visualization Visualization = being its own discipline for more than years First dedicated conferences: 1990 Conferences: IEEE Visualization (SciVis, InfoVis, VAST) EuroVis PacificVis Others Journals: IEEE Transactions on Visualization and Computer Graphics Computer Graphics Forum Others

18 Why is Visualization Important?

19 Why is Visualization Important? To effectively convey information to data stakeholders

20 Why is Visualization Important? To effectively convey information to data stakeholders To make invisible phenomena visible Combustion source: VACET Aerodynamics around missiles [Kelly et al. Vis06] Astrophysics source: VACET Automobile design [Chen et al. Vis11]

21 Why is Visualization Important? Education
22 Why is Visualization Important? Education
23 Why is Visualization Important? Education
24 Why is Visualization Important? Education Understand mathematical concepts and physical phenomena that are invisible Source: SuperStock Fusion physics Recommended site:
25 What Does Visualization Do? Three types of goals for visualization to present everything known about the data, Vis. used for Communication of Results
26 What Does Visualization Do? Three types of goals for visualization to present everything known about the data, Vis. used for Communication of Results to analyze There are hypotheses, Vis. used for Verification or Falsification
27 What Does Visualization Do? Three types of goals for visualization to present everything known about the data, Vis. used for Communication of Results to analyze There are hypotheses, Vis. used for Verification or Falsification to explore Nothing is known, Vis. used for data exploration
28 Evolution of Visualization Research From direct visualization to derived information visualization. From simple data forms to more complex forms. From represent the data with fidelity to reveal new findings. From scientific visualization to information visualization, bio visualization, geographical data visualization, and beyond.
29 SciVis vs. InfoVis Scientific visualization is mostly concerned with: (physical) spatial or spatio temporal data (dimension < 4) Representation: spatial discretization (or samples) Examples: temperature/pressure fields, potential fields, wind fields, etc. Information visualization focuses on: high dimensional, abstract data (no geometric meaning) discrete data in the nature Examples: financial data, logs and records, tweeter posts, family trees or organization structure, computer/social networks, survey data, etc.
30 Age of Big Data
31 We are not concerned with the big data issue in this course but rather building the foundation for eventually addressing the big data challenges!!!
32 Goals and Topics
33 Goals of this Course Know the representative methods and standards of classic visualization problems Familiar with classical techniques for the visualizations of various data types Able to develop the customized visualization techniques and systems for the practical and research needs
34 Topics to Be Covered in this Course What will be covered? Colors, plots Scalar field visualization Vector field visualization Tensor field visualization Information visualization (graphs, high dimensional, etc.) Hop topics in visualization Will make use of a lot of branches in mathematics Calculus, trigonometry, linear algebra, discrete math, differential geometry, topology, dynamical systems, numerical algebra, etc Will also need knowledge in from the following sub field computer science Algorithms, data structures, graphics, human computer interaction, imaging, etc. It will be a plus+ to have the following background Art and design, Psychophysics, scientific computing
35 Preview of Topics Color theory and visual representation HSV Color Wheel Which is brighter?
36 Plots Preview of Topics
37 Preview of Topics Scalar field visualization 2D is given by a function f(x1,...,xn):rn R with n independent variables xi Examples include high fields, temperatures, pressures, potential energy, eigenvalues, Source: V_Sim drfmc.cea.fr/l_sim/v_sim/
38 Preview of Topics Scalar field visualization 3D Iso surfacing The impact of the ball entering the porous solid from the left Zebra fish head (image by Fluorender)
39 Preview of Topics Scalar field visualization III Topology The impact of the ball entering the porous solid from the left
40 Preview of Topics Vector field visualization I Hedge Hodge Particle tracing Integration based Hurricane Isabel
41 Preview of Topics Vector field visualization II Texture based (Bruno Jobard, Gordon Erlebacher, and M. Yousuff Hussaini)
42 Preview of Topics Vector field visualization III Feature based
43 Preview of Topics Tensor field visualization Second order tensor,,
44 Preview of Topics Tensor field visualization Texture based Geometry based Glyph based
45 Preview of Topics Information visualization Text visualization Graph visualization High dimensional data visualization Tree/hierarchy data visualization
46 Visualization systems Preview of Topics General purpose (open source) Paraview VisIt SCIRun
47 Preview of Topics Recent hot topics in visualization Multi field visualization Uncertainty visualization Big data visualization Novel applications
A Short Introduction on Data Visualization. Guoning Chen
 A Short Introduction on Data Visualization Guoning Chen Data is generated everywhere and everyday Age of Big Data Data in ever increasing sizes need an effective way to understand them History of Visualization
Data Visualization. Principles and Practice. Second Edition. Alexandru Telea
 Data Visualization Principles and Practice Second Edition Alexandru Telea First edition published in 2007 by A K Peters, Ltd. Cover image: The cover shows the combination of scientific visualization and
Outline. Fundamentals. Rendering (of 3D data) Data mappings. Evaluation Interaction
 Data mappings. Evaluation Interaction") Outline Fundamentals What is vis? Some history Design principles The visualization process Data sources and data structures Basic visual mapping approaches Rendering (of 3D data) Scalar fields (isosurfaces
Outline Fundamentals What is vis? Some history Design principles The visualization process Data sources and data structures Basic visual mapping approaches Rendering (of 3D data) Scalar fields (isosurfaces
UNIVERSITY OF MACAU DEPARTMENT OF COMPUTER AND INFORMATION SCIENCE SFTW 463 Data Visualization Syllabus 1 st Semester 2011/2012 Part A Course Outline
 Elective required course in Computer Science UNIVERSITY OF MACAU DEPARTMENT OF COMPUTER AND INFORMATION SCIENCE SFTW 463 Data Visualization Syllabus 1 st Semester 2011/2012 Part A Course Outline Catalog
The Visualization Pipeline
 The Visualization Pipeline Conceptual perspective Implementation considerations Algorithms used in the visualization Structure of the visualization applications Contents The focus is on presenting the
Visualisatie BMT. Introduction, visualization, visualization pipeline. Arjan Kok Huub van de Wetering (h.v.d.wetering@tue.nl)
") Visualisatie BMT Introduction, visualization, visualization pipeline Arjan Kok Huub van de Wetering (h.v.d.wetering@tue.nl) 1 Lecture overview Goal Summary Study material What is visualization Examples
Visualisatie BMT Introduction, visualization, visualization pipeline Arjan Kok Huub van de Wetering (h.v.d.wetering@tue.nl) 1 Lecture overview Goal Summary Study material What is visualization Examples
COMP-557: Fundamentals of Computer Graphics McGill University, Fall 2010
 COMP-557: Fundamentals of Computer Graphics McGill University, Fall 2010 Class times 2:25 PM - 3:55 PM Mondays and Wednesdays Lecture room Trottier Building 2120 Instructor Paul Kry, kry@cs.mcgill.ca Course
Introduction to Computer Graphics
 Introduction to Computer Graphics Torsten Möller TASC 8021 778-782-2215 torsten@sfu.ca www.cs.sfu.ca/~torsten Today What is computer graphics? Contents of this course Syllabus Overview of course topics
High School Mathematics Program. High School Math Sequences
 or High School Mathematics Program High School Math Sequences 9 th Grade 10 th Grade 11 th Grade 12 th Grade *Algebra I Pre- Calculus Personal Finance 9 th Grade 10 th Grade 11 th Grade 12 th Grade Calculus
Big Data in Pictures: Data Visualization
 Big Data in Pictures: Data Visualization Huamin Qu Hong Kong University of Science and Technology What is data visualization? Data visualization is the creation and study of the visual representation of
CAD and Creativity. Contents
 CAD and Creativity K C Hui Department of Automation and Computer- Aided Engineering Contents Various aspects of CAD CAD training in the university and the industry Conveying fundamental concepts in CAD
Universidade de Aveiro Departamento de Electrónica, Telecomunicações e Informática. Introduction to Information Visualization
 Universidade de Aveiro Departamento de Electrónica, Telecomunicações e Informática Introduction to Information Visualization www.portugal-migration.info Information Visualization Beatriz Sousa Santos,
ADVANCED VISUALIZATION
 Cyberinfrastructure Technology Integration (CITI) Advanced Visualization Division ADVANCED VISUALIZATION Tech-Talk by Vetria L. Byrd Visualization Scientist November 05, 2013 THIS TECH TALK Will Provide
DEGREE PLAN INSTRUCTIONS FOR COMPUTER ENGINEERING
 DEGREE PLAN INSTRUCTIONS FOR COMPUTER ENGINEERING Fall 2000 The instructions contained in this packet are to be used as a guide in preparing the Departmental Computer Science Degree Plan Form for the Bachelor's
Mathematics INDIVIDUAL PROGRAM INFORMATION 2014 2015. 866.Macomb1 (866.622.6621) www.macomb.edu
 www.macomb.edu") Mathematics INDIVIDUAL PROGRAM INFORMATION 2014 2015 866.Macomb1 (866.622.6621) www.macomb.edu Mathematics PROGRAM OPTIONS CREDENTIAL TITLE CREDIT HOURS REQUIRED NOTES Associate of Arts Mathematics 62
Mathematics INDIVIDUAL PROGRAM INFORMATION 2014 2015 866.Macomb1 (866.622.6621) www.macomb.edu Mathematics PROGRAM OPTIONS CREDENTIAL TITLE CREDIT HOURS REQUIRED NOTES Associate of Arts Mathematics 62
MATHEMATICS. Administered by the Department of Mathematical and Computing Sciences within the College of Arts and Sciences. Degree Requirements
 MATHEMATICS Administered by the Department of Mathematical and Computing Sciences within the College of Arts and Sciences. Paul Feit, PhD Dr. Paul Feit is Professor of Mathematics and Coordinator for Mathematics.
SAN DIEGO COMMUNITY COLLEGE DISTRICT CITY COLLEGE ASSOCIATE DEGREE COURSE OUTLINE
 MATH 098 CIC Approval: BOT APPROVAL: STATE APPROVAL: EFFECTIVE TERM: SAN DIEGO COMMUNITY COLLEGE DISTRICT CITY COLLEGE ASSOCIATE DEGREE COURSE OUTLINE SECTION I SUBJECT AREA AND COURSE NUMBER: Mathematics
VISUALIZATION STRATEGIES AND TECHNIQUES FOR HIGH-DIMENSIONAL SPATIO- TEMPORAL DATA
 VISUALIZATION STRATEGIES AND TECHNIQUES FOR HIGH-DIMENSIONAL SPATIO- TEMPORAL DATA Summary B. Schmidt, U. Streit and Chr. Uhlenküken University of Münster Institute of Geoinformatics Robert-Koch-Str. 28
MATHEMATICS Department Chair: Michael Cordova - mccordova@dcsdk12.org
 MATHEMATICS Department Chair: Michael Cordova - mccordova@dcsdk12.org Course Offerings Grade 9 Algebra I Algebra II/Trig Honors Geometry Honors Geometry Grade 10 Integrated Math II (2014-2015 only) Algebra
Course Overview. CSCI 480 Computer Graphics Lecture 1. Administrative Issues Modeling Animation Rendering OpenGL Programming [Angel Ch.
 CSCI 480 Computer Graphics Lecture 1 Course Overview January 14, 2013 Jernej Barbic University of Southern California http://www-bcf.usc.edu/~jbarbic/cs480-s13/ Administrative Issues Modeling Animation
Introduction to Information Visualization
 Universidade de Aveiro Departamento de Electrónica, Telecomunicações e Informática Introduction to Information Visualization www.portugal-migration.info Information Visualization Beatriz Sousa Santos,
Introduction to Visualization with VTK and ParaView
 Introduction to Visualization with VTK and ParaView R. Sungkorn and J. Derksen Department of Chemical and Materials Engineering University of Alberta Canada August 24, 2011 / LBM Workshop 1 Introduction
How To Create A Data Visualization
 CSCI 552 Data Visualization Shiaofen Fang What Is Visualization? We observe and draw conclusions A picture says more than a thousand words/numbers Seeing is believing, seeing is understanding Beware of
PHILOSOPHY OF THE MATHEMATICS DEPARTMENT
 PHILOSOPHY OF THE MATHEMATICS DEPARTMENT The Lemont High School Mathematics Department believes that students should develop the following characteristics: Understanding of concepts and procedures Building
CSCD18: Computer Graphics
 CSCD18: Computer Graphics Professor: Office: Office hours: Teaching Assistant: Office hours: Lectures: Tutorials: Website: Leonid Sigal lsigal@utsc.utoronto.ca ls@cs.toronto.edu Room SW626 Monday 12:00-1:00pm
Basic Math Course Map through algebra and calculus
 Basic Math Course Map through algebra and calculus This map shows the most common and recommended transitions between courses. A grade of C or higher is required to move from one course to the next. For
Mathematics 301: Elementary Geometry COURSE SYLLABUS: Fall 2013
 Mathematics 301: Elementary Geometry COURSE SYLLABUS: Fall 2013 Instructor: Vanessa Huse, Ed.D. Office Location: Bain Center, 228 Navarro College Center-Corsicana Office Hours: Wednesday 2:00-5:00, Online
Computer Science. General Education Students must complete the requirements shown in the General Education Requirements section of this catalog.
 Computer Science Dr. Ilhyun Lee Professor Dr. Ilhyun Lee is a Professor of Computer Science. He received his Ph.D. degree from Illinois Institute of Technology, Chicago, Illinois (1996). He was selected
Institution : Majmaah University. Academic Department : College of Science at AzZulfi. Programme : Computer Science and Information Course :
 Institution : Majmaah University. Academic Department : College of Science at AzZulfi. Programme : Computer Science and Information Course : Computer Graphics (CSI-425) Course Coordinator : Mr. ISSA ALSMADI
MATHEMATICS 152, FALL 2004 METHODS OF DISCRETE MATHEMATICS
 MATHEMATICS 152, FALL 2004 METHODS OF DISCRETE MATHEMATICS Last revised: September 14, 2004 Instructor: Paul Bamberg Offices: SC 423, 495-1748 and Quincy House 102, 493-3100. Quincy 102 opens off the Quincy
Computer Science Information Sheet for entry in 2016. What is Computer Science?
 Computer Science Information Sheet for entry in 2016 What is Computer Science? Computer Science is about understanding computer systems and networks at a deep level. Computers and the programs they run
MATHEMATICS (MATH) 3. Provides experiences that enable graduates to find employment in sciencerelated
 3. Provides experiences that enable graduates to find employment in sciencerelated") 194 / Department of Natural Sciences and Mathematics MATHEMATICS (MATH) The Mathematics Program: 1. Provides challenging experiences in Mathematics, Physics, and Physical Science, which prepare graduates
194 / Department of Natural Sciences and Mathematics MATHEMATICS (MATH) The Mathematics Program: 1. Provides challenging experiences in Mathematics, Physics, and Physical Science, which prepare graduates
Stephanie A. Mungle TEACHING PHILOSOPHY STATEMENT
 Stephanie A. Mungle TEACHING PHILOSOPHY STATEMENT I am a self-directed, enthusiastic college mathematics educator with a strong commitment to student learning and excellence in teaching. I bring my passion
Diablo Valley College Catalog 2014-2015
 Mathematics MATH Michael Norris, Interim Dean Math and Computer Science Division Math Building, Room 267 Possible career opportunities Mathematicians work in a variety of fields, among them statistics,
MIDLAND ISD ADVANCED PLACEMENT CURRICULUM STANDARDS AP ENVIRONMENTAL SCIENCE
 Science Practices Standard SP.1: Scientific Questions and Predictions Asking scientific questions that can be tested empirically and structuring these questions in the form of testable predictions SP.1.1
COMP175: Computer Graphics. Lecture 1 Introduction and Display Technologies
 COMP175: Computer Graphics Lecture 1 Introduction and Display Technologies Course mechanics Number: COMP 175-01, Fall 2009 Meetings: TR 1:30-2:45pm Instructor: Sara Su (sarasu@cs.tufts.edu) TA: Matt Menke
Prerequisite: High School Chemistry.
 ACT 101 Financial Accounting The course will provide the student with a fundamental understanding of accounting as a means for decision making by integrating preparation of financial information and written
Further Steps: Geometry Beyond High School. Catherine A. Gorini Maharishi University of Management Fairfield, IA cgorini@mum.edu
 Further Steps: Geometry Beyond High School Catherine A. Gorini Maharishi University of Management Fairfield, IA cgorini@mum.edu Geometry the study of shapes, their properties, and the spaces containing
Math 3E - Linear Algebra (3 units)
") Math 3E - Linear Algebra (3 units) Fall 2015 Peralta Class Code 40772 Berkeley City College Class Hours & Location: TuTh 11AM- 12:15PM, BCC Room 422 (Fourth Floor) Instructor: Patrick Zulkowski Office
Math 3E - Linear Algebra (3 units) Fall 2015 Peralta Class Code 40772 Berkeley City College Class Hours & Location: TuTh 11AM- 12:15PM, BCC Room 422 (Fourth Floor) Instructor: Patrick Zulkowski Office
Visualization and Astronomy
 Visualization and Astronomy Prof.dr. Jos Roerdink Institute for Mathematics and Computing Science University of Groningen URL: www.cs.rug.nl/svcg/ Scientific Visualization & Computer Graphics Group Institute
Professional Organization Checklist for the Computer Science Curriculum Updates. Association of Computing Machinery Computing Curricula 2008
 Professional Organization Checklist for the Computer Science Curriculum Updates Association of Computing Machinery Computing Curricula 2008 The curriculum guidelines can be found in Appendix C of the report
Visualization with ParaView
 Visualization with ParaView Before we begin Make sure you have ParaView 4.1.0 installed so you can follow along in the lab section http://paraview.org/paraview/resources/software.php Background http://www.paraview.org/
Information Visualization WS 2013/14 11 Visual Analytics
 1 11.1 Definitions and Motivation Lot of research and papers in this emerging field: Visual Analytics: Scope and Challenges of Keim et al. Illuminating the path of Thomas and Cook 2 11.1 Definitions and
Introduction to Flow Visualization
 Introduction to Flow Visualization This set of slides developed by Prof. Torsten Moeller, at Simon Fraser Univ and Professor Jian Huang, at University of Tennessee, Knoxville And some other presentation
Luna Community College 2012-2015. Drafting Technology Curriculum Profile
 Revised: July 2012 Luna Community College 2012-2015 Drafting Technology Curriculum Profile Content Page Program Goals 2 Degree Requirements 3 Course Descriptions and Outcomes 5 Assessment. 10 Standard
COURSE SYLLABUS. Office Hours: MWF 08:30am-09:55am or by appointment, DAV 238
 USF, St. Petersburg MAC 1105 College Algebra (ref #20214 ) COURSE SYLLABUS Term: Spring 2011 Section: 602 Department: MTH College: AP Credit hours: 3 Instructor: Olena Maymeskul Email: olenam@mail.usf.edu
Credit Number Lecture Lab / Shop Clinic / Co-op Hours. MAC 224 Advanced CNC Milling 1 3 0 2. MAC 229 CNC Programming 2 0 0 2
 MAC 224 Advanced CNC Milling 1 3 0 2 This course covers advanced methods in setup and operation of CNC machining centers. Emphasis is placed on programming and production of complex parts. Upon completion,
Sequence of Mathematics Courses
 Sequence of ematics Courses Where do I begin? Associates Degree and Non-transferable Courses (For math course below pre-algebra, see the Learning Skills section of the catalog) MATH M09 PRE-ALGEBRA 3 UNITS
Awareness of lifetime physical and mental wellness Physical Education Included in a degree or certificate program: Yes No Noncredit Category:
 CourseID: ENGR 8 Discipline: Engineering TOP: 901.00 - Engineering, General CB21: Y = Not Applicable CC Approval: 11/02/2015 Effective Date: 01/11/2016 BOT Approval: 12/08/2015 Degree/Transfer Status:
Alabama Department of Postsecondary Education
 Date Adopted 1998 Dates reviewed 2007, 2011, 2013 Dates revised 2004, 2008, 2011, 2013, 2015 Alabama Department of Postsecondary Education Representing Alabama s Public Two-Year College System Jefferson
Design and Deployment of Specialized Visualizations for Weather-Sensitive Electric Distribution Operations
 Fourth Symposium on Policy and Socio-Economic Research 4.1 Design and Deployment of Specialized Visualizations for Weather-Sensitive Electric Distribution Operations Lloyd A. Treinish IBM, Yorktown Heights,
APPLICATION FOR PART-TIME EMPLOYMENT AS A TUTOR TUTOR IN THE DOLCIANI MATHEMATICS LEARNING CENTER
 APPLICATION FOR PART-TIME EMPLOYMENT AS A TUTOR TUTOR IN THE DOLCIANI MATHEMATICS LEARNING CENTER Dear Applicant, As you consider applying for a position in the Dolciani Mathematics Learning Center, there
Department of Computer Science
 113 Department of Computer Science Chairperson: Nasri, Ahmad H. Professor: Nasri, Ahmad H. Associate Professors: Attie, Paul C.; Karam, Marcel R.; Turkiyyah, George M. Assistant Professors: Abu Salem,
DATA VISUALIZATION. Lecture 1 Introduction. Lin Lu http://vr.sdu.edu.cn/~lulin/ llu@sdu.edu.cn
 DATA VISUALIZATION Lecture 1 Introduction Lin Lu http://vr.sdu.edu.cn/~lulin/ llu@sdu.edu.cn Visualization 可 视 化 Visualization now seen as key part of modern computing High performance computing generates
SEMESTER PLANS FOR MATH COURSES, FOR MAJORS OUTSIDE MATH.
 SEMESTER PLANS FOR MATH COURSES, FOR MAJORS OUTSIDE MATH. CONTENTS: AP calculus credit and Math Placement levels. List of semester math courses. Student pathways through the semester math courses Transition
Office: D-116-9. Instructor: Vanessa Jones. Phone: (714) 628-4948. Office Hours: Monday & Wednesday 1:30pm-2:30pm. Email: Jones Vanessa@sccollege.
 628-4948. Office Hours: Monday & Wednesday 1:30pm-2:30pm. Email: Jones Vanessa@sccollege.") Fall Semester 2015 Santiago Canyon College: Mathematics & Sciences Division (Room SC-210) MATH 80: Intermediate Algebra (Section Number 10247) Tuesday & Thursday 10:30 am-1:00pm (Room SC-110) Instructor:
Fall Semester 2015 Santiago Canyon College: Mathematics & Sciences Division (Room SC-210) MATH 80: Intermediate Algebra (Section Number 10247) Tuesday & Thursday 10:30 am-1:00pm (Room SC-110) Instructor:
Visualization Techniques in Data Mining
 Tecniche di Apprendimento Automatico per Applicazioni di Data Mining Visualization Techniques in Data Mining Prof. Pier Luca Lanzi Laurea in Ingegneria Informatica Politecnico di Milano Polo di Milano
Physics 21-Bio: University Physics I with Biological Applications Syllabus for Spring 2012
 Physics 21-Bio: University Physics I with Biological Applications Syllabus for Spring 2012 Class Information Instructor: Prof. Mark Reeves (Samson 214, reevesme@gwu.edu 46279) Office Hours: Tuesday 4:30-5:15
Mathematics Education Master of Education Degree Program PROFESSIONAL PORTFOLIO RUBRIC Candidate: ID#: Date: Evaluator:
 Mathematics Education Master of Education Degree Program PROFESSIONAL PORTFOLIO RUBRIC Candidate: ID#: Date: Evaluator: Recommendations: Evaluator Signature: Grade: PASS FAIL Developing Acceptable Optimum
Math 161A-01: College Algebra and Trigonometry I Meeting Days: MW 9:31am 11:30am Room : D9
 Math 161A-01: College Algebra and Trigonometry I Meeting Days: MW 9:31am 11:30am Room : D9 INSTRUCTOR INFORMATION: Name: Steve S. Lam, Associate Professor Contact No: 735-5600 Office Hrs.: MW 8:30am 9:30am
Introduction to Computer Graphics. Jürgen P. Schulze, Ph.D. University of California, San Diego Fall Quarter 2012
 CSE 167: Introduction to Computer Graphics Jürgen P. Schulze, Ph.D. University of California, San Diego Fall Quarter 2012 Today Course organization Course overview 2 Course Staff Instructor Jürgen Schulze,
An example. Visualization? An example. Scientific Visualization. This talk. Information Visualization & Visual Analytics. 30 items, 30 x 3 values
 Information Visualization & Visual Analytics Jack van Wijk Technische Universiteit Eindhoven An example y 30 items, 30 x 3 values I-science for Astronomy, October 13-17, 2008 Lorentz center, Leiden x An
How To Understand And Understand The Theory Of Computational Finance
 This course consists of three separate modules. Coordinator: Omiros Papaspiliopoulos Module I: Machine Learning in Finance Lecturer: Argimiro Arratia, Universitat Politecnica de Catalunya and BGSE Overview
MayaVi: A free tool for CFD data visualization
 MayaVi: A free tool for CFD data visualization Prabhu Ramachandran Graduate Student, Dept. Aerospace Engg. IIT Madras, Chennai, 600 036. e mail: prabhu@aero.iitm.ernet.in Keywords: Visualization, CFD data,
ROCHESTER INSTITUTE OF TECHNOLOGY COURSE OUTLINE FORM COLLEGE OF SCIENCE. School of Mathematical Sciences
 ! ROCHESTER INSTITUTE OF TECHNOLOGY COURSE OUTLINE FORM COLLEGE OF SCIENCE School of Mathematical Sciences New Revised COURSE: COS-MATH-101 College Algebra 1.0 Course designations and approvals: Required
FDVis: the Interactive Visualization and Steering Environment for the Computational Processes Using the Finite-Difference Method
 Nonlinear Analysis: Modelling and Control, 2003, Vol. 8, No. 2, 71 82 FDVis: the Interactive Visualization and Steering Environment for the Computational Processes Using the Finite-Difference Method A.
Interactive Visualization of Magnetic Fields
 JOURNAL OF APPLIED COMPUTER SCIENCE Vol. 21 No. 1 (2013), pp. 107-117 Interactive Visualization of Magnetic Fields Piotr Napieralski 1, Krzysztof Guzek 1 1 Institute of Information Technology, Lodz University
STAT 360 Probability and Statistics. Fall 2012
 STAT 360 Probability and Statistics Fall 2012 1) General information: Crosslisted course offered as STAT 360, MATH 360 Semester: Fall 2012, Aug 20--Dec 07 Course name: Probability and Statistics Number
Computer Animation and Visualisation. Lecture 1. Introduction
 Computer Animation and Visualisation Lecture 1 Introduction 1 Today s topics Overview of the lecture Introduction to Computer Animation Introduction to Visualisation 2 Introduction (PhD in Tokyo, 2000,
Computer Graphics and Visualization in a Computational Science Program
 Computer Graphics and Visualization in a Computational Science Program Steve Cunningham California State University Stanislaus Oregon State University, October 16, 2000 The imperative to scientific visualization
Information Visualization and Visual Analytics 可 视 化 与 可 视 分 析 简 介. Xiaoru Yuan School of EECS, Peking University Aug 14th, 2010
 Information Visualization and Visual Analytics 可 视 化 与 可 视 分 析 简 介 Xiaoru Yuan School of EECS, Peking University Aug 14th, 2010 1 2 Ted Roslling s Talk 3 What is Visualization 4 Napoleon s March to Moscow,
Instructor. Goals. Image Synthesis Examples. Applications. Computer Graphics. Why Study 3D Computer Graphics?
 Computer Graphics Motivation: Why do we study 3D Graphics? http://www.cs.ucsd.edu/~ravir Instructor http://www.cs.ucsd.edu/~ravir PhD Stanford, 2002. PhD thesis developed Spherical Harmonic Lighting widely
International Foundation Programme
 International Foundation Programme Academic direction by: ifp Join the world class The International Foundation Programme equips you with the skills and knowledge necessary to embark on a wide range of
Course Descriptions: Undergraduate/Graduate Certificate Program in Data Visualization and Analysis
 9/3/2013 Course Descriptions: Undergraduate/Graduate Certificate Program in Data Visualization and Analysis Seton Hall University, South Orange, New Jersey http://www.shu.edu/go/dava Visualization and
How To Learn To Program In Csc 406 Computer Graphics
 CSC 406 Computer Graphics Fall 2011 1 CSC 406 Computer Graphics Geometry, Modeling, and Animation Fall 2011 Lectures Tyler Hall, Room 052 Monday, 6:30-9:15 PM Professor Jean-Yves Hervé Tyler Hall, Room
MATH 101-07: College Algebra Fall 2013
 MATH 101-07: College Algebra Fall 2013 Course Meeting Location: Wickersham 101 Class Meetings: 5:00-5:50 MTR (CRN 4821) Course Instructor of Record: Dr. Cynthia Taylor Ph (Office): (717) 871-2417 E-mail:
PRECALCULUS WITH INTERNET-BASED PARALLEL REVIEW
 PRECALCULUS WITH INTERNET-BASED PARALLEL REVIEW Rafael MARTÍNEZ-PLANELL Daniel MCGEE Deborah MOORE Keith WAYLAND Yuri ROJAS University of Puerto Rico at Mayagüez PO Box 9018, Mayagüez, PR 00681 e-mail:
Visualization Process. Alark Joshi
 Visualization Process Alark Joshi Task-specific Visualization Design LA Treinish, Task-specific visualization design, IEEE Computer Graphics and Applications, 1999 Generalized visualization systems are
Prentice Hall: Middle School Math, Course 1 2002 Correlated to: New York Mathematics Learning Standards (Intermediate)
") New York Mathematics Learning Standards (Intermediate) Mathematical Reasoning Key Idea: Students use MATHEMATICAL REASONING to analyze mathematical situations, make conjectures, gather evidence, and construct
New York Mathematics Learning Standards (Intermediate) Mathematical Reasoning Key Idea: Students use MATHEMATICAL REASONING to analyze mathematical situations, make conjectures, gather evidence, and construct
M E M O R A N D U M. Faculty Senate Approved April 2, 2015
 M E M O R A N D U M Faculty Senate Approved April 2, 2015 TO: FROM: Deans and Chairs Becky Bitter, Sr. Assistant Registrar DATE: March 26, 2015 SUBJECT: Minor Change Bulletin No. 11 The courses listed
What is Visualization? Information Visualization An Overview. Information Visualization. Definitions
 What is Visualization? Information Visualization An Overview Jonathan I. Maletic, Ph.D. Computer Science Kent State University Visualize/Visualization: To form a mental image or vision of [some
Visualization of Software
 Visualization of Software Jack van Wijk Plenary Meeting SPIder Den Bosch, March 30, 2010 Overview Software Vis Examples Hierarchies Networks Evolution Visual Analytics Application data Visualization images
Visualization with ParaView. Greg Johnson
 Visualization with Greg Johnson Before we begin Make sure you have 3.8.0 installed so you can follow along in the lab section http://paraview.org/paraview/resources/software.html http://www.paraview.org/
PROCESS FOR APPROVING NON- IAI- GENERAL EDUCATION CORE CURRICULUM (GECC) COURSES FOR GENERAL EDUCATION CREDIT
 COURSES FOR GENERAL EDUCATION CREDIT") 1 PROCESS FOR APPROVING NON- IAI- GENERAL EDUCATION CORE CURRICULUM (GECC) COURSES FOR GENERAL EDUCATION CREDIT Step 1: Program/course owner reviews non- IAI- GECC course currently accepted for General
1 PROCESS FOR APPROVING NON- IAI- GENERAL EDUCATION CORE CURRICULUM (GECC) COURSES FOR GENERAL EDUCATION CREDIT Step 1: Program/course owner reviews non- IAI- GECC course currently accepted for General
MATH 0110 Developmental Math Skills Review, 1 Credit, 3 hours lab
 MATH 0110 Developmental Math Skills Review, 1 Credit, 3 hours lab MATH 0110 is established to accommodate students desiring non-course based remediation in developmental mathematics. This structure will
AML710 CAD LECTURE 1. Introduction to CAD. Motivation Principles of CAD / CAM. AML710 Computer Aided Design
 AML710 CAD LECTURE 1 Introduction to CAD Motivation Principles of CAD / CAM AML710 Computer Aided Design L-T-P 3-0-2 : 4 Credits Prerequisites and background Course Coordinator Course Webpage http://web.iitd.ac.in/~hegde/cad
Pre-Calculus Semester 1 Course Syllabus
 Pre-Calculus Semester 1 Course Syllabus The Plano ISD eschool Mission is to create a borderless classroom based on a positive student-teacher relationship that fosters independent, innovative critical
Information Systems. Administered by the Department of Mathematical and Computing Sciences within the College of Arts and Sciences.
 Information Systems Dr. Haesun Lee Professor Dr. Haesun Lee is a Professor of Computer Science. She received her Ph.D. degree from Illinois Institute of Technology, Chicago, Illinois (1997). Her primary
MATH. ALGEBRA I HONORS 9 th Grade 12003200 ALGEBRA I HONORS
 * Students who scored a Level 3 or above on the Florida Assessment Test Math Florida Standards (FSA-MAFS) are strongly encouraged to make Advanced Placement and/or dual enrollment courses their first choices
Bachelor and Master of Science degrees in Mathematics and Statistics at University of Helsinki
 Bachelor and Master of Science degrees in Mathematics and Statistics at University of Helsinki Hans-Olav Tylli Department of Mathematics and Statistics University of Helsinki department web-page: http://mathstat.helsinki.fi/index.en.html
MATHEMATICAL SCIENCES, BACHELOR OF SCIENCE (B.S.) WITH A CONCENTRATION IN APPLIED MATHEMATICS
 WITH A CONCENTRATION IN APPLIED MATHEMATICS") VCU MATHEMATICAL SCIENCES, BACHELOR OF SCIENCE (B.S.) WITH A CONCENTRATION IN APPLIED MATHEMATICS The curriculum in mathematical sciences promotes understanding of the mathematical sciences and their structures,
VCU MATHEMATICAL SCIENCES, BACHELOR OF SCIENCE (B.S.) WITH A CONCENTRATION IN APPLIED MATHEMATICS The curriculum in mathematical sciences promotes understanding of the mathematical sciences and their structures,
PHYS 1624 University Physics I. PHYS 2644 University Physics II
 PHYS 1624 Physics I An introduction to mechanics, heat, and wave motion. This is a calculus- based course for Scientists and Engineers. 4 hours (3 lecture/3 lab) Prerequisites: Credit for MATH 2413 (Calculus
Master of Arts in Mathematics
 Master of Arts in Mathematics Administrative Unit The program is administered by the Office of Graduate Studies and Research through the Faculty of Mathematics and Mathematics Education, Department of
Senior High Mathematics in Nova Scotia Schools
 Senior High Mathematics in Nova Scotia Schools Implementation Schedule for High School Course Mathematics at Work 10 Mathematics 10 Mathematics at Work 11 Mathematics 11 Pre-Calculus 11 Mathematics at
Carleton University School of Computer Science COMP 3009 - Computer graphics Fall 2015
 Carleton University School of Computer Science COMP 3009 - Computer graphics Fall 2015 Class Schedule Classroom HP4125 Class Time Tuesday and Thursday 16:00-18:00 Curese Website Information is on CULearn
Core Curriculum to the Course:
 Core Curriculum to the Course: Environmental Science Law Economy for Engineering Accounting for Engineering Production System Planning and Analysis Electric Circuits Logic Circuits Methods for Electric
Mathematics 220, Spring 2014 Multivariable Calculus
 Mathematics 220, Spring 2014 Multivariable Calculus Larry Riddle Buttrick 327 LRiddle@AgnesScott.edu Telephone Ext. 6222 Required Text Multivariable Calculus, by McCallum, Hughes-Hallett, Gleason, et al.,
Mathematics (MAT) MAT 061 Basic Euclidean Geometry 3 Hours. MAT 051 Pre-Algebra 4 Hours
 MAT 061 Basic Euclidean Geometry 3 Hours. MAT 051 Pre-Algebra 4 Hours") MAT 051 Pre-Algebra Mathematics (MAT) MAT 051 is designed as a review of the basic operations of arithmetic and an introduction to algebra. The student must earn a grade of C or in order to enroll in MAT
MAT 051 Pre-Algebra Mathematics (MAT) MAT 051 is designed as a review of the basic operations of arithmetic and an introduction to algebra. The student must earn a grade of C or in order to enroll in MAT
International Foundation Programme Academic direction by:
 International Foundation Programme Academic direction by: www.londoninternational.ac.uk/ifp The University of London International Foundation Programme has been designed to equip students with the skills