Cours de Visualisation d'information InfoVis Lecture. Multivariate Data Sets
|
|
|
- Bertina Watkins
- 8 years ago
- Views:
Transcription
1 Cours de Visualisation d'information InfoVis Lecture Multivariate Data Sets Frédéric Vernier Maître de conférence / Lecturer Univ. Paris Sud Inspired from CS John Stasko CS Chris North

2 Data Sets Ø Data comes in many different forms Ø Typically, not in the way you want it Ø How is stored (in the raw)? Ø Heterogeneous data often seen as multiple dimensions of elements extracted by patterns or needs.

3 Data set!

4 Schema Ø Cars Ø brand Ø model Ø year Ø cost Ø size Ø weights Ø miles per gallon Ø 1 M2R InfoVis Lecture Univ. Paris Sud

5 Data Tables Ø Often, we take raw data and transform it into a form that is more workable Ø Main idea: Ø Individual items are called cases Ø Cases have variables (attributes)

6 Variable Types Ø N-Nominal (equal or not equal to other values) Ø Example: gender, hair color (blond, brown, black, red) Ø O-Ordinal (obeys < relation, ordered set) Ø Example: soccer leagues, rainbow colors Ø Q-Quantitative (can do math on them) Ø Example: age, photoshop colors
 Ø Example: age,")
7 Variable Types Ø Three main types of variables Ø N-Nominal Ø By Class: data belong or not to classes (.org,.com,.fr) Ø Partially ordered: order on classes (engineer students) Ø O-Ordinal Ø Q-Quantitative Ø Quantitative + 0 (clear 0) Ø Sometimes the type depends on the context Ø O-Ordinal is always possible
 Ø Sometimes the type depends on")
8 Example Baseball statistics

9 Metadata Ø Descriptive information about the data Ø Might be something as simple as the type of a variable, or could be more complex (INT) Ø For times when the table itself just isn t enoughi Ø AtBats Hit HomeRuns Ø if YearInMasterLeague =1 then AtBats=CareerAtBat Ø if player is injured more than half of the season the avg do not take into account this season Ø 1rst season stats are not backed-up by the

10 How Many Variables? Ø Data sets of dimensions 1,2,3 are common Ø Number of variables per class Ø 1 - Univariate data (e.g timeline) Ø 2 - Bivariate data (e.g maps) Ø 3 - Trivariate data (volume) Ø >3 - Hypervariate data (???) Ø Example: Ø Cases always the same
 Ø 3 - Trivariate data (volume) Ø >3 - Hypervariate data (?")
11 Univariate Ø Representations Ø Dot plot Ø Bar chart (item vs. attribute) Ø Tukey box plot Ø Histogram 7 Bill 5 3 1

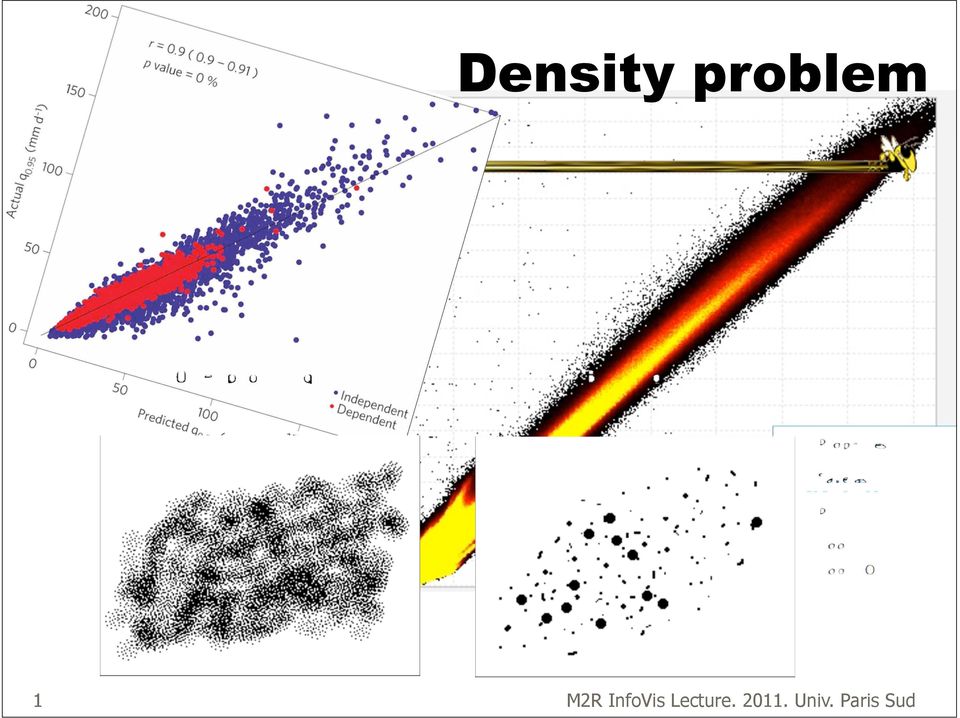
12 Bivariate Ø Scatterplot Common BUT Powerful

13 Density problem
14 Trivariate Ø 3D scatterplot, 2D plot+size 2D plot+color, 3x barchart

15 Hypervariate Data Ø What about data sets with MANY variables? Ø Often the interesting ones Ø n-d What does 10-D space look like?

16 Multiple Projections Give each variable its own display 1 A B C D E A B C D E What if more than 4 cases?

17 Help me Infovis! Ø smart layout Ø using graphical

18 Scatterplot Matrix All pair of variables in their own 2-D scatterplot Brushing (subset) & Linking (sync.) [Voigt, 2002]

19 label, dot plot, scale Histogram > dot plot for distribution Scale row & column

20 On steroids

21 Chernoff Faces Encode different variables values in characteristics of human face
22 Simple Example [Turner, 1977] [Spinelli and Zhou, 2004]
23 On steroids Look at faces, not colors 1 M2R InfoVis Lecture Univ. Paris Sud
24 Star Plots / Glyphs Var 5 Var 1 Value Var 2 Space out the n variables at equal angles around a circle Var 4 Var 3 Each spoke encodes a variable s value
25 examples circular // coords Star plot or Glyph plot => freedom on layout!
26 On prednizone... just 2 dims [bertillon] population x percent foreigners area = number of foreigners
27 On steroids (count)
28 On steroids (dim)
29 Star Coordinates E. Kandogan, Star Coordinates: A Multi-dimensional Visualization Technique with Uniform Treatment of Dimensions, InfoVis 2000 Late-Breaking Hot Topics, Oct. 2000
30 Demo - Interaction Ø Activate/ deactivate axis Ø Color selection or axis Ø Glyph coordinates Ø Scale axis Ø Rotate axis Ø Dot size Ø Brushing on axis Ø Trail Ø Inspector Ø Panning
31 Parallel Coordinates By A. Inselberg Encode variables along a horizontal row Vertical line specifies values V1 V2 V3 V4 V5
32 Parallel Coords Example Basic Grayscale From: Dean F. Jerding and John T. Stasko Color
33 And more cars
34 With brushing
35 and more brushing
36 On steroids
37 VisDB Ø Database of data items, each of n dimensions Ø Issue a query that specifies a target value of the dimensions Ø Often get back no exact matches Ø Want to find near matches Ø Relevance factor Ø metadata Taken from: D. Keim, H-P Kriegel, VisDB Database Exploration Using Multid Vis, IEEE CG&A, 1994.
38 Technique Ø Calculate relevance of all data points Ø Sort items based on relevance Ø Use spiral technique to order the values Ø Color items based on relevance High Empirically established Low
39 Display Methodology Highest relevance value in center, decreasing values grow outward Items ordered by total relevance Spiral in each window Total relevance Dim 1 Dim 2 Same item appears in same place in each window Dim 5 Dim 4 Dim 3
40 Figure from Paper
41 Example Display
42 Alternative Ø Grouping arrangement => single window Ø Create all relevance dimensional depictions for an item and group them Ø Spiral out the different data items
43 Example 8 dimensions 1000 items Multi-window Grouping
44 On Steroids?
45 Overview Scatterplot Matrix Chernoff Faces Star Plots / Glyphs Star Coordinates Parallel Coordinates Spiral plots
46 More techniques? Ø Combinations Ø More integrated software Ø legacy spreadsheet layout
47 Seelt
48 Highlighted Dynamic Table Viewer Nada Golmie & Bill Kules
49 InfoZoom
50 SpotFire
51 Spotfire
52 Advizor
53 IBM ILOG Discovery
54 Eureka / TableLens Rao & Card 94
55 Focus + context
56 EZChooser: K. Wittenburg
57 Comparisons Ø ParCood: <1000 items, <20 attrs Ø Relate between adjacent attr pairs Ø StarCoord: <1,000,000 items, <20 attrs Ø Interaction intensive Ø TableLens: similar to par-coords Ø more items with aggregation Ø Relate 1:m attrs (sorting), short learn time Ø Visdb: 100,000 items with 10 attrs Ø Items*attrs = screenspace, long learn time, must query Ø Spotfire: <1,000,000 items, <10 attrs (DQ many) Ø Filtering, short learn time
58 MultiVariate Visu Tools INTERACTION is the key!
59 Paper presentations Ø Hajar Falih Ø Multi-Dimensional Detective Ø Thibaut Jacob Ø Rolling the Dice: Multidimensional Visual Exploration using Scatterplot Matrix Navigation 06/12/ min Lecture: Multi-dimensional Data Visualization Δ 10 min Break 30 min Paper presentations (students) 40 min Lab work on Processing: interaction Δ (Dragicevic & Vernier)
Multi-Dimensional Data Visualization. Slides courtesy of Chris North
 Multi-Dimensional Data Visualization Slides courtesy of Chris North What is the Cleveland s ranking for quantitative data among the visual variables: Angle, area, length, position, color Where are we?!
Information Visualization Multivariate Data Visualization Krešimir Matković
 Information Visualization Multivariate Data Visualization Krešimir Matković Vienna University of Technology, VRVis Research Center, Vienna Multivariable >3D Data Tables have so many variables that orthogonal
Visualization Techniques in Data Mining
 Tecniche di Apprendimento Automatico per Applicazioni di Data Mining Visualization Techniques in Data Mining Prof. Pier Luca Lanzi Laurea in Ingegneria Informatica Politecnico di Milano Polo di Milano
Data Visualization. or Graphical Data Presentation. Jerzy Stefanowski Instytut Informatyki
 Data Visualization or Graphical Data Presentation Jerzy Stefanowski Instytut Informatyki Data mining for SE -- 2013 Ack. Inspirations are coming from: G.Piatetsky Schapiro lectures on KDD J.Han on Data
Visualizing Data. Contents. 1 Visualizing Data. Anthony Tanbakuchi Department of Mathematics Pima Community College. Introductory Statistics Lectures
 Introductory Statistics Lectures Visualizing Data Descriptive Statistics I Department of Mathematics Pima Community College Redistribution of this material is prohibited without written permission of the
The Value of Visualization 2
 The Value of Visualization 2 G Janacek -0.69 1.11-3.1 4.0 GJJ () Visualization 1 / 21 Parallel coordinates Parallel coordinates is a common way of visualising high-dimensional geometry and analysing multivariate
Visual Data Mining with Pixel-oriented Visualization Techniques
 Visual Data Mining with Pixel-oriented Visualization Techniques Mihael Ankerst The Boeing Company P.O. Box 3707 MC 7L-70, Seattle, WA 98124 mihael.ankerst@boeing.com Abstract Pixel-oriented visualization
Chapter 3 - Multidimensional Information Visualization II
 Chapter 3 - Multidimensional Information Visualization II Concepts for visualizing univariate to hypervariate data Vorlesung Informationsvisualisierung Prof. Dr. Florian Alt, WS 2013/14 Konzept und Folien
Diagrams and Graphs of Statistical Data
 Diagrams and Graphs of Statistical Data One of the most effective and interesting alternative way in which a statistical data may be presented is through diagrams and graphs. There are several ways in
Hypervariate Information Visualization
 Hypervariate Information Visualization Florian Müller Abstract In the last 20 years improvements in the computer sciences made it possible to store large data sets containing a plethora of different data
TIBCO Spotfire Business Author Essentials Quick Reference Guide. Table of contents:
 Table of contents: Access Data for Analysis Data file types Format assumptions Data from Excel Information links Add multiple data tables Create & Interpret Visualizations Table Pie Chart Cross Table Treemap
Large Scale Information Visualization. Jing Yang Fall 2007. Interaction. A major portion of these slides come from John Stasko s course slides
 Large Scale Information Visualization Jing Yang Fall 2007 1 Interaction A major portion of these slides come from John Stasko s course slides 2 1 What is Interaction? From Google: Reciprocal action between
Visualization methods for patent data
 Visualization methods for patent data Treparel 2013 Dr. Anton Heijs (CTO & Founder) Delft, The Netherlands Introduction Treparel can provide advanced visualizations for patent data. This document describes
Time Series Data Visualization
 Time Series Data Visualization Time Series Data Fundamental chronological component to the data set Random sample of 4000 graphics from 15 of world s newspapers and magazines from 74-80 found that 75%
CS171 Visualization. The Visualization Alphabet: Marks and Channels. Alexander Lex alex@seas.harvard.edu. [xkcd]
![CS171 Visualization. The Visualization Alphabet: Marks and Channels. Alexander Lex alex@seas.harvard.edu. [xkcd]](/thumbs/39/19465011.jpg "CS171 Visualization. The Visualization Alphabet: Marks and Channels. Alexander Lex alex@seas.harvard.edu. [xkcd]") CS171 Visualization Alexander Lex alex@seas.harvard.edu The Visualization Alphabet: Marks and Channels [xkcd] This Week Thursday: Task Abstraction, Validation Homework 1 due on Friday! Any more problems
CS171 Visualization Alexander Lex alex@seas.harvard.edu The Visualization Alphabet: Marks and Channels [xkcd] This Week Thursday: Task Abstraction, Validation Homework 1 due on Friday! Any more problems
20 A Visualization Framework For Discovering Prepaid Mobile Subscriber Usage Patterns
 20 A Visualization Framework For Discovering Prepaid Mobile Subscriber Usage Patterns John Aogon and Patrick J. Ogao Telecommunications operators in developing countries are faced with a problem of knowing
Visualization Quick Guide
 Visualization Quick Guide A best practice guide to help you find the right visualization for your data WHAT IS DOMO? Domo is a new form of business intelligence (BI) unlike anything before an executive
TIES443. Lecture 9: Visualization. Lecture 9. Course webpage: http://www.cs.jyu.fi/~mpechen/ties443. November 17, 2006
 TIES443 Lecture 9 Visualization Mykola Pechenizkiy Course webpage: http://www.cs.jyu.fi/~mpechen/ties443 Department of Mathematical Information Technology University of Jyväskylä November 17, 2006 1 Topics
Analyzing The Role Of Dimension Arrangement For Data Visualization in Radviz
 Analyzing The Role Of Dimension Arrangement For Data Visualization in Radviz Luigi Di Caro 1, Vanessa Frias-Martinez 2, and Enrique Frias-Martinez 2 1 Department of Computer Science, Universita di Torino,
Step-by-Step Guide to Bi-Parental Linkage Mapping WHITE PAPER
 Step-by-Step Guide to Bi-Parental Linkage Mapping WHITE PAPER JMP Genomics Step-by-Step Guide to Bi-Parental Linkage Mapping Introduction JMP Genomics offers several tools for the creation of linkage maps
Iris Sample Data Set. Basic Visualization Techniques: Charts, Graphs and Maps. Summary Statistics. Frequency and Mode
 Iris Sample Data Set Basic Visualization Techniques: Charts, Graphs and Maps CS598 Information Visualization Spring 2010 Many of the exploratory data techniques are illustrated with the Iris Plant data
Big Data: Rethinking Text Visualization
 Big Data: Rethinking Text Visualization Dr. Anton Heijs anton.heijs@treparel.com Treparel April 8, 2013 Abstract In this white paper we discuss text visualization approaches and how these are important
Visual Data Mining : the case of VITAMIN System and other software
 Visual Data Mining : the case of VITAMIN System and other software Alain MORINEAU a.morineau@noos.fr Data mining is an extension of Exploratory Data Analysis in the sense that both approaches have the
Introduction to Multivariate Analysis
 Introduction to Multivariate Analysis Lecture 1 August 24, 2005 Multivariate Analysis Lecture #1-8/24/2005 Slide 1 of 30 Today s Lecture Today s Lecture Syllabus and course overview Chapter 1 (a brief
Visualization of Multivariate Data. Dr. Yan Liu Department of Biomedical, Industrial and Human Factors Engineering Wright State University
 Visualization of Multivariate Data Dr. Yan Liu Department of Biomedical, Industrial and Human Factors Engineering Wright State University Introduction Multivariate (Multidimensional) Visualization Visualization
Business Intelligence and Process Modelling
 Business Intelligence and Process Modelling F.W. Takes Universiteit Leiden Lecture 2: Business Intelligence & Visual Analytics BIPM Lecture 2: Business Intelligence & Visual Analytics 1 / 72 Business Intelligence
INFO 424, UW ischool 11/1/2007
 Today s Lecture Goals of interactive infovis Interactive Visualization Tuesday 30 Oct 2007 Polle Zellweger Techniques showing both overview and detail showing details-on-demand more Examples Dynamic Queries
Data Mining: Exploring Data. Lecture Notes for Chapter 3. Slides by Tan, Steinbach, Kumar adapted by Michael Hahsler
 Data Mining: Exploring Data Lecture Notes for Chapter 3 Slides by Tan, Steinbach, Kumar adapted by Michael Hahsler Topics Exploratory Data Analysis Summary Statistics Visualization What is data exploration?
Data exploration with Microsoft Excel: analysing more than one variable
 Data exploration with Microsoft Excel: analysing more than one variable Contents 1 Introduction... 1 2 Comparing different groups or different variables... 2 3 Exploring the association between categorical
Data Mining: Exploring Data. Lecture Notes for Chapter 3. Introduction to Data Mining
 Data Mining: Exploring Data Lecture Notes for Chapter 3 Introduction to Data Mining by Tan, Steinbach, Kumar Tan,Steinbach, Kumar Introduction to Data Mining 8/05/2005 1 What is data exploration? A preliminary
Exploratory Data Analysis
 Exploratory Data Analysis Johannes Schauer johannes.schauer@tugraz.at Institute of Statistics Graz University of Technology Steyrergasse 17/IV, 8010 Graz www.statistics.tugraz.at February 12, 2008 Introduction
Exploratory data analysis (Chapter 2) Fall 2011
 Fall 2011") Exploratory data analysis (Chapter 2) Fall 2011 Data Examples Example 1: Survey Data 1 Data collected from a Stat 371 class in Fall 2005 2 They answered questions about their: gender, major, year in school,
Exploratory data analysis (Chapter 2) Fall 2011 Data Examples Example 1: Survey Data 1 Data collected from a Stat 371 class in Fall 2005 2 They answered questions about their: gender, major, year in school,
How To Use Statgraphics Centurion Xvii (Version 17) On A Computer Or A Computer (For Free)
 On A Computer Or A Computer (For Free)") Statgraphics Centurion XVII (currently in beta test) is a major upgrade to Statpoint's flagship data analysis and visualization product. It contains 32 new statistical procedures and significant upgrades
Statgraphics Centurion XVII (currently in beta test) is a major upgrade to Statpoint's flagship data analysis and visualization product. It contains 32 new statistical procedures and significant upgrades
Information Visualization. Ronald Peikert SciVis 2007 - Information Visualization 10-1
 Information Visualization Ronald Peikert SciVis 2007 - Information Visualization 10-1 Overview Techniques for high-dimensional data scatter plots, PCA parallel coordinates link + brush pixel-oriented techniques
Connecting Segments for Visual Data Exploration and Interactive Mining of Decision Rules
 Journal of Universal Computer Science, vol. 11, no. 11(2005), 1835-1848 submitted: 1/9/05, accepted: 1/10/05, appeared: 28/11/05 J.UCS Connecting Segments for Visual Data Exploration and Interactive Mining
Infographics in the Classroom: Using Data Visualization to Engage in Scientific Practices
 Infographics in the Classroom: Using Data Visualization to Engage in Scientific Practices Activity 4: Graphing and Interpreting Data In Activity 4, the class will compare different ways to graph the exact
CREATING EXCEL PIVOT TABLES AND PIVOT CHARTS FOR LIBRARY QUESTIONNAIRE RESULTS
 CREATING EXCEL PIVOT TABLES AND PIVOT CHARTS FOR LIBRARY QUESTIONNAIRE RESULTS An Excel Pivot Table is an interactive table that summarizes large amounts of data. It allows the user to view and manipulate
The course: An Introduction to Information Visualization Techniques for Exploring Large Database
 The course: An Introduction to Information Visualization Techniques for Exploring Large Database Jing Yang Fall 2006 www.cs.uncc.edu/~jyang13 1 Multi-dimensional Data Visualization 2 1 Parallel Coordinates
Visualization Software
 Visualization Software Maneesh Agrawala CS 294-10: Visualization Fall 2007 Assignment 1b: Deconstruction & Redesign Due before class on Sep 12, 2007 1 Assignment 2: Creating Visualizations Use existing
TEXT-FILLED STACKED AREA GRAPHS Martin Kraus
 Martin Kraus Text can add a significant amount of detail and value to an information visualization. In particular, it can integrate more of the data that a visualization is based on, and it can also integrate
DATA LAYOUT AND LEVEL-OF-DETAIL CONTROL FOR FLOOD DATA VISUALIZATION
 DATA LAYOUT AND LEVEL-OF-DETAIL CONTROL FOR FLOOD DATA VISUALIZATION Sayaka Yagi Takayuki Itoh Ochanomizu University Mayumi Kurokawa Yuuichi Izu Takahisa Yoneyama Takashi Kohara Toshiba Corporation ABSTRACT
There are six different windows that can be opened when using SPSS. The following will give a description of each of them.
 SPSS Basics Tutorial 1: SPSS Windows There are six different windows that can be opened when using SPSS. The following will give a description of each of them. The Data Editor The Data Editor is a spreadsheet
DAY 11: EXCEL REVIEW MICROSOFT ACCESS (INTRO) Naman Kohli naman.kohli@mail.wvu.edu September 24, 2013
 Naman Kohli naman.kohli@mail.wvu.edu September 24, 2013") DAY 11: EXCEL REVIEW MICROSOFT ACCESS (INTRO) Naman Kohli naman.kohli@mail.wvu.edu September 24, 2013 1 UPCOMING DEADLINES Homework 3 27 th Sep Exam 1 Microsoft Excel 1 st October 2 HOMEWORK 3 HELP LIVE
DAY 11: EXCEL REVIEW MICROSOFT ACCESS (INTRO) Naman Kohli naman.kohli@mail.wvu.edu September 24, 2013 1 UPCOMING DEADLINES Homework 3 27 th Sep Exam 1 Microsoft Excel 1 st October 2 HOMEWORK 3 HELP LIVE
RnavGraph: A visualization tool for navigating through high-dimensional data
 Int. Statistical Inst.: Proc. 58th World Statistical Congress, 2011, Dublin (Session IPS117) p.1852 RnavGraph: A visualization tool for navigating through high-dimensional data Waddell, Adrian University
TIPS FOR DOING STATISTICS IN EXCEL
 TIPS FOR DOING STATISTICS IN EXCEL Before you begin, make sure that you have the DATA ANALYSIS pack running on your machine. It comes with Excel. Here s how to check if you have it, and what to do if you
Principles of Data Visualization for Exploratory Data Analysis. Renee M. P. Teate. SYS 6023 Cognitive Systems Engineering April 28, 2015
 Principles of Data Visualization for Exploratory Data Analysis Renee M. P. Teate SYS 6023 Cognitive Systems Engineering April 28, 2015 Introduction Exploratory Data Analysis (EDA) is the phase of analysis
Investigating the Direct Manipulation of Ranking Tables for Time Navigation
 Investigating the Direct Manipulation of Ranking Tables for Time Navigation Romain Vuillemot, Charles Perin To cite this version: Romain Vuillemot, Charles Perin. Investigating the Direct Manipulation
Data Visualization - A Very Rough Guide
 Data Visualization - A Very Rough Guide Ken Brodlie University of Leeds 1 What is This Thing Called Visualization? Visualization Use of computersupported, interactive, visual representations of data to
Examples of Data Representation using Tables, Graphs and Charts
 Examples of Data Representation using Tables, Graphs and Charts This document discusses how to properly display numerical data. It discusses the differences between tables and graphs and it discusses various
Basics of Dimensional Modeling
 Basics of Dimensional Modeling Data warehouse and OLAP tools are based on a dimensional data model. A dimensional model is based on dimensions, facts, cubes, and schemas such as star and snowflake. Dimensional
Exercise 1.12 (Pg. 22-23)
") Individuals: The objects that are described by a set of data. They may be people, animals, things, etc. (Also referred to as Cases or Records) Variables: The characteristics recorded about each individual.
Individuals: The objects that are described by a set of data. They may be people, animals, things, etc. (Also referred to as Cases or Records) Variables: The characteristics recorded about each individual.
9. Text & Documents. Visualizing and Searching Documents. Dr. Thorsten Büring, 20. Dezember 2007, Vorlesung Wintersemester 2007/08
 9. Text & Documents Visualizing and Searching Documents Dr. Thorsten Büring, 20. Dezember 2007, Vorlesung Wintersemester 2007/08 Slide 1 / 37 Outline Characteristics of text data Detecting patterns SeeSoft
Visual Mining of E-Customer Behavior Using Pixel Bar Charts
 Visual Mining of E-Customer Behavior Using Pixel Bar Charts Ming C. Hao, Julian Ladisch*, Umeshwar Dayal, Meichun Hsu, Adrian Krug Hewlett Packard Research Laboratories, Palo Alto, CA. (ming_hao, dayal)@hpl.hp.com;
ComVis: a Coordinated Multiple Views System for Prototyping New Visualization Technology
 ComVis: a Coordinated Multiple Views System for Prototyping New Visualization Technology Krešimir Matković Wolfgang Freiler Denis Gračanin Helwig Hauser VRVis Research Center VRVis Research Center Virginia
What is Visualization? Information Visualization An Overview. Information Visualization. Definitions
 What is Visualization? Information Visualization An Overview Jonathan I. Maletic, Ph.D. Computer Science Kent State University Visualize/Visualization: To form a mental image or vision of [some
Visualization of missing values using the R-package VIM
 Institut f. Statistik u. Wahrscheinlichkeitstheorie 040 Wien, Wiedner Hauptstr. 8-0/07 AUSTRIA http://www.statistik.tuwien.ac.at Visualization of missing values using the R-package VIM M. Templ and P.
SAS BI Dashboard 4.3. User's Guide. SAS Documentation
 SAS BI Dashboard 4.3 User's Guide SAS Documentation The correct bibliographic citation for this manual is as follows: SAS Institute Inc. 2010. SAS BI Dashboard 4.3: User s Guide. Cary, NC: SAS Institute
an introduction to VISUALIZING DATA by joel laumans
 an introduction to VISUALIZING DATA by joel laumans an introduction to VISUALIZING DATA iii AN INTRODUCTION TO VISUALIZING DATA by Joel Laumans Table of Contents 1 Introduction 1 Definition Purpose 2 Data
An example. Visualization? An example. Scientific Visualization. This talk. Information Visualization & Visual Analytics. 30 items, 30 x 3 values
 Information Visualization & Visual Analytics Jack van Wijk Technische Universiteit Eindhoven An example y 30 items, 30 x 3 values I-science for Astronomy, October 13-17, 2008 Lorentz center, Leiden x An
Hierarchy and Tree Visualization
 Hierarchy and Tree Visualization Definition Hierarchies An ordering of groups in which larger groups encompass sets of smaller groups. Data repository in which cases are related to subcases Hierarchical
V-Miner: Using Enhanced Parallel Coordinates to Mine Product Design and Test Data 1
 V-Miner: Using Enhanced Parallel Coordinates to Mine Product Design and Test Data 1 Kaidi Zhao, Bing Liu Department of Computer Science University of Illinois at Chicago 851 S. Morgan St., Chicago, IL
Lecture 2: Descriptive Statistics and Exploratory Data Analysis
 Lecture 2: Descriptive Statistics and Exploratory Data Analysis Further Thoughts on Experimental Design 16 Individuals (8 each from two populations) with replicates Pop 1 Pop 2 Randomly sample 4 individuals
A Comparative Study of Visualization Techniques for Data Mining
 A Comparative Study of Visualization Techniques for Data Mining A Thesis Submitted To The School of Computer Science and Software Engineering Monash University By Robert Redpath In fulfilment of the requirements
Enterprise Data Warehouse (EDW) UC Berkeley Peter Cava Manager Data Warehouse Services October 5, 2006
 UC Berkeley Peter Cava Manager Data Warehouse Services October 5, 2006") Enterprise Data Warehouse (EDW) UC Berkeley Peter Cava Manager Data Warehouse Services October 5, 2006 What is a Data Warehouse? A data warehouse is a subject-oriented, integrated, time-varying, non-volatile
Enterprise Data Warehouse (EDW) UC Berkeley Peter Cava Manager Data Warehouse Services October 5, 2006 What is a Data Warehouse? A data warehouse is a subject-oriented, integrated, time-varying, non-volatile
High Dimensional Data Visualization
 High Dimensional Data Visualization Sándor Kromesch, Sándor Juhász Department of Automation and Applied Informatics, Budapest University of Technology and Economics, Budapest, Hungary Tel.: +36-1-463-3969;
Data Visualization Techniques
 Data Visualization Techniques From Basics to Big Data with SAS Visual Analytics WHITE PAPER SAS White Paper Table of Contents Introduction.... 1 Generating the Best Visualizations for Your Data... 2 The
Visibility optimization for data visualization: A Survey of Issues and Techniques
 Visibility optimization for data visualization: A Survey of Issues and Techniques Ch Harika, Dr.Supreethi K.P Student, M.Tech, Assistant Professor College of Engineering, Jawaharlal Nehru Technological
Information visualization examples
 Information visualization examples 350102: GenICT II 37 Information visualization examples 350102: GenICT II 38 Information visualization examples 350102: GenICT II 39 Information visualization examples
SPSS Manual for Introductory Applied Statistics: A Variable Approach
 SPSS Manual for Introductory Applied Statistics: A Variable Approach John Gabrosek Department of Statistics Grand Valley State University Allendale, MI USA August 2013 2 Copyright 2013 John Gabrosek. All
Tableau Data Visualization Cookbook
 Tableau Data Visualization Cookbook Ashutosh Nandeshwar Chapter No. 4 "Creating Multivariate Charts" In this package, you will find: A Biography of the author of the book A preview chapter from the book,
Enhancing Data Visualization Techniques
 Enhancing Data Visualization Techniques José Fernando Rodrigues Jr., Agma J. M. Traina, Caetano Traina Jr. Computer Science Department University of Sao Paulo at Sao Carlos - Brazil Avenida do Trabalhador
Instructions for Creating Silly Survey Database
 Instructions for Creating Silly Survey Database Create a New Database 1. Find the shortcut or the file that starts MS Access and click it to activate the program. 2. In the Create a New Database Using
Chapter 2: Frequency Distributions and Graphs
 Chapter 2: Frequency Distributions and Graphs Learning Objectives Upon completion of Chapter 2, you will be able to: Organize the data into a table or chart (called a frequency distribution) Construct
Exploratory Data Analysis with MATLAB
 Computer Science and Data Analysis Series Exploratory Data Analysis with MATLAB Second Edition Wendy L Martinez Angel R. Martinez Jeffrey L. Solka ( r ec) CRC Press VV J Taylor & Francis Group Boca Raton
The Forgotten JMP Visualizations (Plus Some New Views in JMP 9) Sam Gardner, SAS Institute, Lafayette, IN, USA
 Sam Gardner, SAS Institute, Lafayette, IN, USA") Paper 156-2010 The Forgotten JMP Visualizations (Plus Some New Views in JMP 9) Sam Gardner, SAS Institute, Lafayette, IN, USA Abstract JMP has a rich set of visual displays that can help you see the information
Paper 156-2010 The Forgotten JMP Visualizations (Plus Some New Views in JMP 9) Sam Gardner, SAS Institute, Lafayette, IN, USA Abstract JMP has a rich set of visual displays that can help you see the information
38 August 2001/Vol. 44, No. 8 COMMUNICATIONS OF THE ACM
 This cluster visualization shows an intermediatelevel view of a five-dimensional, 16,000-record remote-sensing data set. Lines indicate cluster centers and bands indicate the extent of the clusters in
CSU, Fresno - Institutional Research, Assessment and Planning - Dmitri Rogulkin
 My presentation is about data visualization. How to use visual graphs and charts in order to explore data, discover meaning and report findings. The goal is to show that visual displays can be very effective
GGobi : Interactive and dynamic
 GGobi : Interactive and dynamic data visualization system Bioinformatics and Biostatistics Lab., Seoul National Univ. Seoul, Korea Eun-Kyung Lee 1 Outline interactive and dynamic graphics Exploratory data
COM CO P 5318 Da t Da a t Explora Explor t a ion and Analysis y Chapte Chapt r e 3
 COMP 5318 Data Exploration and Analysis Chapter 3 What is data exploration? A preliminary exploration of the data to better understand its characteristics. Key motivations of data exploration include Helping
GeoGebra. 10 lessons. Gerrit Stols
 GeoGebra in 10 lessons Gerrit Stols Acknowledgements GeoGebra is dynamic mathematics open source (free) software for learning and teaching mathematics in schools. It was developed by Markus Hohenwarter
Data Warehousing and Decision Support. Introduction. Three Complementary Trends. Chapter 23, Part A
 Data Warehousing and Decision Support Chapter 23, Part A Database Management Systems, 2 nd Edition. R. Ramakrishnan and J. Gehrke 1 Introduction Increasingly, organizations are analyzing current and historical
Extend Table Lens for High-Dimensional Data Visualization and Classification Mining
 Extend Table Lens for High-Dimensional Data Visualization and Classification Mining CPSC 533c, Information Visualization Course Project, Term 2 2003 Fengdong Du fdu@cs.ubc.ca University of British Columbia
Data Mining: Exploring Data. Lecture Notes for Chapter 3. Introduction to Data Mining
 Data Mining: Exploring Data Lecture Notes for Chapter 3 Introduction to Data Mining by Tan, Steinbach, Kumar What is data exploration? A preliminary exploration of the data to better understand its characteristics.
Tutorial 3: Graphics and Exploratory Data Analysis in R Jason Pienaar and Tom Miller
 Tutorial 3: Graphics and Exploratory Data Analysis in R Jason Pienaar and Tom Miller Getting to know the data An important first step before performing any kind of statistical analysis is to familiarize
Introduction Course in SPSS - Evening 1
 ETH Zürich Seminar für Statistik Introduction Course in SPSS - Evening 1 Seminar für Statistik, ETH Zürich All data used during the course can be downloaded from the following ftp server: ftp://stat.ethz.ch/u/sfs/spsskurs/
3D Interactive Information Visualization: Guidelines from experience and analysis of applications
 3D Interactive Information Visualization: Guidelines from experience and analysis of applications Richard Brath Visible Decisions Inc., 200 Front St. W. #2203, Toronto, Canada, rbrath@vdi.com 1. EXPERT
Data Visualization Principles: Interaction, Filtering, Aggregation
 Data Visualization Principles: Interaction, Filtering, Aggregation CSC444 Acknowledgments for today s lecture: What if there s too much data? Sometimes you can t present all the data in a single plot (Your
What Does the Normal Distribution Sound Like?
 What Does the Normal Distribution Sound Like? Ananda Jayawardhana Pittsburg State University ananda@pittstate.edu Published: June 2013 Overview of Lesson In this activity, students conduct an investigation
6 th Annual EclipseCon Introduction to BIRT Report Development. John Ward
 6 th Annual EclipseCon Introduction to BIRT Report Development John Ward BIRT and Us Who am I? Who are you? Who am I? John Ward, BIRT user Independent BIRT Enthusiast Author: Practical Data Analysis and
Statistics Chapter 2
 Statistics Chapter 2 Frequency Tables A frequency table organizes quantitative data. partitions data into classes (intervals). shows how many data values are in each class. Test Score Number of Students
Reporting. Understanding Advanced Reporting Features for Managers
 Reporting Understanding Advanced Reporting Features for Managers Performance & Talent Management Performance & Talent Management combines tools and processes that allow employees to focus and integrate
A Taxonomy of Visualization Techniques using the Data State Reference Model
 A Taxonomy of s using the State Reference Model Ed H. Chi Xerox Palo Alto Research Center 3333 Coyote Hill Road, Palo Alto, CA 94301 echi@parc.xerox.com ABSTRACT In previous work, researchers have attempted
Developing Web and Mobile Dashboards with Oracle ADF
 Developing Web and Mobile Dashboards with Oracle ADF In this lab you ll build a web dashboard that displays data from the database in meaningful ways. You are going to leverage Oracle ADF the Oracle Application
Excel Companion. (Profit Embedded PHD) User's Guide
 User's Guide") Excel Companion (Profit Embedded PHD) User's Guide Excel Companion (Profit Embedded PHD) User's Guide Copyright, Notices, and Trademarks Copyright, Notices, and Trademarks Honeywell Inc. 1998 2001. All
Excel Companion (Profit Embedded PHD) User's Guide Excel Companion (Profit Embedded PHD) User's Guide Copyright, Notices, and Trademarks Copyright, Notices, and Trademarks Honeywell Inc. 1998 2001. All
Criteria for Evaluating Visual EDA Tools
 Criteria for Evaluating Visual EDA Tools Stephen Few, Perceptual Edge Visual Business Intelligence Newsletter April/May/June 2012 We visualize data for various purposes. Specific purposes direct us to
Scatter Plots with Error Bars
 Chapter 165 Scatter Plots with Error Bars Introduction The procedure extends the capability of the basic scatter plot by allowing you to plot the variability in Y and X corresponding to each point. Each
Big Data in Pictures: Data Visualization
 Big Data in Pictures: Data Visualization Huamin Qu Hong Kong University of Science and Technology What is data visualization? Data visualization is the creation and study of the visual representation of
Flexible Web Visualization for Alert-Based Network Security Analytics
 Flexible Web Visualization for Alert-Based Network Security Analytics Lihua Hao 1, Christopher G. Healey 1, Steve E. Hutchinson 2 1 North Carolina State University, 2 U.S. Army Research Laboratory lhao2@ncsu.edu
Data Exploration and Preprocessing. Data Mining and Text Mining (UIC 583 @ Politecnico di Milano)
") Data Exploration and Preprocessing Data Mining and Text Mining (UIC 583 @ Politecnico di Milano) References Jiawei Han and Micheline Kamber, "Data Mining: Concepts and Techniques", The Morgan Kaufmann
Data Exploration and Preprocessing Data Mining and Text Mining (UIC 583 @ Politecnico di Milano) References Jiawei Han and Micheline Kamber, "Data Mining: Concepts and Techniques", The Morgan Kaufmann
Exploratory Spatial Data Analysis
 Exploratory Spatial Data Analysis Part II Dynamically Linked Views 1 Contents Introduction: why to use non-cartographic data displays Display linking by object highlighting Dynamic Query Object classification