Multi-Dimensional Data Visualization. Slides courtesy of Chris North
|
|
|
- Edward Chapman
- 9 years ago
- Views:
Transcription
1 Multi-Dimensional Data Visualization Slides courtesy of Chris North

2 What is the Cleveland s ranking for quantitative data among the visual variables: Angle, area, length, position, color

3 Where are we?! Tabular (multi-dimensional) " Spatial & Temporal " 1D / 2D " 3D " Networks " Trees " Graphs " Text & Documents # Fundamentals / Eval " Navigation strategies " Overview strategies " Interaction techniques " Design " Development " Evaluation

4 The Simple Stuff Univariate Bivariate Trivariate

5 Univariate Dot plot Bar chart (item vs. attribute) Tukey box plot Histogram
 Tukey")
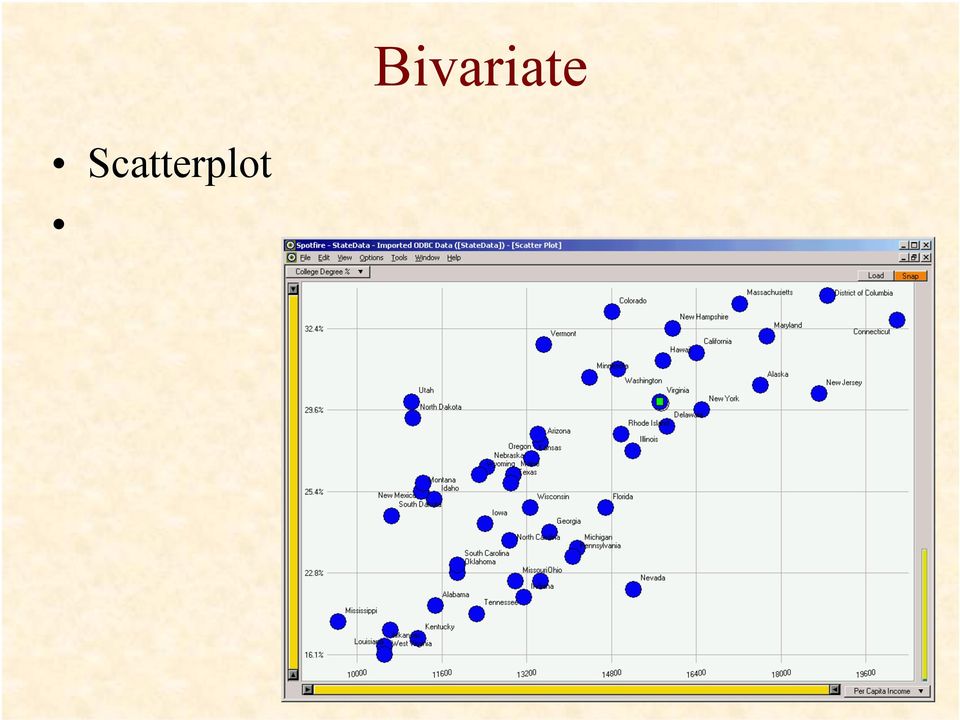
6 Bivariate Scatterplot
7 Trivariate 3D scatterplot, spin plot 2D plot + size (or color )

8 Multi-Dimensional Data Each attribute defines a dimension Small # of dimensions easy Data mapping, Cleveland s rules What about many dimensional data? n-d What does 10-D space look like?

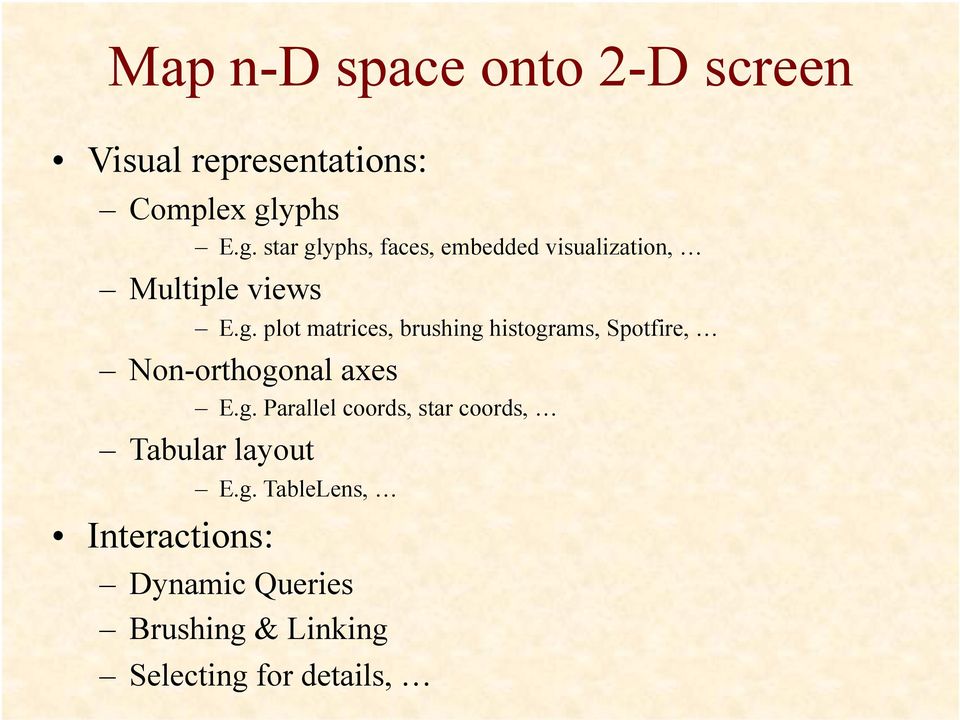
9 Map n-d space onto 2-D screen Visual representations: Complex glyphs E.g. star glyphs, faces, embedded visualization, Multiple views E.g. plot matrices, brushing histograms, Spotfire, Non-orthogonal axes E.g. Parallel coords, star coords, Tabular layout Interactions: E.g. TableLens, Dynamic Queries Brushing & Linking Selecting for details,
10 10 Parameters: Glyphs: Chernoff Faces Head Eccentricity Eye Eccentricity Pupil Size Eyebrow Slope Nose Size Mouth Vertical Offset Eye Spacing Eye Size Mouth Width Mouth Openness

11 Glyphs: Stars d7 d1 d2 d6 d5 d4 d3 PDF/Fuchs_2013_EOA.pdf

12 Multiple Views with Brushing-and-linking Robert Kosara: brush and linking, Parallel Coordinates:

13 All pairs of attributes Brushing and linking Scatterplot Matrix

14 on steroids

15 Different Arrangements of Axes Axes are good Lays out all points in a single space position is 1 st in Cleveland s rules Uniform treatment of dimensions Space > 3D? Must trash orthogonality

16 Parallel Coordinates Inselberg, Multidimensional detective (parallel coordinates)

17 Parallel Coordinates Forget about Cartesian orthogonal axes (0,1,-1,2)= x y z w
= x y")
18 Star Plot Parallel Coordinates with axes arranged radially

19 Star Coordinates Kandogan, Star Coordinates

20 Star Coordinates Cartesian d1 P=(v1, v2) Star Coordinates P=(v1,v2,v3,v4,v5,v6,v7,v8) d1 p d8 v2 v3 d2 v4 v1 v2 d2 d7 v1 p v5 d3 v8 v6 d6 Mapping: Items dots Σ attribute vectors (x,y) d5 v7 d4
")
21 Analysis
22 Table Lens Rao, Table Lens tablelens-chi94.pdf
23 Spenke, FOCUS FOCUS / InfoZoom Finding correlations between the measurements and the occurrence of a thrombosis
24 VisDB & Pixel Bar Charts Keim, VisDB
25
26 Comparison of Techniques
27 Comparison of Techniques ParCood: <1000 items, <20 attrs» Relate between adjacent attr pairs StarCoord: <1,000,000 items, <20 attrs» Interaction intensive TableLens: similar to par-coords» more items with aggregation» Relate 1:m attrs (sorting), short learn time Visdb: 100,000 items with 10 attrs» Items*attrs = screenspace, long learn time, must query Spotfire : <1,000,000 items, <10 attrs (DQ many)» Filtering, short learn time
28 Scaling up further Beyond 20 dimensions? 1. Interaction E.g. Offload some dims to Dynamic Query sliders, 2. Reduce dimensionality of the data E.g. Multi-dimensional scaling (MDS) later 3. Visualize features of the dimensions, instead of the data E.g. rank-by-feature Tableau
29 Seo, et al. Rank-by-Feature
30 Combining multiple data types Multi-Dimensional: PathBubbles: UMBC
31 Demographics data: Exercise Multi-Dimensional attributes (multiple measures over time) Geospatial map Static visual representation, no interaction (must visually relate all attributes to geospatial) Design choices?
32 Your solutions
33 1. Small Multiples Multiple views: 1 or more attribute / map Scalability issues: perception display 1976
34 2. Embedded Visualizations Complex glyphs: For each location, show vis of all attributes
35 2D vs. 3D
36 3. 2D vs. 3D Occlusion shadow changes the colors? Chart junk Patterns -> area; perspectives
37 Texts? 2D vs. 3D: text? Feiner, Augmented reality
38 Mental modal vs. Features VIS externalization media
39 Stereo, tracking, larger FOV? Linsen group, the effect of stereoscopic immersive environment on projection-based multi-dimensional data visualization. IV Tasks: 1. count the cluster; 2/3. find closest cluster to a specific point/cluster; 4. detect the densest cluster; 5. find the most distant cluster pair; 6. count the outliers; 7. find the closest cluster to select group of points; 8. name all of the pairs of overlapping clusters
40 Time series Van wijk and van Selow 99, # of people inside and amount of power used over the course of each day for one full year.
41
42
43 2.5D Petra Isenberg, Hybrid-image vis (2013) Today: Alex Garbarino (pathway analysis)
44 2.5D Seokhee Hong
45 Multi-Dimensional Functions
46 Multi-Dimensional Functions y = f(x 1, x 2, x 3,, x n ) Continuous: E.g. y = x x 2 2-9x 3 Discrete: x i are uniformly sampled in a bounded region E.g. x i = [0,1,2,,100] E.g. measured density in a 3D material under range of pressures and room temperatures.
47 Independent variables Dependent variables Variables
48 Relations: Relations vs. Functions R(A, B, C, D, E, F) All dependent variables (1 ind.var.?) Sparse points in multi-d dep.var. space Functions: well behaved relations R(A, B, C, D, E, F, Y) : Y=f(A, B, C, D, E, F) Many independent variables Defined at every point in multi-d ind.var. space ( onto ) Huge scale: 6D with 10 samples/d = 1,000,000 data points
49 Relation or function? Function Function Relation Neither Function nor Relation?
50 Multi-D Relation Visualizations Don t work well for multi-d functions Example: Parallel coords 5D func sampled on 1-9 for all ind.vars.
51 Typically want to encode ind.vars. as spatial attrs
52 1-D: Easy b = f(a) a x b y b a
53 2-D: Easy c = f(a, b) Height field: a x b y c z c b a
54 2-D: Easy c = f(a, b) b Heat map: a x b y c color a c
55 3-D: Hard d = f(a, b, c) Color volume: a x b y c z d color b c a What s inside?
56 4D: Really Hard y = f(x 1, x 2, x 3, x 4,, x n ) What does a 5D space look like? Approaches: Positioning: Recursive pattern (Keim) Scalable aggregation: immens (Liu) Nested coordinate frames (Worlds within Worlds) Slicing (HyperSlice) Radial Focus+Context (PolarEyez, Sanjini) What we talked about before: filtering overview
57 Position on paper Keim, Recursive pattern: a technique for visualization very large amounts of data
58 Aggregation: Binned plots Liu, Jiang and Heer, immens: Real-time visual querying of big data big : one million or more data cases Bin: adjacent intervals over a continuous range Scalability issues: perception interaction. Novelty: scalability should be limited by the chosen resolution of the visualized data, not the number of records.
59
60 Hierarchical Axes 1D view of 3D function: (Mihalisin et al.) f(x 1, x 2, x 3 ) x3 x2 x1
61 5D 9 samp/d as in TableLens
62
63 5D 9 sample/d
64 Nested Coordinate Frames Feiner, Worlds within Worlds
65 Slicing Van Wijk, HyperSlice
66 Slicing
67 Radial Focus+Context Jayaraman, PolarEyez infovis.cs.vt.edu x2 x1 x3 x4 x5 -x5 -x4 -x2 -x1
68 Comparison Hierarchical axes (Mihalisin): Nested coordinate frames (Worlds in Worlds) Slicing (HyperSlice): Radial Focus+Context (PolarEyez)
69 Comparison Hierarchical axes (Mihalisin): < 6d by 10 samples, ALL slices, view 2d at a time Nested coordinate frames (Worlds in Worlds) < 5-8d, continuous, no overview, 3d hardware Slicing (HyperSlice): < 10d by 100 samples, 2d slices Radial Focus+Context (PolarEyez) < 10d by 1000 samples, overview, all D uniform, rays
70 Review (9/17)
71 Review (9/17) Many ways to look at tables; multi-d data; what are they? Glyph (face; star glyphs; ) Coordinates (star coordinates; parallel coordinates) Table lens
72 Upcoming (9/17) Homework 2 (out tonight, due 9/29) Proposal due (10/20) Title of your final report (begin with the title of the project first) Meeting with the client / advisors Data abstraction Task abstraction Initial design Mandatory: talk to Jian about your project topic next Monday / Wednesday after class 2:30-3:30pm. You MUST have a client.
Cours de Visualisation d'information InfoVis Lecture. Multivariate Data Sets
 Cours de Visualisation d'information InfoVis Lecture Multivariate Data Sets Frédéric Vernier Maître de conférence / Lecturer Univ. Paris Sud Inspired from CS 7450 - John Stasko CS 5764 - Chris North Data
Information Visualization Multivariate Data Visualization Krešimir Matković
 Information Visualization Multivariate Data Visualization Krešimir Matković Vienna University of Technology, VRVis Research Center, Vienna Multivariable >3D Data Tables have so many variables that orthogonal
Diagrams and Graphs of Statistical Data
 Diagrams and Graphs of Statistical Data One of the most effective and interesting alternative way in which a statistical data may be presented is through diagrams and graphs. There are several ways in
Data Mining: Exploring Data. Lecture Notes for Chapter 3. Introduction to Data Mining
 Data Mining: Exploring Data Lecture Notes for Chapter 3 Introduction to Data Mining by Tan, Steinbach, Kumar Tan,Steinbach, Kumar Introduction to Data Mining 8/05/2005 1 What is data exploration? A preliminary
Visualization Techniques in Data Mining
 Tecniche di Apprendimento Automatico per Applicazioni di Data Mining Visualization Techniques in Data Mining Prof. Pier Luca Lanzi Laurea in Ingegneria Informatica Politecnico di Milano Polo di Milano
Chapter 3 - Multidimensional Information Visualization II
 Chapter 3 - Multidimensional Information Visualization II Concepts for visualizing univariate to hypervariate data Vorlesung Informationsvisualisierung Prof. Dr. Florian Alt, WS 2013/14 Konzept und Folien
Iris Sample Data Set. Basic Visualization Techniques: Charts, Graphs and Maps. Summary Statistics. Frequency and Mode
 Iris Sample Data Set Basic Visualization Techniques: Charts, Graphs and Maps CS598 Information Visualization Spring 2010 Many of the exploratory data techniques are illustrated with the Iris Plant data
COM CO P 5318 Da t Da a t Explora Explor t a ion and Analysis y Chapte Chapt r e 3
 COMP 5318 Data Exploration and Analysis Chapter 3 What is data exploration? A preliminary exploration of the data to better understand its characteristics. Key motivations of data exploration include Helping
What is Visualization? Information Visualization An Overview. Information Visualization. Definitions
 What is Visualization? Information Visualization An Overview Jonathan I. Maletic, Ph.D. Computer Science Kent State University Visualize/Visualization: To form a mental image or vision of [some
CS171 Visualization. The Visualization Alphabet: Marks and Channels. Alexander Lex [email protected]. [xkcd]
![CS171 Visualization. The Visualization Alphabet: Marks and Channels. Alexander Lex alex@seas.harvard.edu. [xkcd]](/thumbs/39/19465011.jpg "CS171 Visualization. The Visualization Alphabet: Marks and Channels. Alexander Lex alex@seas.harvard.edu. [xkcd]") CS171 Visualization Alexander Lex [email protected] The Visualization Alphabet: Marks and Channels [xkcd] This Week Thursday: Task Abstraction, Validation Homework 1 due on Friday! Any more problems
CS171 Visualization Alexander Lex [email protected] The Visualization Alphabet: Marks and Channels [xkcd] This Week Thursday: Task Abstraction, Validation Homework 1 due on Friday! Any more problems
Data Exploration Data Visualization
 Data Exploration Data Visualization What is data exploration? A preliminary exploration of the data to better understand its characteristics. Key motivations of data exploration include Helping to select
Data Mining: Exploring Data. Lecture Notes for Chapter 3. Slides by Tan, Steinbach, Kumar adapted by Michael Hahsler
 Data Mining: Exploring Data Lecture Notes for Chapter 3 Slides by Tan, Steinbach, Kumar adapted by Michael Hahsler Topics Exploratory Data Analysis Summary Statistics Visualization What is data exploration?
Data Mining: Exploring Data. Lecture Notes for Chapter 3. Introduction to Data Mining
 Data Mining: Exploring Data Lecture Notes for Chapter 3 Introduction to Data Mining by Tan, Steinbach, Kumar What is data exploration? A preliminary exploration of the data to better understand its characteristics.
TIES443. Lecture 9: Visualization. Lecture 9. Course webpage: http://www.cs.jyu.fi/~mpechen/ties443. November 17, 2006
 TIES443 Lecture 9 Visualization Mykola Pechenizkiy Course webpage: http://www.cs.jyu.fi/~mpechen/ties443 Department of Mathematical Information Technology University of Jyväskylä November 17, 2006 1 Topics
An example. Visualization? An example. Scientific Visualization. This talk. Information Visualization & Visual Analytics. 30 items, 30 x 3 values
 Information Visualization & Visual Analytics Jack van Wijk Technische Universiteit Eindhoven An example y 30 items, 30 x 3 values I-science for Astronomy, October 13-17, 2008 Lorentz center, Leiden x An
Visualization of Multivariate Data. Dr. Yan Liu Department of Biomedical, Industrial and Human Factors Engineering Wright State University
 Visualization of Multivariate Data Dr. Yan Liu Department of Biomedical, Industrial and Human Factors Engineering Wright State University Introduction Multivariate (Multidimensional) Visualization Visualization
The Value of Visualization 2
 The Value of Visualization 2 G Janacek -0.69 1.11-3.1 4.0 GJJ () Visualization 1 / 21 Parallel coordinates Parallel coordinates is a common way of visualising high-dimensional geometry and analysing multivariate
Principles of Data Visualization for Exploratory Data Analysis. Renee M. P. Teate. SYS 6023 Cognitive Systems Engineering April 28, 2015
 Principles of Data Visualization for Exploratory Data Analysis Renee M. P. Teate SYS 6023 Cognitive Systems Engineering April 28, 2015 Introduction Exploratory Data Analysis (EDA) is the phase of analysis
A Comparative Study of Visualization Techniques for Data Mining
 A Comparative Study of Visualization Techniques for Data Mining A Thesis Submitted To The School of Computer Science and Software Engineering Monash University By Robert Redpath In fulfilment of the requirements
Information visualization examples
 Information visualization examples 350102: GenICT II 37 Information visualization examples 350102: GenICT II 38 Information visualization examples 350102: GenICT II 39 Information visualization examples
Visualization Quick Guide
 Visualization Quick Guide A best practice guide to help you find the right visualization for your data WHAT IS DOMO? Domo is a new form of business intelligence (BI) unlike anything before an executive
Data Visualization. or Graphical Data Presentation. Jerzy Stefanowski Instytut Informatyki
 Data Visualization or Graphical Data Presentation Jerzy Stefanowski Instytut Informatyki Data mining for SE -- 2013 Ack. Inspirations are coming from: G.Piatetsky Schapiro lectures on KDD J.Han on Data
COMP 150-04 Visualization. Lecture 11 Interacting with Visualizations
 COMP 150-04 Visualization Lecture 11 Interacting with Visualizations Assignment 5: Maps Due Wednesday, March 17th Design a thematic map visualization Option 1: Choropleth Map Implementation in Processing
Data Exploration and Preprocessing. Data Mining and Text Mining (UIC 583 @ Politecnico di Milano)
") Data Exploration and Preprocessing Data Mining and Text Mining (UIC 583 @ Politecnico di Milano) References Jiawei Han and Micheline Kamber, "Data Mining: Concepts and Techniques", The Morgan Kaufmann
Data Exploration and Preprocessing Data Mining and Text Mining (UIC 583 @ Politecnico di Milano) References Jiawei Han and Micheline Kamber, "Data Mining: Concepts and Techniques", The Morgan Kaufmann
Graphical Representation of Multivariate Data
 Graphical Representation of Multivariate Data One difficulty with multivariate data is their visualization, in particular when p > 3. At the very least, we can construct pairwise scatter plots of variables.
Data Visualization Handbook
 SAP Lumira Data Visualization Handbook www.saplumira.com 1 Table of Content 3 Introduction 20 Ranking 4 Know Your Purpose 23 Part-to-Whole 5 Know Your Data 25 Distribution 9 Crafting Your Message 29 Correlation
an introduction to VISUALIZING DATA by joel laumans
 an introduction to VISUALIZING DATA by joel laumans an introduction to VISUALIZING DATA iii AN INTRODUCTION TO VISUALIZING DATA by Joel Laumans Table of Contents 1 Introduction 1 Definition Purpose 2 Data
Clustering & Visualization
 Chapter 5 Clustering & Visualization Clustering in high-dimensional databases is an important problem and there are a number of different clustering paradigms which are applicable to high-dimensional data.
Chapter 3 - Multidimensional Information Visualization II
 Chapter 3 - Multidimensional Information Visualization II Concepts for visualizing univariate to hypervariate data Vorlesung Informationsvisualisierung Prof. Dr. Florian Alt, WS 2013/14 Konzept und Folien
CONTENTS PREFACE 1 INTRODUCTION 1 2 DATA VISUALIZATION 19
 PREFACE xi 1 INTRODUCTION 1 1.1 Overview 1 1.2 Definition 1 1.3 Preparation 2 1.3.1 Overview 2 1.3.2 Accessing Tabular Data 3 1.3.3 Accessing Unstructured Data 3 1.3.4 Understanding the Variables and Observations
3D Interactive Information Visualization: Guidelines from experience and analysis of applications
 3D Interactive Information Visualization: Guidelines from experience and analysis of applications Richard Brath Visible Decisions Inc., 200 Front St. W. #2203, Toronto, Canada, [email protected] 1. EXPERT
Time Series Data Visualization
 Time Series Data Visualization Time Series Data Fundamental chronological component to the data set Random sample of 4000 graphics from 15 of world s newspapers and magazines from 74-80 found that 75%
Data Visualization - A Very Rough Guide
 Data Visualization - A Very Rough Guide Ken Brodlie University of Leeds 1 What is This Thing Called Visualization? Visualization Use of computersupported, interactive, visual representations of data to
Choosing a successful structure for your visualization
 IBM Software Business Analytics Visualization Choosing a successful structure for your visualization By Noah Iliinsky, IBM Visualization Expert 2 Choosing a successful structure for your visualization
Scatterplot Layout for High-dimensional Data Visualization
 Noname manuscript No. (will be inserted by the editor) Scatterplot Layout for High-dimensional Data Visualization Yunzhu Zheng Haruka Suematsu Takayuki Itoh Ryohei Fujimaki Satoshi Morinaga Yoshinobu Kawahara
Tutorial 3: Graphics and Exploratory Data Analysis in R Jason Pienaar and Tom Miller
 Tutorial 3: Graphics and Exploratory Data Analysis in R Jason Pienaar and Tom Miller Getting to know the data An important first step before performing any kind of statistical analysis is to familiarize
Hierarchical Data Visualization
 Hierarchical Data Visualization 1 Hierarchical Data Hierarchical data emphasize the subordinate or membership relations between data items. Organizational Chart Classifications / Taxonomies (Species and
Lecture 2: Descriptive Statistics and Exploratory Data Analysis
 Lecture 2: Descriptive Statistics and Exploratory Data Analysis Further Thoughts on Experimental Design 16 Individuals (8 each from two populations) with replicates Pop 1 Pop 2 Randomly sample 4 individuals
Visualization methods for patent data
 Visualization methods for patent data Treparel 2013 Dr. Anton Heijs (CTO & Founder) Delft, The Netherlands Introduction Treparel can provide advanced visualizations for patent data. This document describes
Visualizing High-density Clusters in Multidimensional Data
 Visualizing High-density Clusters in Multidimensional Data Tran Van Long A thesis submitted in partial fulfilment of the requirements for the degree of Doctor of Philosophy in Computer Science Approved,
Week 1. Exploratory Data Analysis
 Week 1 Exploratory Data Analysis Practicalities This course ST903 has students from both the MSc in Financial Mathematics and the MSc in Statistics. Two lectures and one seminar/tutorial per week. Exam
Exploratory Data Analysis with MATLAB
 Computer Science and Data Analysis Series Exploratory Data Analysis with MATLAB Second Edition Wendy L Martinez Angel R. Martinez Jeffrey L. Solka ( r ec) CRC Press VV J Taylor & Francis Group Boca Raton
Visual Data Mining with Pixel-oriented Visualization Techniques
 Visual Data Mining with Pixel-oriented Visualization Techniques Mihael Ankerst The Boeing Company P.O. Box 3707 MC 7L-70, Seattle, WA 98124 [email protected] Abstract Pixel-oriented visualization
Recognition. Sanja Fidler CSC420: Intro to Image Understanding 1 / 28
 Recognition Topics that we will try to cover: Indexing for fast retrieval (we still owe this one) History of recognition techniques Object classification Bag-of-words Spatial pyramids Neural Networks Object
9. Text & Documents. Visualizing and Searching Documents. Dr. Thorsten Büring, 20. Dezember 2007, Vorlesung Wintersemester 2007/08
 9. Text & Documents Visualizing and Searching Documents Dr. Thorsten Büring, 20. Dezember 2007, Vorlesung Wintersemester 2007/08 Slide 1 / 37 Outline Characteristics of text data Detecting patterns SeeSoft
Exploratory Spatial Data Analysis
 Exploratory Spatial Data Analysis Part II Dynamically Linked Views 1 Contents Introduction: why to use non-cartographic data displays Display linking by object highlighting Dynamic Query Object classification
Visualization Software
 Visualization Software Maneesh Agrawala CS 294-10: Visualization Fall 2007 Assignment 1b: Deconstruction & Redesign Due before class on Sep 12, 2007 1 Assignment 2: Creating Visualizations Use existing
Data Visualization Principles: Interaction, Filtering, Aggregation
 Data Visualization Principles: Interaction, Filtering, Aggregation CSC444 Acknowledgments for today s lecture: What if there s too much data? Sometimes you can t present all the data in a single plot (Your
TIBCO Spotfire Business Author Essentials Quick Reference Guide. Table of contents:
 Table of contents: Access Data for Analysis Data file types Format assumptions Data from Excel Information links Add multiple data tables Create & Interpret Visualizations Table Pie Chart Cross Table Treemap
Microsoft Business Intelligence Visualization Comparisons by Tool
 Microsoft Business Intelligence Visualization Comparisons by Tool Version 3: 10/29/2012 Purpose: Purpose of this document is to provide a quick reference of visualization options available in each tool.
The course: An Introduction to Information Visualization Techniques for Exploring Large Database
 The course: An Introduction to Information Visualization Techniques for Exploring Large Database Jing Yang Fall 2006 www.cs.uncc.edu/~jyang13 1 Multi-dimensional Data Visualization 2 1 Parallel Coordinates
Big Data in Pictures: Data Visualization
 Big Data in Pictures: Data Visualization Huamin Qu Hong Kong University of Science and Technology What is data visualization? Data visualization is the creation and study of the visual representation of
MTH 140 Statistics Videos
 MTH 140 Statistics Videos Chapter 1 Picturing Distributions with Graphs Individuals and Variables Categorical Variables: Pie Charts and Bar Graphs Categorical Variables: Pie Charts and Bar Graphs Quantitative
Variable: characteristic that varies from one individual to another in the population
 Goals: Recognize variables as: Qualitative or Quantitative Discrete Continuous Study Ch. 2.1, # 1 13 : Prof. G. Battaly, Westchester Community College, NY Study Ch. 2.1, # 1 13 Variable: characteristic
MetroBoston DataCommon Training
 MetroBoston DataCommon Training Whether you are a data novice or an expert researcher, the MetroBoston DataCommon can help you get the information you need to learn more about your community, understand
Data Visualization Techniques
 Data Visualization Techniques From Basics to Big Data with SAS Visual Analytics WHITE PAPER SAS White Paper Table of Contents Introduction.... 1 Generating the Best Visualizations for Your Data... 2 The
By LaBRI INRIA Information Visualization Team
 By LaBRI INRIA Information Visualization Team Tulip 2011 version 3.5.0 Tulip is an information visualization framework dedicated to the analysis and visualization of data. Tulip aims to provide the developer
Visualizing Data. Contents. 1 Visualizing Data. Anthony Tanbakuchi Department of Mathematics Pima Community College. Introductory Statistics Lectures
 Introductory Statistics Lectures Visualizing Data Descriptive Statistics I Department of Mathematics Pima Community College Redistribution of this material is prohibited without written permission of the
A Survey on Multivariate Data Visualization
 A Survey on Multivariate Data Visualization Winnie Wing-Yi Chan Department of Computer Science and Engineering Hong Kong University of Science and Technology Clear Water Bay, Kowloon, Hong Kong June 2006
Information Visualization
 Information Visualization Chris North Center for Human-Computer Interaction, Department of Computer Science Virginia Polytechnic Institute and State University Blacksburg, VA 24061 USA Table of Contents:
Lecture 2. Summarizing the Sample
 Lecture 2 Summarizing the Sample WARNING: Today s lecture may bore some of you It s (sort of) not my fault I m required to teach you about what we re going to cover today. I ll try to make it as exciting
?????? Data Analytics
 ?????? Data Analytics Prof. Dr.-Ing. Lars Linsen Prof. Dr. Adalbert FX Wilhelm Fall 2015 0. Organizational Stuff 0.1 Syllabus and Organization Data Analytics 3 Course website http://www.faculty.jacobsuniversity.de/llinsen/teaching/??????.htm
Visual Data Mining. Motivation. Why Visual Data Mining. Integration of visualization and data mining : Chidroop Madhavarapu CSE 591:Visual Analytics
 Motivation Visual Data Mining Visualization for Data Mining Huge amounts of information Limited display capacity of output devices Chidroop Madhavarapu CSE 591:Visual Analytics Visual Data Mining (VDM)
Visualizations. Cyclical data. Comparison. What would you like to show? Composition. Simple share of total. Relative and absolute differences matter
 Visualizations Variable width chart Table or tables with embedded charts Bar chart horizontal Circular area chart per item Many categories Cyclical data Non-cyclical data Single or few categories Many
Introduction to Multivariate Analysis
 Introduction to Multivariate Analysis Lecture 1 August 24, 2005 Multivariate Analysis Lecture #1-8/24/2005 Slide 1 of 30 Today s Lecture Today s Lecture Syllabus and course overview Chapter 1 (a brief
Visibility optimization for data visualization: A Survey of Issues and Techniques
 Visibility optimization for data visualization: A Survey of Issues and Techniques Ch Harika, Dr.Supreethi K.P Student, M.Tech, Assistant Professor College of Engineering, Jawaharlal Nehru Technological
Hierarchy and Tree Visualization
 Hierarchy and Tree Visualization Definition Hierarchies An ordering of groups in which larger groups encompass sets of smaller groups. Data repository in which cases are related to subcases Hierarchical
Data Visualization in R
 Data Visualization in R L. Torgo [email protected] Faculdade de Ciências / LIAAD-INESC TEC, LA Universidade do Porto Oct, 2014 Introduction Motivation for Data Visualization Humans are outstanding at detecting
Raising the Bar (Chart)
") Raising the Bar (Chart) THE NEXT GENERATION OF VISUALIZATION TOOLS Jeffrey Heer @jeffrey_heer Univ. of Washington + Trifacta ? Visualizing Big Data! Stratified Sampling Binned Aggregation immens: Real-Time
Raising the Bar (Chart) THE NEXT GENERATION OF VISUALIZATION TOOLS Jeffrey Heer @jeffrey_heer Univ. of Washington + Trifacta ? Visualizing Big Data! Stratified Sampling Binned Aggregation immens: Real-Time
Exercise 1.12 (Pg. 22-23)
") Individuals: The objects that are described by a set of data. They may be people, animals, things, etc. (Also referred to as Cases or Records) Variables: The characteristics recorded about each individual.
Individuals: The objects that are described by a set of data. They may be people, animals, things, etc. (Also referred to as Cases or Records) Variables: The characteristics recorded about each individual.
High-Dimensional Visualizations
 High-Dimensional Visualizations Georges Grinstein 1, 2, Marjan Trutschl 1, Urška Cvek 1 1 Institute for Visualization and Perception Research University of Massachusetts Lowell and 2 AnVil Informatics,
WebFOCUS RStat. RStat. Predict the Future and Make Effective Decisions Today. WebFOCUS RStat
 Information Builders enables agile information solutions with business intelligence (BI) and integration technologies. WebFOCUS the most widely utilized business intelligence platform connects to any enterprise
Business Intelligence and Process Modelling
 Business Intelligence and Process Modelling F.W. Takes Universiteit Leiden Lecture 2: Business Intelligence & Visual Analytics BIPM Lecture 2: Business Intelligence & Visual Analytics 1 / 72 Business Intelligence
Human-Computer Interaction
 Human-Computer Interaction an introduction to data visualization Above all else show the data. Edward R. Tufte reality Data is no longer scarce reality Data is no longer scarce http://www.worldometers.info/
High Dimensional Data Visualization
 High Dimensional Data Visualization Sándor Kromesch, Sándor Juhász Department of Automation and Applied Informatics, Budapest University of Technology and Economics, Budapest, Hungary Tel.: +36-1-463-3969;
Independence Diagrams: A Technique for Visual Data Mining
 From: KDD-98 Proceedings. Copyright 1998, AAAI (www.aaai.org). All rights reserved. Independence Diagrams: A Technique for Visual Data Mining Stefan Berchtold H. V. Jagadish AT&T Laboratories AT&T Laboratories
Summarizing and Displaying Categorical Data
 Summarizing and Displaying Categorical Data Categorical data can be summarized in a frequency distribution which counts the number of cases, or frequency, that fall into each category, or a relative frequency
1. Then f has a relative maximum at x = c if f(c) f(x) for all values of x in some
 f(x) for all values of x in some") Section 3.1: First Derivative Test Definition. Let f be a function with domain D. 1. Then f has a relative maximum at x = c if f(c) f(x) for all values of x in some open interval containing c. The number
Section 3.1: First Derivative Test Definition. Let f be a function with domain D. 1. Then f has a relative maximum at x = c if f(c) f(x) for all values of x in some open interval containing c. The number
Data Visualization Techniques
 Data Visualization Techniques From Basics to Big Data with SAS Visual Analytics WHITE PAPER SAS White Paper Table of Contents Introduction.... 1 Generating the Best Visualizations for Your Data... 2 The
Visualization and Visual Analytics
 Scientific Visualization and Computer Graphics University of Groningen Visualization and Visual Analytics Jos Roerdink Johann Bernoulli Institute for Mathematics and Computer Science University of Groningen
TEXT-FILLED STACKED AREA GRAPHS Martin Kraus
 Martin Kraus Text can add a significant amount of detail and value to an information visualization. In particular, it can integrate more of the data that a visualization is based on, and it can also integrate
Data Preprocessing. Week 2
 Data Preprocessing Week 2 Topics Data Types Data Repositories Data Preprocessing Present homework assignment #1 Team Homework Assignment #2 Read pp. 227 240, pp. 250 250, and pp. 259 263 the text book.
Statistics Chapter 2
 Statistics Chapter 2 Frequency Tables A frequency table organizes quantitative data. partitions data into classes (intervals). shows how many data values are in each class. Test Score Number of Students
Microsoft Excel 2010 Pivot Tables
 Microsoft Excel 2010 Pivot Tables Email: [email protected] Web Page: http://training.health.ufl.edu Microsoft Excel 2010: Pivot Tables 1.5 hours Topics include data groupings, pivot tables, pivot
Analyzing The Role Of Dimension Arrangement For Data Visualization in Radviz
 Analyzing The Role Of Dimension Arrangement For Data Visualization in Radviz Luigi Di Caro 1, Vanessa Frias-Martinez 2, and Enrique Frias-Martinez 2 1 Department of Computer Science, Universita di Torino,
Visual Mining of E-Customer Behavior Using Pixel Bar Charts
 Visual Mining of E-Customer Behavior Using Pixel Bar Charts Ming C. Hao, Julian Ladisch*, Umeshwar Dayal, Meichun Hsu, Adrian Krug Hewlett Packard Research Laboratories, Palo Alto, CA. (ming_hao, dayal)@hpl.hp.com;
Graph/Network Visualization
 Graph/Network Visualization Data model: graph structures (relations, knowledge) and networks. Applications: Telecommunication systems, Internet and WWW, Retailers distribution networks knowledge representation
Criteria for Evaluating Visual EDA Tools
 Criteria for Evaluating Visual EDA Tools Stephen Few, Perceptual Edge Visual Business Intelligence Newsletter April/May/June 2012 We visualize data for various purposes. Specific purposes direct us to