Graphical Representation of Multivariate Data
|
|
|
- Maryann O’Connor’
- 7 years ago
- Views:
Transcription
1 Graphical Representation of Multivariate Data One difficulty with multivariate data is their visualization, in particular when p > 3. At the very least, we can construct pairwise scatter plots of variables. Data from exercise 1.1 (transpose of Figure 1.1) 90

2 Graphs and Visualization (cont d) Graphs convey information about associations between variables and also about unusual observations. Example 1.3: correlation between number of employees and productivity at 16 publishing firms is for all firms and if Dun & Bradstreet is not included. 91

3 Multiple Scatter Plots Example 1.5: Paper quality data: X 1 =density(g/cc), X 2 =strength(pounds) in machine direction, X 3 =strength (pounds) in the cross direction displayed in R via the pairs() function 92

4 Three-dimensional Plots (Example 1.6: Lizard mass (g), snout-vent length (mm), hind limb span (mm)) 93
,")
5 Three-dim Plot: after standardizing 94

6 Four-dimensional Plots? fourth dimension is plotting character (denotes gender) 95

7 Other Graphical Methods Specialized software to visualize data in high dimensions is now available. One example is GGobi, downloadable free of charge from the ISU Statistics Department web site. Typically, these programs provide dynamic two-dimensional projections of high dimensional data that reveal Associations among variables Groupings of the units in the sample Other data attributes. Graphical methods to display data are very context-dependent 96

8 Other Graphical Methods Growth curves: appropriate when multivariate observations consist of repeated measurements on a set of units. Ex. 1.10: weight and length of female bears over three years. 97

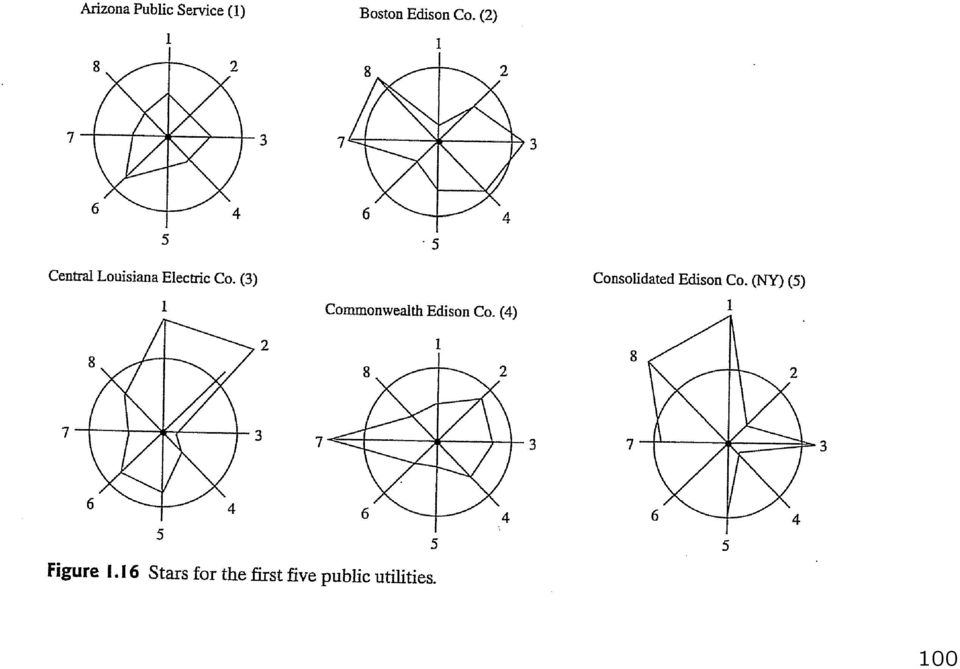
9 Even More Graphical Methods Stars: Suitable for non-negative measurements (standardize the data for each variable and let the center of the circle correspond to the minimum values). Circle of fixed radius with p equally spaced rays (one ray for each variable). Value of each variable is represented by the length of a ray (distance from minimum value for all sample units). Construct one circle for each unit in the sample Group units with similar patterns 98
.")
10 Example 1.11: 22 Public Utility Companies X 1 : Fixed-charge coverage X 2 : Rate of return on capital X 3 : Cost per kw capacity X 4 : Annual load factor X 5 : Peak kw hours demand X 6 : Annual sales (kw hours) X 7 : Percent nuclear X 8 : Fuel costs (cents per kwh) The variables are standardized Each variable receives equal weight in the visual impression Focus on variables X 6 and X 8 in the next display 99
 The variables are standardized Each variable")
11 100
12 Even More Graphical Methods Chernoff faces: Same idea as stars, but now each facial characteristic (nose, mouth, etc.) represents a variable. Some facial features can have greater impact than others on how the faces are compared. Group units with similar faces 101

13 Example 1.12: 22 Public Utility Companies X 1 : Fixed-charge coverage Half-height of face X 2 : Rate of return on capital Face width X 3 : Cost per kw capacity Position of mouth X 4 : Annual load factor Slant of eyes X 5 : Peak kw hours demand Eccentricity (ht/w) of eyes X 6 : Sales (kw hours per year) Half length of eye X 7 : Percent nuclear Curvature of mouth X 8 : Fuel costs (cents per kwh) Length of nose 102
 of eyes X 6 : Sales (kw hours per year) Half length of")
14 103

15 Additional Techniques for Visualizing High-Dimensional Datasets Data in more than two dimensions are quite problematic to represent However, there are quite a few suggestions in the area of information visualization in computer science Here, we study some static display options beyond the ones studied so far 104

16 Survey Plots A simple technique of extending a point in a line graph (like a bar graph) down to an axis has been used in many systems. A simple variation of this extends a line from a center point, where the line length corresponds to the dimensional value. This particular visualization of n-dimensional data allows one to see correlations between any two variables especially when the data are sorted according to a particular dimension. Using color for different classifications may help (after sorting perhaps) determine best coordinates for classifying data. 105

17 Survey Plot of Iris Data Survey Plot for Sepal.Length Sepal.Width Petal.Length Features Petal.Width 106

18 Parallel Coordinates Plots Parallel coordinates plots represent multidimensional data using lines. A vertical line represents each dimension or attribute. The maximum and minimum values of that dimension are usually scaled to the upper and lower points on these vertical lines. n 1 lines connected to each vertical line at the appropriate dimensional value represent an n-dimensional point. 107

19 Parallel Coordinates Plots Iris Data Parallel Coordinate Plot for Sepal.Length Sepal.Width Original Attribute Order Petal.Length Petal.Width 108

20 Andrews curves Andrews curves plot each n-dimensional point x = (x 1, x 2,..., x p ) as a curved line using the function f(t) = x 1 + x 2 sin t + x 3 cos t + x 4 sin 2t + x 5 cos 2t The function is usually plotted in the interval π < t < π. This is similar to a Fourier transform of a data point. Advantage: can represent many dimensions. Disadvantage: computational time to display each n-dimensional point for large datasets. Also, order matters. 109

21 Andrews Curves Iris Data
22 Radviz or Radial Visualization Plots The idea behind radial visualization plots or Radviz is that spring constants can be used to represent relational values between points. Like parallel coordinates this is also a lossless visualization method Here p-dimensional data points are laid out as points equally spaced around the perimeter of a circle. 111
23 The ends of each of p springs are attached to these p perimeter points. The other ends of the springs are attached to a data point. The spring constant Ki equals the values of the ith coordinate of the fixed point. Each data point is then displayed where the sum of the spring forces equals 0. All the data point values are usually normalized to have values between 0 and 1. For example if all p coordinates have the same value, the data point will lie exactly in the center of the circle.
24 If the point is a unit vector, then that point will lie exactly at the fixed point on the edge of the circle (where the spring for that dimension is fixed). Many points can map to the same position. This represents a non-linear transformation of the data, which preserves certain symmetries and which produces an intuitive display. Some features of this visualization are: Points with approximately equal coordinate values will lie close to the center Points with similar values whose dimensions are opposite each other on the circle will lie near the center
25 Points which have one or two coordinate values greater than the others lie closer to those dimensions A p-dimensional line will map to a line A sphere will map to an ellipse A p-dimensional plane maps to a bounded polygon Can not really handle severely high-dimensional datasets
26 Radial Visualization Plot Iris Data Sepal.Length Sepal.Width Petal.Length Petal.Width setosa versicolor virginica 2D Radviz for 112
Iris Sample Data Set. Basic Visualization Techniques: Charts, Graphs and Maps. Summary Statistics. Frequency and Mode
 Iris Sample Data Set Basic Visualization Techniques: Charts, Graphs and Maps CS598 Information Visualization Spring 2010 Many of the exploratory data techniques are illustrated with the Iris Plant data
Data Exploration Data Visualization
 Data Exploration Data Visualization What is data exploration? A preliminary exploration of the data to better understand its characteristics. Key motivations of data exploration include Helping to select
Data Mining: Exploring Data. Lecture Notes for Chapter 3. Introduction to Data Mining
 Data Mining: Exploring Data Lecture Notes for Chapter 3 Introduction to Data Mining by Tan, Steinbach, Kumar What is data exploration? A preliminary exploration of the data to better understand its characteristics.
Data Mining: Exploring Data. Lecture Notes for Chapter 3. Slides by Tan, Steinbach, Kumar adapted by Michael Hahsler
 Data Mining: Exploring Data Lecture Notes for Chapter 3 Slides by Tan, Steinbach, Kumar adapted by Michael Hahsler Topics Exploratory Data Analysis Summary Statistics Visualization What is data exploration?
Data Mining: Exploring Data. Lecture Notes for Chapter 3. Introduction to Data Mining
 Data Mining: Exploring Data Lecture Notes for Chapter 3 Introduction to Data Mining by Tan, Steinbach, Kumar Tan,Steinbach, Kumar Introduction to Data Mining 8/05/2005 1 What is data exploration? A preliminary
Getting Started with R and RStudio 1
 Getting Started with R and RStudio 1 1 What is R? R is a system for statistical computation and graphics. It is the statistical system that is used in Mathematics 241, Engineering Statistics, for the following
The Value of Visualization 2
 The Value of Visualization 2 G Janacek -0.69 1.11-3.1 4.0 GJJ () Visualization 1 / 21 Parallel coordinates Parallel coordinates is a common way of visualising high-dimensional geometry and analysing multivariate
Advanced Statistical Methods in Insurance
 Advanced Statistical Methods in Insurance 7. Multivariate Data All Pairwise Scattergrams Iris Data Set: 3 Species 50 Cases of each with p=4 measurements per case 2 Hudec & Schlögl 1 3-d Scatterplots iris[,
Information Visualization Multivariate Data Visualization Krešimir Matković
 Information Visualization Multivariate Data Visualization Krešimir Matković Vienna University of Technology, VRVis Research Center, Vienna Multivariable >3D Data Tables have so many variables that orthogonal
COM CO P 5318 Da t Da a t Explora Explor t a ion and Analysis y Chapte Chapt r e 3
 COMP 5318 Data Exploration and Analysis Chapter 3 What is data exploration? A preliminary exploration of the data to better understand its characteristics. Key motivations of data exploration include Helping
Data Exploration and Preprocessing. Data Mining and Text Mining (UIC 583 @ Politecnico di Milano)
") Data Exploration and Preprocessing Data Mining and Text Mining (UIC 583 @ Politecnico di Milano) References Jiawei Han and Micheline Kamber, "Data Mining: Concepts and Techniques", The Morgan Kaufmann
Data Exploration and Preprocessing Data Mining and Text Mining (UIC 583 @ Politecnico di Milano) References Jiawei Han and Micheline Kamber, "Data Mining: Concepts and Techniques", The Morgan Kaufmann
EVERY DAY COUNTS CALENDAR MATH 2005 correlated to
 EVERY DAY COUNTS CALENDAR MATH 2005 correlated to Illinois Mathematics Assessment Framework Grades 3-5 E D U C A T I O N G R O U P A Houghton Mifflin Company YOUR ILLINOIS GREAT SOURCE REPRESENTATIVES:
x 2 + y 2 = 1 y 1 = x 2 + 2x y = x 2 + 2x + 1
 Implicit Functions Defining Implicit Functions Up until now in this course, we have only talked about functions, which assign to every real number x in their domain exactly one real number f(x). The graphs
Algebra 2 Chapter 1 Vocabulary. identity - A statement that equates two equivalent expressions.
 Chapter 1 Vocabulary identity - A statement that equates two equivalent expressions. verbal model- A word equation that represents a real-life problem. algebraic expression - An expression with variables.
Section 1.1. Introduction to R n
 The Calculus of Functions of Several Variables Section. Introduction to R n Calculus is the study of functional relationships and how related quantities change with each other. In your first exposure to
11.1. Objectives. Component Form of a Vector. Component Form of a Vector. Component Form of a Vector. Vectors and the Geometry of Space
 11 Vectors and the Geometry of Space 11.1 Vectors in the Plane Copyright Cengage Learning. All rights reserved. Copyright Cengage Learning. All rights reserved. 2 Objectives! Write the component form of
High Dimensional Data Visualization
 High Dimensional Data Visualization Sándor Kromesch, Sándor Juhász Department of Automation and Applied Informatics, Budapest University of Technology and Economics, Budapest, Hungary Tel.: +36-1-463-3969;
Analyzing The Role Of Dimension Arrangement For Data Visualization in Radviz
 Analyzing The Role Of Dimension Arrangement For Data Visualization in Radviz Luigi Di Caro 1, Vanessa Frias-Martinez 2, and Enrique Frias-Martinez 2 1 Department of Computer Science, Universita di Torino,
1051-232 Imaging Systems Laboratory II. Laboratory 4: Basic Lens Design in OSLO April 2 & 4, 2002
 05-232 Imaging Systems Laboratory II Laboratory 4: Basic Lens Design in OSLO April 2 & 4, 2002 Abstract: For designing the optics of an imaging system, one of the main types of tools used today is optical
2D, 3D and High-Dimensional Data and Information Visualization
 University of Hannover Institut für Wirtschaftsinformatik (IWI) 2D, 3D and High-Dimensional Data and Information Visualization Kim Bartke Email: kimbartke@yahoo.co.uk Tutor: Prof. Michael H. Breitner Seminar
Diagrams and Graphs of Statistical Data
 Diagrams and Graphs of Statistical Data One of the most effective and interesting alternative way in which a statistical data may be presented is through diagrams and graphs. There are several ways in
Fourth Grade Math Standards and "I Can Statements"
 Fourth Grade Math Standards and "I Can Statements" Standard - CC.4.OA.1 Interpret a multiplication equation as a comparison, e.g., interpret 35 = 5 x 7 as a statement that 35 is 5 times as many as 7 and
Self-Portrait Steps Images taken from Andrew Loomis Drawing Head & Hands (there are many sites to download this out of print book for free)
") Self-Portrait Steps Images taken from Andrew Loomis Drawing Head & Hands (there are many sites to download this out of print book for free) First of all- put the idea of it doesn t look like me! out of
Self-Portrait Steps Images taken from Andrew Loomis Drawing Head & Hands (there are many sites to download this out of print book for free) First of all- put the idea of it doesn t look like me! out of
Reflection and Refraction
 Equipment Reflection and Refraction Acrylic block set, plane-concave-convex universal mirror, cork board, cork board stand, pins, flashlight, protractor, ruler, mirror worksheet, rectangular block worksheet,
Algebra 1 2008. Academic Content Standards Grade Eight and Grade Nine Ohio. Grade Eight. Number, Number Sense and Operations Standard
 Academic Content Standards Grade Eight and Grade Nine Ohio Algebra 1 2008 Grade Eight STANDARDS Number, Number Sense and Operations Standard Number and Number Systems 1. Use scientific notation to express
Everyday Mathematics GOALS
 Copyright Wright Group/McGraw-Hill GOALS The following tables list the Grade-Level Goals organized by Content Strand and Program Goal. Content Strand: NUMBER AND NUMERATION Program Goal: Understand the
Everyday Mathematics CCSS EDITION CCSS EDITION. Content Strand: Number and Numeration
 CCSS EDITION Overview of -6 Grade-Level Goals CCSS EDITION Content Strand: Number and Numeration Program Goal: Understand the Meanings, Uses, and Representations of Numbers Content Thread: Rote Counting
Pre-Algebra 2008. Academic Content Standards Grade Eight Ohio. Number, Number Sense and Operations Standard. Number and Number Systems
 Academic Content Standards Grade Eight Ohio Pre-Algebra 2008 STANDARDS Number, Number Sense and Operations Standard Number and Number Systems 1. Use scientific notation to express large numbers and small
ISAT Mathematics Performance Definitions Grade 4
 ISAT Mathematics Performance Definitions Grade 4 EXCEEDS STANDARDS Fourth-grade students whose measured performance exceeds standards are able to identify, read, write, represent, and model whole numbers
Current Standard: Mathematical Concepts and Applications Shape, Space, and Measurement- Primary
 Shape, Space, and Measurement- Primary A student shall apply concepts of shape, space, and measurement to solve problems involving two- and three-dimensional shapes by demonstrating an understanding of:
ME 111: Engineering Drawing
 ME 111: Engineering Drawing Lecture 4 08-08-2011 Engineering Curves and Theory of Projection Indian Institute of Technology Guwahati Guwahati 781039 Eccentrici ty = Distance of the point from the focus
Everyday Mathematics. Grade 4 Grade-Level Goals. 3rd Edition. Content Strand: Number and Numeration. Program Goal Content Thread Grade-Level Goals
 Content Strand: Number and Numeration Understand the Meanings, Uses, and Representations of Numbers Understand Equivalent Names for Numbers Understand Common Numerical Relations Place value and notation
Angle - a figure formed by two rays or two line segments with a common endpoint called the vertex of the angle; angles are measured in degrees
 Angle - a figure formed by two rays or two line segments with a common endpoint called the vertex of the angle; angles are measured in degrees Apex in a pyramid or cone, the vertex opposite the base; in
Visualization of Multivariate Data. Dr. Yan Liu Department of Biomedical, Industrial and Human Factors Engineering Wright State University
 Visualization of Multivariate Data Dr. Yan Liu Department of Biomedical, Industrial and Human Factors Engineering Wright State University Introduction Multivariate (Multidimensional) Visualization Visualization
A Comparative Study of Visualization Techniques for Data Mining
 A Comparative Study of Visualization Techniques for Data Mining A Thesis Submitted To The School of Computer Science and Software Engineering Monash University By Robert Redpath In fulfilment of the requirements
Figure 1.1 Vector A and Vector F
 CHAPTER I VECTOR QUANTITIES Quantities are anything which can be measured, and stated with number. Quantities in physics are divided into two types; scalar and vector quantities. Scalar quantities have
Scope and Sequence KA KB 1A 1B 2A 2B 3A 3B 4A 4B 5A 5B 6A 6B
 Scope and Sequence Earlybird Kindergarten, Standards Edition Primary Mathematics, Standards Edition Copyright 2008 [SingaporeMath.com Inc.] The check mark indicates where the topic is first introduced
Such As Statements, Kindergarten Grade 8
 Such As Statements, Kindergarten Grade 8 This document contains the such as statements that were included in the review committees final recommendations for revisions to the mathematics Texas Essential
Multi-Dimensional Data Visualization. Slides courtesy of Chris North
 Multi-Dimensional Data Visualization Slides courtesy of Chris North What is the Cleveland s ranking for quantitative data among the visual variables: Angle, area, length, position, color Where are we?!
Volumes of Revolution
 Mathematics Volumes of Revolution About this Lesson This lesson provides students with a physical method to visualize -dimensional solids and a specific procedure to sketch a solid of revolution. Students
15.062 Data Mining: Algorithms and Applications Matrix Math Review
 .6 Data Mining: Algorithms and Applications Matrix Math Review The purpose of this document is to give a brief review of selected linear algebra concepts that will be useful for the course and to develop
How To Understand General Relativity
 Chapter S3 Spacetime and Gravity What are the major ideas of special relativity? Spacetime Special relativity showed that space and time are not absolute Instead they are inextricably linked in a four-dimensional
COMMON CORE STATE STANDARDS FOR MATHEMATICS 3-5 DOMAIN PROGRESSIONS
 COMMON CORE STATE STANDARDS FOR MATHEMATICS 3-5 DOMAIN PROGRESSIONS Compiled by Dewey Gottlieb, Hawaii Department of Education June 2010 Operations and Algebraic Thinking Represent and solve problems involving
MATHS LEVEL DESCRIPTORS
 MATHS LEVEL DESCRIPTORS Number Level 3 Understand the place value of numbers up to thousands. Order numbers up to 9999. Round numbers to the nearest 10 or 100. Understand the number line below zero, and
Structural Axial, Shear and Bending Moments
 Structural Axial, Shear and Bending Moments Positive Internal Forces Acting Recall from mechanics of materials that the internal forces P (generic axial), V (shear) and M (moment) represent resultants
The Benefits of Statistical Visualization in an Immersive Environment
 The Benefits of Statistical Visualization in an Immersive Environment Laura Arns 1, Dianne Cook 2, Carolina Cruz-Neira 1 1 Iowa Center for Emerging Manufacturing Technology Iowa State University, Ames
Data Mining with R. Decision Trees and Random Forests. Hugh Murrell
 Data Mining with R Decision Trees and Random Forests Hugh Murrell reference books These slides are based on a book by Graham Williams: Data Mining with Rattle and R, The Art of Excavating Data for Knowledge
Mathematics Scope and Sequence, K-8
 Standard 1: Number and Operation Goal 1.1: Understands and uses numbers (number sense) Mathematics Scope and Sequence, K-8 Grade Counting Read, Write, Order, Compare Place Value Money Number Theory K Count
Everyday Mathematics. Grade 4 Grade-Level Goals CCSS EDITION. Content Strand: Number and Numeration. Program Goal Content Thread Grade-Level Goal
 Content Strand: Number and Numeration Understand the Meanings, Uses, and Representations of Numbers Understand Equivalent Names for Numbers Understand Common Numerical Relations Place value and notation
Visualizing Data. Contents. 1 Visualizing Data. Anthony Tanbakuchi Department of Mathematics Pima Community College. Introductory Statistics Lectures
 Introductory Statistics Lectures Visualizing Data Descriptive Statistics I Department of Mathematics Pima Community College Redistribution of this material is prohibited without written permission of the
Biggar High School Mathematics Department. National 5 Learning Intentions & Success Criteria: Assessing My Progress
 Biggar High School Mathematics Department National 5 Learning Intentions & Success Criteria: Assessing My Progress Expressions & Formulae Topic Learning Intention Success Criteria I understand this Approximation
Scatter Plots with Error Bars
 Chapter 165 Scatter Plots with Error Bars Introduction The procedure extends the capability of the basic scatter plot by allowing you to plot the variability in Y and X corresponding to each point. Each
Charlesworth School Year Group Maths Targets
 Charlesworth School Year Group Maths Targets Year One Maths Target Sheet Key Statement KS1 Maths Targets (Expected) These skills must be secure to move beyond expected. I can compare, describe and solve
BPS Math Year at a Glance (Adapted from A Story Of Units Curriculum Maps in Mathematics K-5) 1
 1") Grade 4 Key Areas of Focus for Grades 3-5: Multiplication and division of whole numbers and fractions-concepts, skills and problem solving Expected Fluency: Add and subtract within 1,000,000 Module M1:
Grade 4 Key Areas of Focus for Grades 3-5: Multiplication and division of whole numbers and fractions-concepts, skills and problem solving Expected Fluency: Add and subtract within 1,000,000 Module M1:
Prentice Hall Mathematics Courses 1-3 Common Core Edition 2013
 A Correlation of Prentice Hall Mathematics Courses 1-3 Common Core Edition 2013 to the Topics & Lessons of Pearson A Correlation of Courses 1, 2 and 3, Common Core Introduction This document demonstrates
Number Sense and Operations
 Number Sense and Operations representing as they: 6.N.1 6.N.2 6.N.3 6.N.4 6.N.5 6.N.6 6.N.7 6.N.8 6.N.9 6.N.10 6.N.11 6.N.12 6.N.13. 6.N.14 6.N.15 Demonstrate an understanding of positive integer exponents
New York State Student Learning Objective: Regents Geometry
 New York State Student Learning Objective: Regents Geometry All SLOs MUST include the following basic components: Population These are the students assigned to the course section(s) in this SLO all students
Methodology for Emulating Self Organizing Maps for Visualization of Large Datasets
 Methodology for Emulating Self Organizing Maps for Visualization of Large Datasets Macario O. Cordel II and Arnulfo P. Azcarraga College of Computer Studies *Corresponding Author: macario.cordel@dlsu.edu.ph
Voyager Sopris Learning Vmath, Levels C-I, correlated to the South Carolina College- and Career-Ready Standards for Mathematics, Grades 2-8
 Page 1 of 35 VMath, Level C Grade 2 Mathematical Process Standards 1. Make sense of problems and persevere in solving them. Module 3: Lesson 4: 156-159 Module 4: Lesson 7: 220-223 2. Reason both contextually
Classification of Fingerprints. Sarat C. Dass Department of Statistics & Probability
 Classification of Fingerprints Sarat C. Dass Department of Statistics & Probability Fingerprint Classification Fingerprint classification is a coarse level partitioning of a fingerprint database into smaller
Illinois State Standards Alignments Grades Three through Eleven
 Illinois State Standards Alignments Grades Three through Eleven Trademark of Renaissance Learning, Inc., and its subsidiaries, registered, common law, or pending registration in the United States and other
SURFACE AREA AND VOLUME
 SURFACE AREA AND VOLUME In this unit, we will learn to find the surface area and volume of the following threedimensional solids:. Prisms. Pyramids 3. Cylinders 4. Cones It is assumed that the reader has
Table of Contents Find the story within your data
 Visualizations 101 Table of Contents Find the story within your data Introduction 2 Types of Visualizations 3 Static vs. Animated Charts 6 Drilldowns and Drillthroughs 6 About Logi Analytics 7 1 For centuries,
High-dimensional labeled data analysis with Gabriel graphs
 High-dimensional labeled data analysis with Gabriel graphs Michaël Aupetit CEA - DAM Département Analyse Surveillance Environnement BP 12-91680 - Bruyères-Le-Châtel, France Abstract. We propose the use
Grade 3 Core Standard III Assessment
 Grade 3 Core Standard III Assessment Geometry and Measurement Name: Date: 3.3.1 Identify right angles in two-dimensional shapes and determine if angles are greater than or less than a right angle (obtuse
Mathematics (Project Maths)
") Pre-Leaving Certificate Examination Mathematics (Project Maths) Paper 2 Higher Level February 2010 2½ hours 300 marks Running total Examination number Centre stamp For examiner Question Mark 1 2 3 4 5
Pre-Leaving Certificate Examination Mathematics (Project Maths) Paper 2 Higher Level February 2010 2½ hours 300 marks Running total Examination number Centre stamp For examiner Question Mark 1 2 3 4 5
Data Visualization - A Very Rough Guide
 Data Visualization - A Very Rough Guide Ken Brodlie University of Leeds 1 What is This Thing Called Visualization? Visualization Use of computersupported, interactive, visual representations of data to
GeoGebra. 10 lessons. Gerrit Stols
 GeoGebra in 10 lessons Gerrit Stols Acknowledgements GeoGebra is dynamic mathematics open source (free) software for learning and teaching mathematics in schools. It was developed by Markus Hohenwarter
EDEXCEL FUNCTIONAL SKILLS PILOT TEACHER S NOTES. Maths Level 2. Chapter 5. Shape and space
 Shape and space 5 EDEXCEL FUNCTIONAL SKILLS PILOT TEACHER S NOTES Maths Level 2 Chapter 5 Shape and space SECTION H 1 Perimeter 2 Area 3 Volume 4 2-D Representations of 3-D Objects 5 Remember what you
Freehand Sketching. Sections
 3 Freehand Sketching Sections 3.1 Why Freehand Sketches? 3.2 Freehand Sketching Fundamentals 3.3 Basic Freehand Sketching 3.4 Advanced Freehand Sketching Key Terms Objectives Explain why freehand sketching
Geometry Enduring Understandings Students will understand 1. that all circles are similar.
 High School - Circles Essential Questions: 1. Why are geometry and geometric figures relevant and important? 2. How can geometric ideas be communicated using a variety of representations? ******(i.e maps,
Primary Curriculum 2014
 Primary Curriculum 2014 Suggested Key Objectives for Mathematics at Key Stages 1 and 2 Year 1 Maths Key Objectives Taken from the National Curriculum 1 Count to and across 100, forwards and backwards,
STATS8: Introduction to Biostatistics. Data Exploration. Babak Shahbaba Department of Statistics, UCI
 STATS8: Introduction to Biostatistics Data Exploration Babak Shahbaba Department of Statistics, UCI Introduction After clearly defining the scientific problem, selecting a set of representative members
Prof. Nicolai Meinshausen Regression FS 2014. R Exercises
 Prof. Nicolai Meinshausen Regression FS 2014 R Exercises 1. The goal of this exercise is to get acquainted with different abilities of the R statistical software. It is recommended to use the distributed
Math 5th grade. Create your own number and explain how to use expanded form to show place value to the ten millions place.
 Number Properties and Operations Whole number sense and addition and subtraction are key concepts and skills developed in early childhood. Students build on their number sense and counting sense to develop
Exploratory Data Analysis
 Exploratory Data Analysis Paul Cohen ISTA 370 Spring, 2012 Paul Cohen ISTA 370 () Exploratory Data Analysis Spring, 2012 1 / 46 Outline Data, revisited The purpose of exploratory data analysis Learning
Visualizing class probability estimators
 Visualizing class probability estimators Eibe Frank and Mark Hall Department of Computer Science University of Waikato Hamilton, New Zealand {eibe, mhall}@cs.waikato.ac.nz Abstract. Inducing classifiers
Grade 3 FCAT 2.0 Mathematics Sample Answers
 Grade FCAT 2.0 Mathematics Sample Answers This booklet contains the answers to the FCAT 2.0 Mathematics sample questions, as well as explanations for the answers. It also gives the Next Generation Sunshine
Interaction between quantitative predictors
 Interaction between quantitative predictors In a first-order model like the ones we have discussed, the association between E(y) and a predictor x j does not depend on the value of the other predictors
Shape Dictionary YR to Y6
 Shape Dictionary YR to Y6 Guidance Notes The terms in this dictionary are taken from the booklet Mathematical Vocabulary produced by the National Numeracy Strategy. Children need to understand and use
In mathematics, there are four attainment targets: using and applying mathematics; number and algebra; shape, space and measures, and handling data.
 MATHEMATICS: THE LEVEL DESCRIPTIONS In mathematics, there are four attainment targets: using and applying mathematics; number and algebra; shape, space and measures, and handling data. Attainment target
1.2 GRAPHS OF EQUATIONS. Copyright Cengage Learning. All rights reserved.
 1.2 GRAPHS OF EQUATIONS Copyright Cengage Learning. All rights reserved. What You Should Learn Sketch graphs of equations. Find x- and y-intercepts of graphs of equations. Use symmetry to sketch graphs
Principal components analysis
 CS229 Lecture notes Andrew Ng Part XI Principal components analysis In our discussion of factor analysis, we gave a way to model data x R n as approximately lying in some k-dimension subspace, where k
numerical place value additional topics rounding off numbers power of numbers negative numbers addition with materials fundamentals
 Math Scope & Sequence fundamentals number sense and numeration of the decimal system Count to 10 by units Associate number to numeral (1-10) KN 1 KN 1 KN 2 KN 2 Identify odd and even numbers/numerals and
ANALYTICAL METHODS FOR ENGINEERS
 UNIT 1: Unit code: QCF Level: 4 Credit value: 15 ANALYTICAL METHODS FOR ENGINEERS A/601/1401 OUTCOME - TRIGONOMETRIC METHODS TUTORIAL 1 SINUSOIDAL FUNCTION Be able to analyse and model engineering situations
Figure 2.1: Center of mass of four points.
 Chapter 2 Bézier curves are named after their inventor, Dr. Pierre Bézier. Bézier was an engineer with the Renault car company and set out in the early 196 s to develop a curve formulation which would
Lecture 9: Introduction to Pattern Analysis
 Lecture 9: Introduction to Pattern Analysis g Features, patterns and classifiers g Components of a PR system g An example g Probability definitions g Bayes Theorem g Gaussian densities Features, patterns
Viewing Ecological data using R graphics
 Biostatistics Illustrations in Viewing Ecological data using R graphics A.B. Dufour & N. Pettorelli April 9, 2009 Presentation of the principal graphics dealing with discrete or continuous variables. Course
Expression. Variable Equation Polynomial Monomial Add. Area. Volume Surface Space Length Width. Probability. Chance Random Likely Possibility Odds
 Isosceles Triangle Congruent Leg Side Expression Equation Polynomial Monomial Radical Square Root Check Times Itself Function Relation One Domain Range Area Volume Surface Space Length Width Quantitative
The Forgotten JMP Visualizations (Plus Some New Views in JMP 9) Sam Gardner, SAS Institute, Lafayette, IN, USA
 Sam Gardner, SAS Institute, Lafayette, IN, USA") Paper 156-2010 The Forgotten JMP Visualizations (Plus Some New Views in JMP 9) Sam Gardner, SAS Institute, Lafayette, IN, USA Abstract JMP has a rich set of visual displays that can help you see the information
Paper 156-2010 The Forgotten JMP Visualizations (Plus Some New Views in JMP 9) Sam Gardner, SAS Institute, Lafayette, IN, USA Abstract JMP has a rich set of visual displays that can help you see the information
The VisuLab : an Instrument for Interactive, Comparative Visualization
 Department of Computer Science Information Technology and Education The VisuLab : an Instrument for Interactive, Comparative Visualization Hans Hinterberger Technical Report Nr. 682 November, 2010 Contents
SOLVING TRIGONOMETRIC INEQUALITIES (CONCEPT, METHODS, AND STEPS) By Nghi H. Nguyen
 By Nghi H. Nguyen") SOLVING TRIGONOMETRIC INEQUALITIES (CONCEPT, METHODS, AND STEPS) By Nghi H. Nguyen DEFINITION. A trig inequality is an inequality in standard form: R(x) > 0 (or < 0) that contains one or a few trig functions
SOLVING TRIGONOMETRIC INEQUALITIES (CONCEPT, METHODS, AND STEPS) By Nghi H. Nguyen DEFINITION. A trig inequality is an inequality in standard form: R(x) > 0 (or < 0) that contains one or a few trig functions
Comparison of Non-linear Dimensionality Reduction Techniques for Classification with Gene Expression Microarray Data
 CMPE 59H Comparison of Non-linear Dimensionality Reduction Techniques for Classification with Gene Expression Microarray Data Term Project Report Fatma Güney, Kübra Kalkan 1/15/2013 Keywords: Non-linear
How do you compare numbers? On a number line, larger numbers are to the right and smaller numbers are to the left.
 The verbal answers to all of the following questions should be memorized before completion of pre-algebra. Answers that are not memorized will hinder your ability to succeed in algebra 1. Number Basics
Clustering & Visualization
 Chapter 5 Clustering & Visualization Clustering in high-dimensional databases is an important problem and there are a number of different clustering paradigms which are applicable to high-dimensional data.
Some Comments on the Derivative of a Vector with applications to angular momentum and curvature. E. L. Lady (October 18, 2000)
") Some Comments on the Derivative of a Vector with applications to angular momentum and curvature E. L. Lady (October 18, 2000) Finding the formula in polar coordinates for the angular momentum of a moving
Some Comments on the Derivative of a Vector with applications to angular momentum and curvature E. L. Lady (October 18, 2000) Finding the formula in polar coordinates for the angular momentum of a moving
Geometric Optics Converging Lenses and Mirrors Physics Lab IV
 Objective Geometric Optics Converging Lenses and Mirrors Physics Lab IV In this set of lab exercises, the basic properties geometric optics concerning converging lenses and mirrors will be explored. The
Curriculum Map by Block Geometry Mapping for Math Block Testing 2007-2008. August 20 to August 24 Review concepts from previous grades.
 Curriculum Map by Geometry Mapping for Math Testing 2007-2008 Pre- s 1 August 20 to August 24 Review concepts from previous grades. August 27 to September 28 (Assessment to be completed by September 28)
2006 Geometry Form A Page 1
 2006 Geometry Form Page 1 1. he hypotenuse of a right triangle is 12" long, and one of the acute angles measures 30 degrees. he length of the shorter leg must be: () 4 3 inches () 6 3 inches () 5 inches
Geometry Notes PERIMETER AND AREA
 Perimeter and Area Page 1 of 57 PERIMETER AND AREA Objectives: After completing this section, you should be able to do the following: Calculate the area of given geometric figures. Calculate the perimeter