Sample size calculations for impact evaluations. Marcos Vera-Hernandez UCL, IFS, and PEPA
|
|
|
- William Dale Richard
- 7 years ago
- Views:
Transcription

1 Sample size calculations for impact evaluations Marcos Vera-Hernandez UCL, IFS, and PEPA
2 Objectives When doing an impact evaluation, sometimes we can use existing data. Some other times, we need to collect our own data. Then: What sample size should I use? Considerations to minimize data collection costs How should adjust the sample size computation if I use more than one outcome to assess the intervention Emphasis on practical issues rather than theoretical concepts
3 Topics to be covered Setting the stage/ basic definitions Sample size with continuous outcomes Computations Cost minimization Data loss Sample size with proportions Computations Cluster based impact evaluations Partial take-up and non-compliance Intra cluster correlation Computations Cost minimization Adjustment for multiple outcomes
4 Setting the stage An intervention to evaluate Training program (six months starting July 2014) An outcome variable to assess the success of the intervention Labour earnings as of December 2015 Intervention was allocated using a randomized experiment: Treatment and Control Treated = participants, Control = non-participants
5 Setting the stage Method to estimate the effect of the intervention on the outcome variables (earnings) We need to interview treated and control individuals in January 2016 There are many individuals We will draw a random sample of them (and ask them for their earnings)
6 Setting the stage Compute average earnings for individuals who were allocated to treatment Compute average earnings for individuals who were allocated to control The difference between these two averages include a random component because we only used a sample to compute them (not the entire population) We carry out a test of hypothesis to see if the difference is statistically significant
7 Power and Significance Null hypotheses to test: The intervention does not have an effect on mean earnings The mean earnings of treated individuals is the same as the mean earnings of control individuals This average is not the average in the sample drawn to do the interviews and gather the data, it is the average on the entire population Note, the null hypothesis is pessimistic The intervention will be deemed successful if the null hypothesis is rejected
8 Significance Probability that our test will reject the null hypothesis when it is true Also known as α Probability that our test will say that the average earnings of treatment and control individuals is different when in reality they are the same Usually, we ask this probability to be 0.05 (or smaller)
9 Power Probability that our test will reject the null hypothesis when it is false Probability that our test will say that the average earnings of treatment and control individuals is different when in reality they are different Usually, we ask this probability to be 0.80 (or higher)
10 Conducting sample size calculations for continuous outcomes What is the minimum sample size required to achieve an acceptable level of power (usually 0.8) at a given significance level (usually 0.05)? The test comprises the difference in the average of the outcome variable between treated and control individuals (test of means) We will focus on two-sided tests because they are the most common on impact evaluations
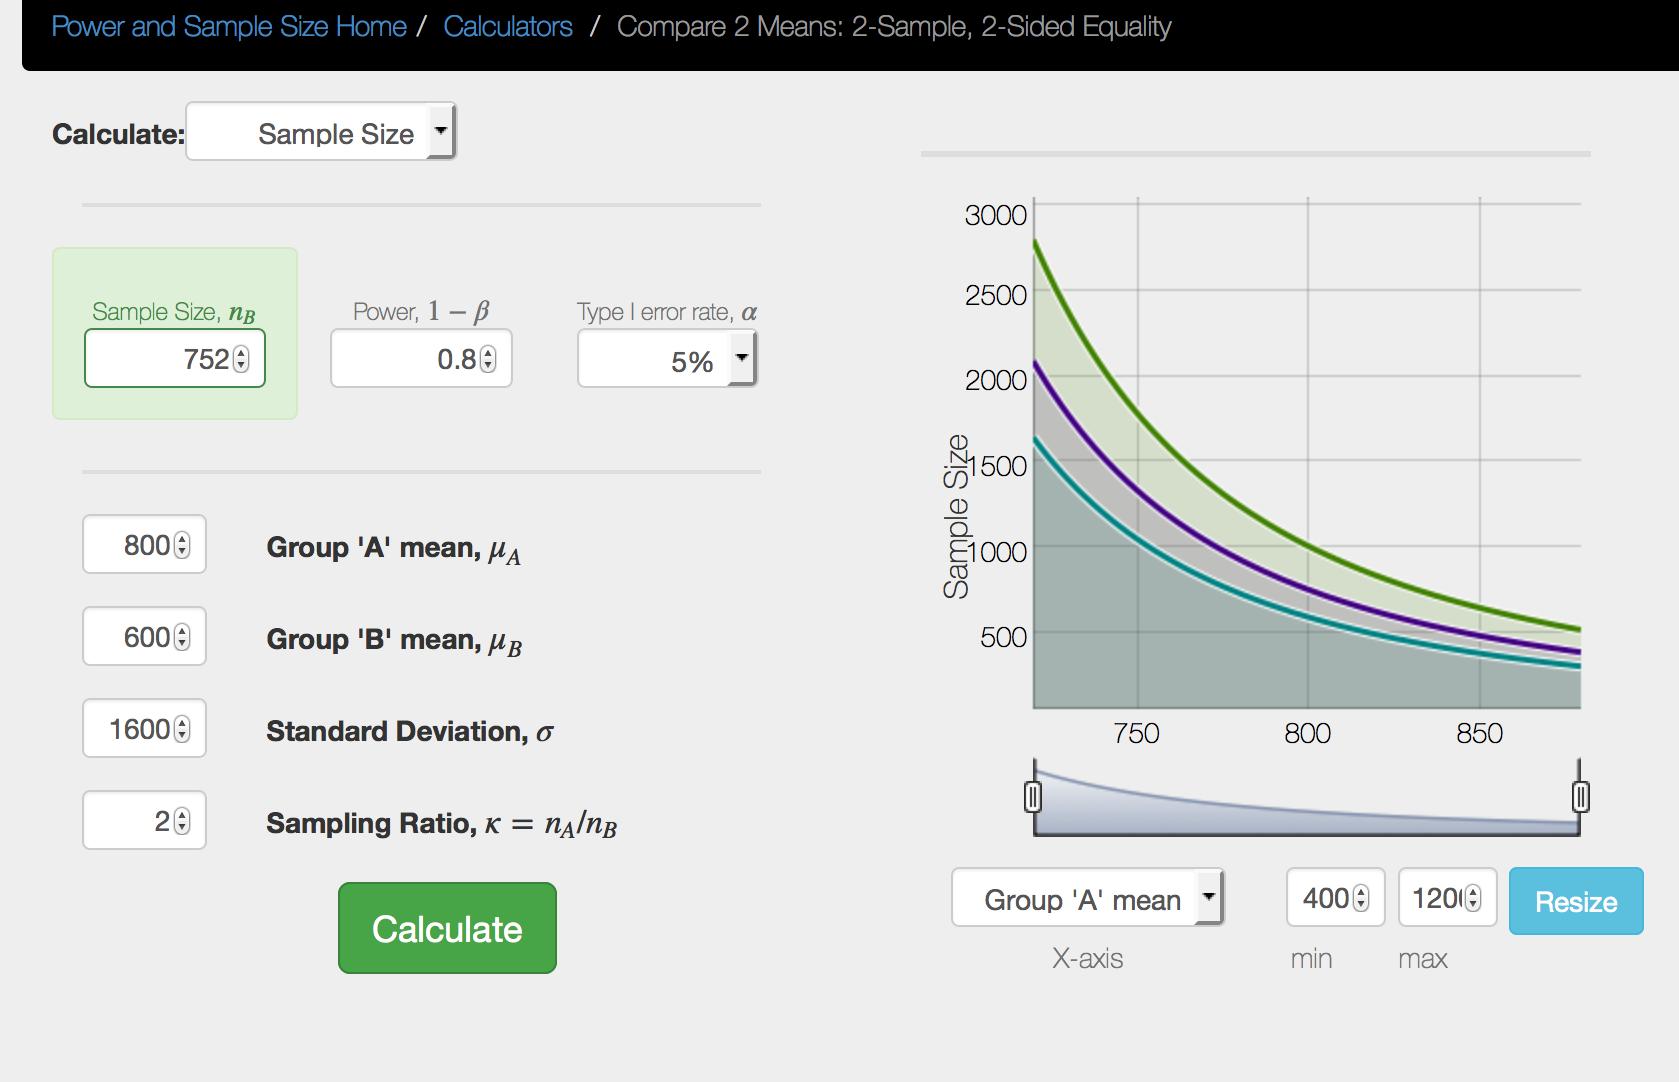
11 Example of continuous outcomes: earnings What information is needed? Power and α Mean of outcome variable for treated (μ A ) Mean of outcome variable for controls (μ B ) Standard deviation of the outcome variables for treated and controls Usually assumed to be the same Ratio of sample in treated versus controls (n A /n B ) Usually 1 but there might be good reasons to have other ratios (see later on)
12 Basic free software: mpare-2-means/2-sample-equality ml Subroutines in STATA (i.e. sampsi) and R
13 An Example for continuous outcomes Using available data sources (i.e. Labour Force Survey, British Household Panel Survey ) and/or other published studies, I estimate that: The mean of monthly earnings will be 600 for the controls (μ B =600) The standard deviation of monthly earnings will be 1600: (σ=1600) I will assume the same standard deviation for treated and controls Based on my reading of existing studies, I expect that the mean of monthly earnings will be 800 for the treated (μ A =800) Other standard parameters: Power =0.80, α=0.05, Ratio n A /n B = 1


14
15 We will need data on 1003 individuals in the control group (n B = 1003) The software only give us the sample size in group B. However, as we specified a ratio of 1 (n A /n B = 1), this means that we will also need data on 1003 individuals of the control group (n A = 1003) Total sample size: = 2006 What happens if we specify a different ratio? For example: (n A /n B = 2)
16
17 What happens if we specify a different ratio? For example: (n A /n B = 2) In this case, n B = 752 Using the relation (n A /n B = 2), we can easily obtain n A = 2 x 752= 1504 Note that =2256 which is larger than The smallest total sample size is achieved with a ratio 1
18 Some important relations The larger the power, the larger the sample The smaller α, the larger the sample The larger the difference between the means of the treatment and control group, the smaller the sample The larger the standard deviation, the larger the sample
19 Cost minimization Sometimes, it is much more costly to collect information from treated individuals than from controls For instance, we might have to pay the training program for treated individuals In this case, it makes sense to try several ratios to see which one minimizes the cost Of course, the books also contain formulas that give you the result directly
20 Cost Minimization Ratio N Controls N treated Cost per treated Cost per control Total cost All these combinations give you the same power at the same α, so it makes sense to use the one that minimizes the cost
21 Data loss The sample size obtained are the minimum sample size to achieve the specified power at the specified α But it is realistic to think that some data will be lost: An individual that agrees to participate but later on he/she changes his mind We will not be able to locate an individual that initially agreed to participate Some individuals will not want to answer the question on earnings Some other data (gender, age, education) might be missing We should inflate the minimum sample size by some percentage to allow for this loss of data
22 Conducting sample size calculations for outcomes which are measured as proportions What is the minimum sample size required to achieve an acceptable level of power (usually 0.8) at a given significance level (usually 0.05)? We will focus on two-sided tests because they are the most common on impact evaluations
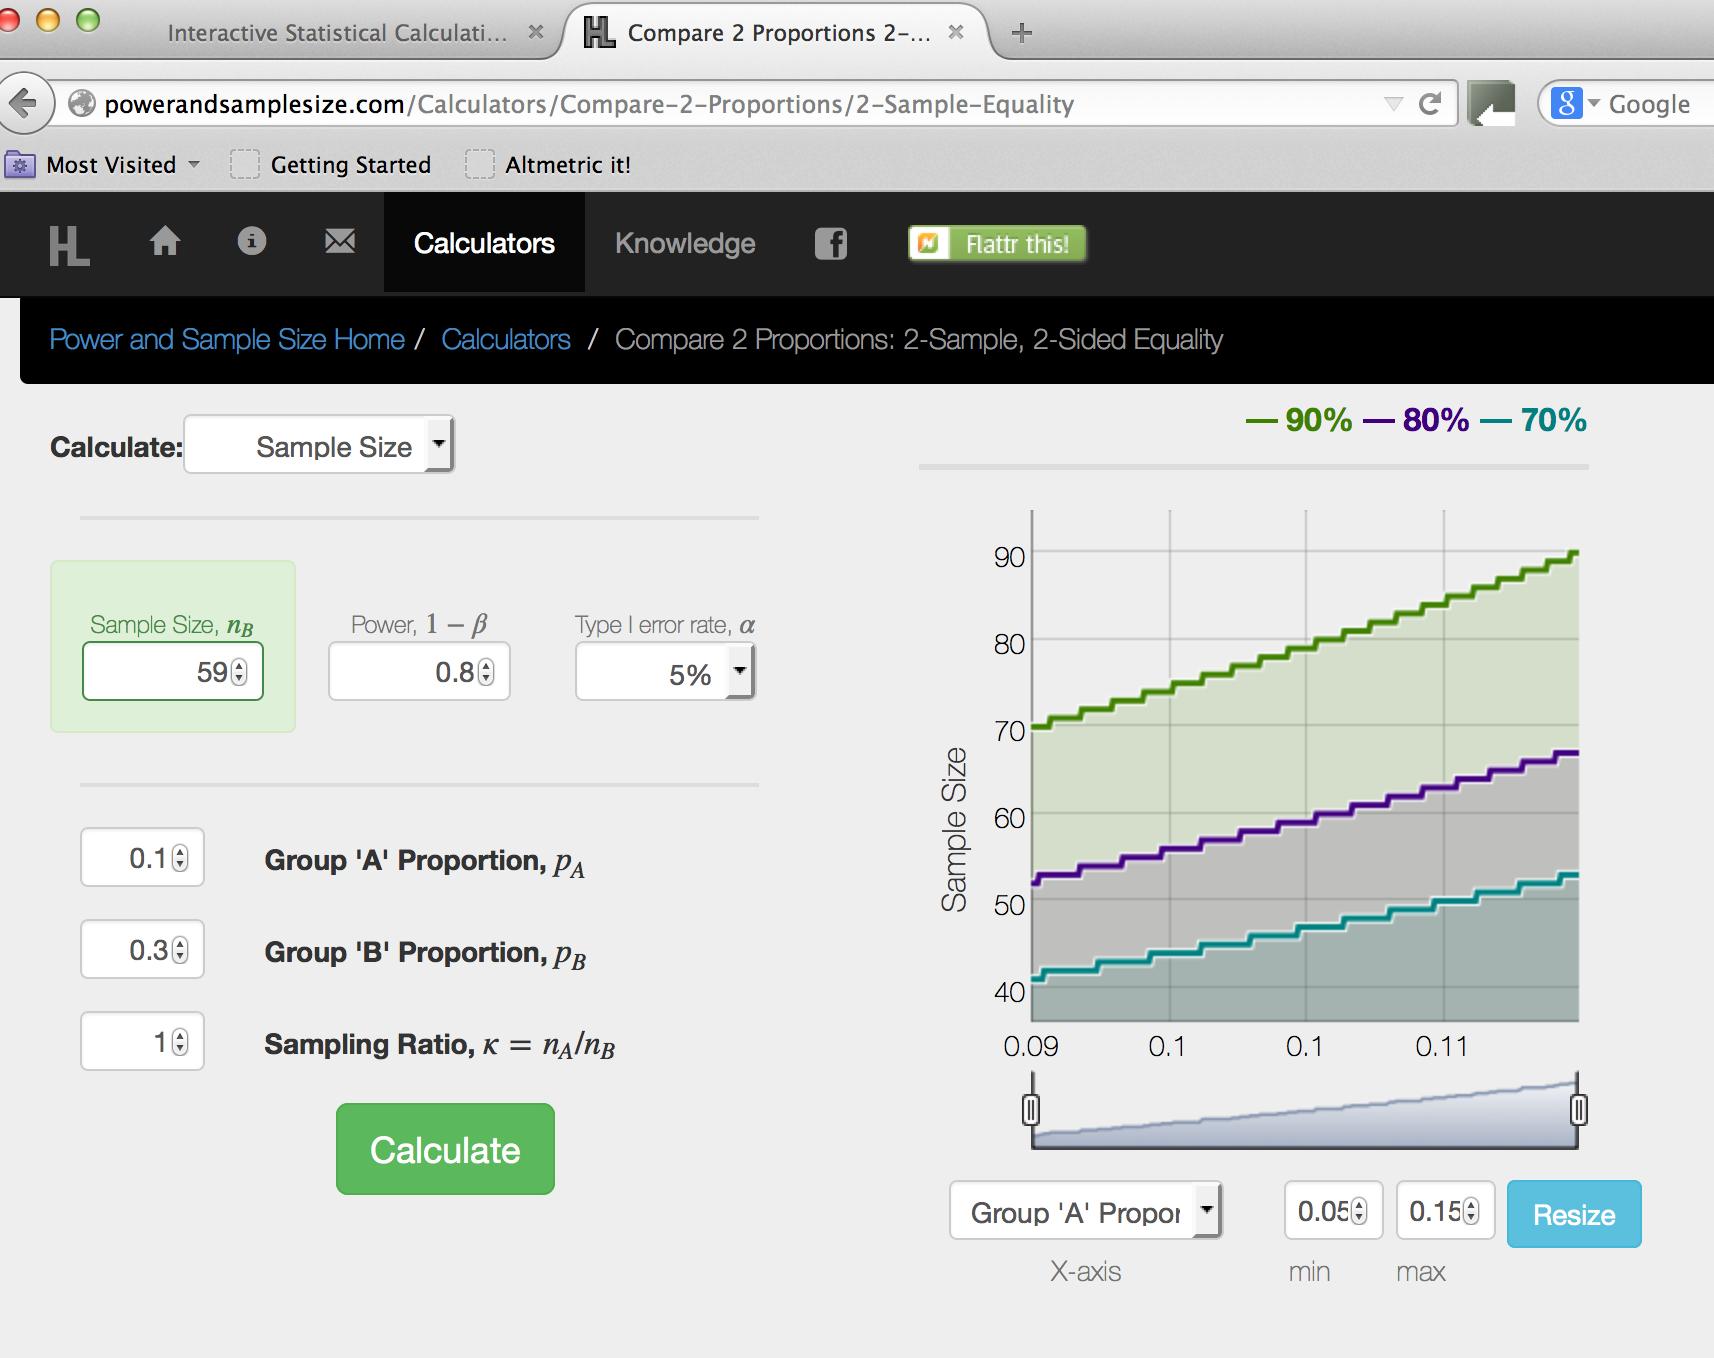
23 Example: proportion unemployed What information is needed? Power and α Proportion for treated (p A ) Proportion for controls (p B ) The standard deviation is not needed for such data as proportions Ratio of sample in treated versus controls (n A /n B ) Usually 1 but there might be good reasons to have other ratios (see later on)
24 An Example for proportions Using available data sources (i.e. Labour Force Survey, British Household Panel Survey ) and/or other published studies, I estimate that: The proportion of unemployed control individuals will be 0.3 (p B =0.3) Based on my reading of existing studies, I expect proportion of unemployed treated individuals to be 0.1 (p A =0.1) Other standard parameters: Power =0.80, α=0.05, Ratio n A /n B = 1 Sample-Equality
25
26 About proportions For a given difference between p A and p B, the closer the proportions are to 0.5, the larger the sample required will be This is because the standard deviation is higher when the proportions are close to 0.5 All other considerations are the same as in the continuous outcomes, including data loss, cost minimization
27 Cluster based Impact Evaluations
28 Cluster based impact evaluations Outcomes at the individual level (earnings, test scores ) but intervention is allocated at a higher level (area, school, ) Because of logistical/political feasibility or to avoid contamination from treatment to control (i.e. two students in the same class) The higher level (school, area ) is referred as the cluster Computations have to be adjusted for two factors Partial take-up and non-compliance Statistical dependence of individuals belonging to the same cluster
29 Partial take-up and non-compliance The training intervention that we are evaluating is for individuals aged and takes place in some local area authorities (LEA) and not others The cluster is the LEA Only 80% of individuals aged sign up for the intervention in treated LEA 10% of individuals aged sign up for the intervention in control LEA (administrative error...) We must re-adjust the income averages of 600 & 800 μ A = 0.8 x 800 +(1-0.8) x 600 = 760 μ B = 0.9 x 600 +(1-0.9) x 800 = 620 You would do the same for proportions Sometimes, you do not need to adjust because take-up is full and non-compliance is null
30 Statistical dependence within cluster Things happen within a cluster (school, area...) that make individuals to have similar values of the outcome variable (teacher quality, plant closures,...) If I already collected data from 10 people from the same area, collecting data from another person from the same area does not add much additional information (if the statistical dependence is strong) The statistic to measure such statistical dependence is the Intra Cluster Correlation
31 Statistical dependence within cluster Intra Cluster Correlation (ICC): S 2 b= variance of the outcome variable (i.e. earnings) between clusters Compute the average of the outcome variable in each cluster Compute the variance of those averages S 2 w= variance of the outcome variable (i.e. earnings) within clusters Compute the variance outcome variable in each cluster Compute the average of all those variances In Stata, you can easily compute it using: loneway earnings idcluster If there is maximum dependence (all individuals in the same cluster have the same value of the outcome variable) then S 2 w=0, then the ICC is 1 If there is no dependence within clusters (all clusters have the same average value of the outcome variable) then S 2 b=0, then the ICC is 0 The ICC is between 0 and 1. Usually, the larger the cluster the smaller the ICC is S 2 b S 2 b S 2 w
32 Statistical dependence within cluster Intra Cluster Correlation (ICC): S S How do I know that ICC for my sample size calculation? You can either use a dataset similar to the one that you will be collecting (same outcome variable, same definition of cluster, similar population) You can obtain it from published articles or from publicly accessible research proposals 2 b 2 b S 2 w
33 Statistical dependence within cluster Design Effect (DE): DE 1 ( m 1) m number of individuals per cluster intra cluster correlation coefficien t Once we have computed the sample size ignoring any statistical dependence within cluster (using the methods previously outlined), then we must multiply that sample size by the Design Effect to obtain the total sample size adjusted for statistical dependence within clusters
34 Example cluster based impact evaluation Once we have adjusted for partial take-up and noncompliance, we assume that: μ A = 0.8 x 800 +(1-0.8) x 600 = 760 μ B = 0.9 x 600 +(1-0.9) x 800 = 620 We use software to compute the required sample size ignoring any issues related to statistical dependence within clusters We obtain 2047x2=4094 individuals using standard levels of power and α (see screenshot in following slide)
35
36 Example cluster based impact evaluation Now, we must take the 4094 and adjust it for statistical dependence Using published studies, we assume that the ICC of earnings (at the area level) will be 0.05 If we have 10 individuals per cluster, the DE will be 1+(10-1) x 0.05 = 1.45 If we have 15 individuals per cluster, the DE will be 1+(15-1) x 0.05 = 1.70 If we choose 10 individuals per cluster, we multiply 4094 by 1.45 = 5936 total number of individuals (the total number of clusters will be 5936 /10=594) If we choose 15 individuals per cluster, we multiply 4094 by 1.70 = 6960 total number of individuals (the total number of clusters will be 6960 /15=464)
37 Software for cluster based IE You do not need special software, you can use what we have just done in a spreadsheet The software below will not adjust for the partial take-up or non-compliance directly, you have to make the adjustment before entering the parameters STATA: Install the user command sampclus Type: sampsi: , sd(1600) power(0.8) And then type: samplcus, rho(0.05) obsclus(10) An alternative is to use this other STATA command that allows to enter different number of treated and control clusters: This can be very useful if the cost of a treatment cluster is different than the cost of a control cluster or if there are other constraints that limit the number of either treatment and control clusters Optimal Design: For proportions, this software uses a different way of adjustment
38 Cost Minimization for cluster based IE As we saw, there are different combinations of number of clusters and number of people per cluster that give the same power If we choose 10 individuals per cluster, we need 5936 individuals (594 clusters, each with 10 individuals) If we choose 15 individuals per cluster, we need 6960 individuals (464 clusters, each with 15 individuals) Usually there is a fixed cost of going into a cluster plus a marginal cost of interviewing a person within each cluster By trying different number of individuals per cluster, we can choose the combination of number of clusters and number of individuals per cluster that minimizes the cost Software such as clampsi or Optimal Design can also do this for us
39 Cost Minimization for cluster based IE If the cost of each treatment cluster is higher than the cost of each control cluster, we might be able to further decrease costs (but keep the same level of power) by using more control clusters than treatment clusters Software clsampsi might be very useful for this (
40 Correction for Multiple Outcomes
41 Multiple Outcomes It is standard to use more than one indicator to assess the success of the intervention For instance: earnings and unemployment We want to be sure that that the probability of rejecting any of the null hypotheses (two in this case) when they are both true is still 0.05 This is known as the Familywise Error Rate This will not be true if we use an α of 0.05 for each hypothesis Probability of rejecting either earnings or unemployment = 1 Probability of not rejecting either earnings or unemployment 1 (1-0.05)(1-0.05)= which is larger than 0.05 The intuition is that because we are carrying out more than one test, it gets easier to reject one of them (because of bad luck) even if they are all true This will mean that we will have to use an α for each test that is smaller than 0.05 (adjustment)
42 Adjustments for multiple outcomes They consist of using an α for each test that is smaller than 0.05, so that the FWER is kept at 0.05 Many methods: Bonferroni: α= FWER/(Number of Outcomes) α= 0.05/2= Tukey: 1/ number outcomes a =1-(1- FWER) a =1-(1-0.05) 1/ 2 =
43 Example of adjustments for multiple outcomes We go back to the two examples of the beginning: earnings and proportion of unemployed But we carry out the computations using an α of (following the Bonferroni method) so that the FWER is 0.05
44

45
46 Example of adjustments for multiple outcomes So we will need 1214x2 = 2428 individuals for earnings and 72x2=144 for proportion of unemployment Clearly, we must go for the maximum of these two numbers: 2428 individuals Note that this is larger than the number that we computed at the beginning (2006) that did not adjust for multiple outcomes
47 Thank you!
Introduction. Hypothesis Testing. Hypothesis Testing. Significance Testing
 Introduction Hypothesis Testing Mark Lunt Arthritis Research UK Centre for Ecellence in Epidemiology University of Manchester 13/10/2015 We saw last week that we can never know the population parameters
Descriptive Methods Ch. 6 and 7
 Descriptive Methods Ch. 6 and 7 Purpose of Descriptive Research Purely descriptive research describes the characteristics or behaviors of a given population in a systematic and accurate fashion. Correlational
Chapter 8 Hypothesis Testing Chapter 8 Hypothesis Testing 8-1 Overview 8-2 Basics of Hypothesis Testing
 Chapter 8 Hypothesis Testing 1 Chapter 8 Hypothesis Testing 8-1 Overview 8-2 Basics of Hypothesis Testing 8-3 Testing a Claim About a Proportion 8-5 Testing a Claim About a Mean: s Not Known 8-6 Testing
Experimental Design. Power and Sample Size Determination. Proportions. Proportions. Confidence Interval for p. The Binomial Test
 Experimental Design Power and Sample Size Determination Bret Hanlon and Bret Larget Department of Statistics University of Wisconsin Madison November 3 8, 2011 To this point in the semester, we have largely
Hypothesis testing - Steps
 Hypothesis testing - Steps Steps to do a two-tailed test of the hypothesis that β 1 0: 1. Set up the hypotheses: H 0 : β 1 = 0 H a : β 1 0. 2. Compute the test statistic: t = b 1 0 Std. error of b 1 =
Introduction to Hypothesis Testing
 I. Terms, Concepts. Introduction to Hypothesis Testing A. In general, we do not know the true value of population parameters - they must be estimated. However, we do have hypotheses about what the true
UNIVERSITY OF NAIROBI
 UNIVERSITY OF NAIROBI MASTERS IN PROJECT PLANNING AND MANAGEMENT NAME: SARU CAROLYNN ELIZABETH REGISTRATION NO: L50/61646/2013 COURSE CODE: LDP 603 COURSE TITLE: RESEARCH METHODS LECTURER: GAKUU CHRISTOPHER
Association Between Variables
 Contents 11 Association Between Variables 767 11.1 Introduction............................ 767 11.1.1 Measure of Association................. 768 11.1.2 Chapter Summary.................... 769 11.2 Chi
Opgaven Onderzoeksmethoden, Onderdeel Statistiek
 Opgaven Onderzoeksmethoden, Onderdeel Statistiek 1. What is the measurement scale of the following variables? a Shoe size b Religion c Car brand d Score in a tennis game e Number of work hours per week
Study Guide for the Final Exam
 Study Guide for the Final Exam When studying, remember that the computational portion of the exam will only involve new material (covered after the second midterm), that material from Exam 1 will make
Unit 26 Estimation with Confidence Intervals
 Unit 26 Estimation with Confidence Intervals Objectives: To see how confidence intervals are used to estimate a population proportion, a population mean, a difference in population proportions, or a difference
Maths Mastery in Primary Schools
 Maths Mastery in Primary Schools Institute of Education, University of London John Jerrim Evaluation Summary Age range Year 7 Number of pupils c. 10,000 Number of schools 50 Design Primary Outcome Randomised
Unit 31 A Hypothesis Test about Correlation and Slope in a Simple Linear Regression
 Unit 31 A Hypothesis Test about Correlation and Slope in a Simple Linear Regression Objectives: To perform a hypothesis test concerning the slope of a least squares line To recognize that testing for a
Hypothesis testing. c 2014, Jeffrey S. Simonoff 1
 Hypothesis testing So far, we ve talked about inference from the point of estimation. We ve tried to answer questions like What is a good estimate for a typical value? or How much variability is there
Simple Regression Theory II 2010 Samuel L. Baker
 SIMPLE REGRESSION THEORY II 1 Simple Regression Theory II 2010 Samuel L. Baker Assessing how good the regression equation is likely to be Assignment 1A gets into drawing inferences about how close the
Planning sample size for randomized evaluations
 TRANSLATING RESEARCH INTO ACTION Planning sample size for randomized evaluations Simone Schaner Dartmouth College povertyactionlab.org 1 Course Overview Why evaluate? What is evaluation? Outcomes, indicators
Non-Inferiority Tests for Two Means using Differences
 Chapter 450 on-inferiority Tests for Two Means using Differences Introduction This procedure computes power and sample size for non-inferiority tests in two-sample designs in which the outcome is a continuous
Inclusion and Exclusion Criteria
 Inclusion and Exclusion Criteria Inclusion criteria = attributes of subjects that are essential for their selection to participate. Inclusion criteria function remove the influence of specific confounding
LAB 4 INSTRUCTIONS CONFIDENCE INTERVALS AND HYPOTHESIS TESTING
 LAB 4 INSTRUCTIONS CONFIDENCE INTERVALS AND HYPOTHESIS TESTING In this lab you will explore the concept of a confidence interval and hypothesis testing through a simulation problem in engineering setting.
Introduction to Hypothesis Testing. Hypothesis Testing. Step 1: State the Hypotheses
 Introduction to Hypothesis Testing 1 Hypothesis Testing A hypothesis test is a statistical procedure that uses sample data to evaluate a hypothesis about a population Hypothesis is stated in terms of the
Descriptive Statistics
 Descriptive Statistics Primer Descriptive statistics Central tendency Variation Relative position Relationships Calculating descriptive statistics Descriptive Statistics Purpose to describe or summarize
Stat 411/511 THE RANDOMIZATION TEST. Charlotte Wickham. stat511.cwick.co.nz. Oct 16 2015
 Stat 411/511 THE RANDOMIZATION TEST Oct 16 2015 Charlotte Wickham stat511.cwick.co.nz Today Review randomization model Conduct randomization test What about CIs? Using a t-distribution as an approximation
CLUSTER SAMPLE SIZE CALCULATOR USER MANUAL
 1 4 9 5 CLUSTER SAMPLE SIZE CALCULATOR USER MANUAL Health Services Research Unit University of Aberdeen Polwarth Building Foresterhill ABERDEEN AB25 2ZD UK Tel: +44 (0)1224 663123 extn 53909 May 1999 1
CALCULATIONS & STATISTICS
 CALCULATIONS & STATISTICS CALCULATION OF SCORES Conversion of 1-5 scale to 0-100 scores When you look at your report, you will notice that the scores are reported on a 0-100 scale, even though respondents
General Method: Difference of Means. 3. Calculate df: either Welch-Satterthwaite formula or simpler df = min(n 1, n 2 ) 1.
 1.") General Method: Difference of Means 1. Calculate x 1, x 2, SE 1, SE 2. 2. Combined SE = SE1 2 + SE2 2. ASSUMES INDEPENDENT SAMPLES. 3. Calculate df: either Welch-Satterthwaite formula or simpler df = min(n
General Method: Difference of Means 1. Calculate x 1, x 2, SE 1, SE 2. 2. Combined SE = SE1 2 + SE2 2. ASSUMES INDEPENDENT SAMPLES. 3. Calculate df: either Welch-Satterthwaite formula or simpler df = min(n
Normal distribution. ) 2 /2σ. 2π σ
 2 /2σ. 2π σ") Normal distribution The normal distribution is the most widely known and used of all distributions. Because the normal distribution approximates many natural phenomena so well, it has developed into a
Normal distribution The normal distribution is the most widely known and used of all distributions. Because the normal distribution approximates many natural phenomena so well, it has developed into a
Good luck! BUSINESS STATISTICS FINAL EXAM INSTRUCTIONS. Name:
 Glo bal Leadership M BA BUSINESS STATISTICS FINAL EXAM Name: INSTRUCTIONS 1. Do not open this exam until instructed to do so. 2. Be sure to fill in your name before starting the exam. 3. You have two hours
Study Design Sample Size Calculation & Power Analysis. RCMAR/CHIME April 21, 2014 Honghu Liu, PhD Professor University of California Los Angeles
 Study Design Sample Size Calculation & Power Analysis RCMAR/CHIME April 21, 2014 Honghu Liu, PhD Professor University of California Los Angeles Contents 1. Background 2. Common Designs 3. Examples 4. Computer
Sample Size and Power in Clinical Trials
 Sample Size and Power in Clinical Trials Version 1.0 May 011 1. Power of a Test. Factors affecting Power 3. Required Sample Size RELATED ISSUES 1. Effect Size. Test Statistics 3. Variation 4. Significance
Section 13, Part 1 ANOVA. Analysis Of Variance
 Section 13, Part 1 ANOVA Analysis Of Variance Course Overview So far in this course we ve covered: Descriptive statistics Summary statistics Tables and Graphs Probability Probability Rules Probability
Chapter 5 Analysis of variance SPSS Analysis of variance
 Chapter 5 Analysis of variance SPSS Analysis of variance Data file used: gss.sav How to get there: Analyze Compare Means One-way ANOVA To test the null hypothesis that several population means are equal,
Class 19: Two Way Tables, Conditional Distributions, Chi-Square (Text: Sections 2.5; 9.1)
") Spring 204 Class 9: Two Way Tables, Conditional Distributions, Chi-Square (Text: Sections 2.5; 9.) Big Picture: More than Two Samples In Chapter 7: We looked at quantitative variables and compared the
Spring 204 Class 9: Two Way Tables, Conditional Distributions, Chi-Square (Text: Sections 2.5; 9.) Big Picture: More than Two Samples In Chapter 7: We looked at quantitative variables and compared the
Section 7.1. Introduction to Hypothesis Testing. Schrodinger s cat quantum mechanics thought experiment (1935)
") Section 7.1 Introduction to Hypothesis Testing Schrodinger s cat quantum mechanics thought experiment (1935) Statistical Hypotheses A statistical hypothesis is a claim about a population. Null hypothesis
Section 7.1 Introduction to Hypothesis Testing Schrodinger s cat quantum mechanics thought experiment (1935) Statistical Hypotheses A statistical hypothesis is a claim about a population. Null hypothesis
What s New in Econometrics? Lecture 8 Cluster and Stratified Sampling
 What s New in Econometrics? Lecture 8 Cluster and Stratified Sampling Jeff Wooldridge NBER Summer Institute, 2007 1. The Linear Model with Cluster Effects 2. Estimation with a Small Number of Groups and
NON-PROBABILITY SAMPLING TECHNIQUES
 NON-PROBABILITY SAMPLING TECHNIQUES PRESENTED BY Name: WINNIE MUGERA Reg No: L50/62004/2013 RESEARCH METHODS LDP 603 UNIVERSITY OF NAIROBI Date: APRIL 2013 SAMPLING Sampling is the use of a subset of the
Using Excel for inferential statistics
 FACT SHEET Using Excel for inferential statistics Introduction When you collect data, you expect a certain amount of variation, just caused by chance. A wide variety of statistical tests can be applied
Power calculation for causal inference in social science Sample size and minimum detectable effect determination March 2016.
 Eric W Djimeu Deo-Gracias Houndolo Power calculation for causal inference in social science Sample size and minimum detectable effect determination March 2016 Working Paper 26 3ie manual Power calculation
National Disability Authority Resource Allocation Feasibility Study Final Report January 2013
 National Disability Authority Resource Allocation Feasibility Study January 2013 The National Disability Authority (NDA) has commissioned and funded this evaluation. Responsibility for the evaluation (including
HYPOTHESIS TESTING: POWER OF THE TEST
 HYPOTHESIS TESTING: POWER OF THE TEST The first 6 steps of the 9-step test of hypothesis are called "the test". These steps are not dependent on the observed data values. When planning a research project,
research/scientific includes the following: statistical hypotheses: you have a null and alternative you accept one and reject the other
 1 Hypothesis Testing Richard S. Balkin, Ph.D., LPC-S, NCC 2 Overview When we have questions about the effect of a treatment or intervention or wish to compare groups, we use hypothesis testing Parametric
IS 30 THE MAGIC NUMBER? ISSUES IN SAMPLE SIZE ESTIMATION
 Current Topic IS 30 THE MAGIC NUMBER? ISSUES IN SAMPLE SIZE ESTIMATION Sitanshu Sekhar Kar 1, Archana Ramalingam 2 1Assistant Professor; 2 Post- graduate, Department of Preventive and Social Medicine,
Linear Models in STATA and ANOVA
 Session 4 Linear Models in STATA and ANOVA Page Strengths of Linear Relationships 4-2 A Note on Non-Linear Relationships 4-4 Multiple Linear Regression 4-5 Removal of Variables 4-8 Independent Samples
MULTIPLE CHOICE. Choose the one alternative that best completes the statement or answers the question.
 Sample Practice problems - chapter 12-1 and 2 proportions for inference - Z Distributions Name MULTIPLE CHOICE. Choose the one alternative that best completes the statement or answers the question. Provide
Additional sources Compilation of sources: http://lrs.ed.uiuc.edu/tseportal/datacollectionmethodologies/jin-tselink/tselink.htm
 Mgt 540 Research Methods Data Analysis 1 Additional sources Compilation of sources: http://lrs.ed.uiuc.edu/tseportal/datacollectionmethodologies/jin-tselink/tselink.htm http://web.utk.edu/~dap/random/order/start.htm
Analysis of Data. Organizing Data Files in SPSS. Descriptive Statistics
 Analysis of Data Claudia J. Stanny PSY 67 Research Design Organizing Data Files in SPSS All data for one subject entered on the same line Identification data Between-subjects manipulations: variable to
Research Methods & Experimental Design
 Research Methods & Experimental Design 16.422 Human Supervisory Control April 2004 Research Methods Qualitative vs. quantitative Understanding the relationship between objectives (research question) and
Lesson 1: Comparison of Population Means Part c: Comparison of Two- Means
 Lesson : Comparison of Population Means Part c: Comparison of Two- Means Welcome to lesson c. This third lesson of lesson will discuss hypothesis testing for two independent means. Steps in Hypothesis
Statistics 2014 Scoring Guidelines
 AP Statistics 2014 Scoring Guidelines College Board, Advanced Placement Program, AP, AP Central, and the acorn logo are registered trademarks of the College Board. AP Central is the official online home
HYPOTHESIS TESTING (ONE SAMPLE) - CHAPTER 7 1. used confidence intervals to answer questions such as...
 - CHAPTER 7 1. used confidence intervals to answer questions such as...") HYPOTHESIS TESTING (ONE SAMPLE) - CHAPTER 7 1 PREVIOUSLY used confidence intervals to answer questions such as... You know that 0.25% of women have red/green color blindness. You conduct a study of men
HYPOTHESIS TESTING (ONE SAMPLE) - CHAPTER 7 1 PREVIOUSLY used confidence intervals to answer questions such as... You know that 0.25% of women have red/green color blindness. You conduct a study of men
Analysing Questionnaires using Minitab (for SPSS queries contact -) Graham.Currell@uwe.ac.uk
 Graham.Currell@uwe.ac.uk") Analysing Questionnaires using Minitab (for SPSS queries contact -) Graham.Currell@uwe.ac.uk Structure As a starting point it is useful to consider a basic questionnaire as containing three main sections:
Analysing Questionnaires using Minitab (for SPSS queries contact -) Graham.Currell@uwe.ac.uk Structure As a starting point it is useful to consider a basic questionnaire as containing three main sections:
SAMPLING & INFERENTIAL STATISTICS. Sampling is necessary to make inferences about a population.
 SAMPLING & INFERENTIAL STATISTICS Sampling is necessary to make inferences about a population. SAMPLING The group that you observe or collect data from is the sample. The group that you make generalizations
C. The null hypothesis is not rejected when the alternative hypothesis is true. A. population parameters.
 Sample Multiple Choice Questions for the material since Midterm 2. Sample questions from Midterms and 2 are also representative of questions that may appear on the final exam.. A randomly selected sample
CHAPTER 14 ORDINAL MEASURES OF CORRELATION: SPEARMAN'S RHO AND GAMMA
 CHAPTER 14 ORDINAL MEASURES OF CORRELATION: SPEARMAN'S RHO AND GAMMA Chapter 13 introduced the concept of correlation statistics and explained the use of Pearson's Correlation Coefficient when working
Survey Research: Choice of Instrument, Sample. Lynda Burton, ScD Johns Hopkins University
 This work is licensed under a Creative Commons Attribution-NonCommercial-ShareAlike License. Your use of this material constitutes acceptance of that license and the conditions of use of materials on this
2 Precision-based sample size calculations
 Statistics: An introduction to sample size calculations Rosie Cornish. 2006. 1 Introduction One crucial aspect of study design is deciding how big your sample should be. If you increase your sample size
Non-Parametric Tests (I)
") Lecture 5: Non-Parametric Tests (I) KimHuat LIM lim@stats.ox.ac.uk http://www.stats.ox.ac.uk/~lim/teaching.html Slide 1 5.1 Outline (i) Overview of Distribution-Free Tests (ii) Median Test for Two Independent
Lecture 5: Non-Parametric Tests (I) KimHuat LIM lim@stats.ox.ac.uk http://www.stats.ox.ac.uk/~lim/teaching.html Slide 1 5.1 Outline (i) Overview of Distribution-Free Tests (ii) Median Test for Two Independent
Calculating P-Values. Parkland College. Isela Guerra Parkland College. Recommended Citation
 Parkland College A with Honors Projects Honors Program 2014 Calculating P-Values Isela Guerra Parkland College Recommended Citation Guerra, Isela, "Calculating P-Values" (2014). A with Honors Projects.
Using Stata for One Sample Tests
 Using Stata for One Sample Tests All of the one sample problems we have discussed so far can be solved in Stata via either (a) statistical calculator functions, where you provide Stata with the necessary
3.4 Statistical inference for 2 populations based on two samples
 3.4 Statistical inference for 2 populations based on two samples Tests for a difference between two population means The first sample will be denoted as X 1, X 2,..., X m. The second sample will be denoted
Making Jobs Good. John Schmitt and Janelle Jones. April 2013
 Making Jobs Good John Schmitt and Janelle Jones April 2013 Center for Economic and Policy Research 1611 Connecticut Avenue, NW, Suite 400 Washington, D.C. 20009 202-293-5380 www.cepr.net CEPR Making Jobs
A Primer on Mathematical Statistics and Univariate Distributions; The Normal Distribution; The GLM with the Normal Distribution
 A Primer on Mathematical Statistics and Univariate Distributions; The Normal Distribution; The GLM with the Normal Distribution PSYC 943 (930): Fundamentals of Multivariate Modeling Lecture 4: September
Northumberland Knowledge
 Northumberland Knowledge Know Guide How to Analyse Data - November 2012 - This page has been left blank 2 About this guide The Know Guides are a suite of documents that provide useful information about
Name: Date: Use the following to answer questions 3-4:
 Name: Date: 1. Determine whether each of the following statements is true or false. A) The margin of error for a 95% confidence interval for the mean increases as the sample size increases. B) The margin
UNDERSTANDING THE TWO-WAY ANOVA
 UNDERSTANDING THE e have seen how the one-way ANOVA can be used to compare two or more sample means in studies involving a single independent variable. This can be extended to two independent variables
Effects of CEO turnover on company performance
 Headlight International Effects of CEO turnover on company performance CEO turnover in listed companies has increased over the past decades. This paper explores whether or not changing CEO has a significant
Contingency Tables and the Chi Square Statistic. Interpreting Computer Printouts and Constructing Tables
 Contingency Tables and the Chi Square Statistic Interpreting Computer Printouts and Constructing Tables Contingency Tables/Chi Square Statistics What are they? A contingency table is a table that shows
Guided Reading 9 th Edition. informed consent, protection from harm, deception, confidentiality, and anonymity.
 Guided Reading Educational Research: Competencies for Analysis and Applications 9th Edition EDFS 635: Educational Research Chapter 1: Introduction to Educational Research 1. List and briefly describe the
Sample Size Issues for Conjoint Analysis
 Chapter 7 Sample Size Issues for Conjoint Analysis I m about to conduct a conjoint analysis study. How large a sample size do I need? What will be the margin of error of my estimates if I use a sample
Writing Your PG Research Project Proposal
 Writing Your PG Research Project Proposal Typically, most research project proposals will contain the following elements: The proposed title of your research project An outline of the scope and rationale
BA 275 Review Problems - Week 6 (10/30/06-11/3/06) CD Lessons: 53, 54, 55, 56 Textbook: pp. 394-398, 404-408, 410-420
 CD Lessons: 53, 54, 55, 56 Textbook: pp. 394-398, 404-408, 410-420") BA 275 Review Problems - Week 6 (10/30/06-11/3/06) CD Lessons: 53, 54, 55, 56 Textbook: pp. 394-398, 404-408, 410-420 1. Which of the following will increase the value of the power in a statistical test
BA 275 Review Problems - Week 6 (10/30/06-11/3/06) CD Lessons: 53, 54, 55, 56 Textbook: pp. 394-398, 404-408, 410-420 1. Which of the following will increase the value of the power in a statistical test
STAT 350 Practice Final Exam Solution (Spring 2015)
") PART 1: Multiple Choice Questions: 1) A study was conducted to compare five different training programs for improving endurance. Forty subjects were randomly divided into five groups of eight subjects
PART 1: Multiple Choice Questions: 1) A study was conducted to compare five different training programs for improving endurance. Forty subjects were randomly divided into five groups of eight subjects
Business Statistics, 9e (Groebner/Shannon/Fry) Chapter 9 Introduction to Hypothesis Testing
 Chapter 9 Introduction to Hypothesis Testing") Business Statistics, 9e (Groebner/Shannon/Fry) Chapter 9 Introduction to Hypothesis Testing 1) Hypothesis testing and confidence interval estimation are essentially two totally different statistical procedures
Business Statistics, 9e (Groebner/Shannon/Fry) Chapter 9 Introduction to Hypothesis Testing 1) Hypothesis testing and confidence interval estimation are essentially two totally different statistical procedures
Example: Boats and Manatees
 Figure 9-6 Example: Boats and Manatees Slide 1 Given the sample data in Table 9-1, find the value of the linear correlation coefficient r, then refer to Table A-6 to determine whether there is a significant
Non-Inferiority Tests for One Mean
 Chapter 45 Non-Inferiority ests for One Mean Introduction his module computes power and sample size for non-inferiority tests in one-sample designs in which the outcome is distributed as a normal random
Background and Development
 Overview The RIASEC Inventory is designed to help people identify their most dominant work interests and then use this information to explore career options. It uses the RIASEC coding system developed
II. DISTRIBUTIONS distribution normal distribution. standard scores
 Appendix D Basic Measurement And Statistics The following information was developed by Steven Rothke, PhD, Department of Psychology, Rehabilitation Institute of Chicago (RIC) and expanded by Mary F. Schmidt,
AP STATISTICS 2010 SCORING GUIDELINES
 2010 SCORING GUIDELINES Question 4 Intent of Question The primary goals of this question were to (1) assess students ability to calculate an expected value and a standard deviation; (2) recognize the applicability
BA 275 Review Problems - Week 5 (10/23/06-10/27/06) CD Lessons: 48, 49, 50, 51, 52 Textbook: pp. 380-394
 CD Lessons: 48, 49, 50, 51, 52 Textbook: pp. 380-394") BA 275 Review Problems - Week 5 (10/23/06-10/27/06) CD Lessons: 48, 49, 50, 51, 52 Textbook: pp. 380-394 1. Does vigorous exercise affect concentration? In general, the time needed for people to complete
BA 275 Review Problems - Week 5 (10/23/06-10/27/06) CD Lessons: 48, 49, 50, 51, 52 Textbook: pp. 380-394 1. Does vigorous exercise affect concentration? In general, the time needed for people to complete
The value of apprenticeships: Beyond wages
 The value of apprenticeships: Beyond wages NIDA BROUGHTON June 2016 There is strong political commitment to the apprenticeships programme as a part of the strategy to achieve a high quality workforce that
Math 251, Review Questions for Test 3 Rough Answers
 Math 251, Review Questions for Test 3 Rough Answers 1. (Review of some terminology from Section 7.1) In a state with 459,341 voters, a poll of 2300 voters finds that 45 percent support the Republican candidate,
Tutorial for proteome data analysis using the Perseus software platform
 Tutorial for proteome data analysis using the Perseus software platform Laboratory of Mass Spectrometry, LNBio, CNPEM Tutorial version 1.0, January 2014. Note: This tutorial was written based on the information
Chapter 5 Transfer Pricing Methods
 Agenda Item 5 Working Draft Chapter 5 Transfer Pricing Methods [This paper is based on a paper prepared by Members of the UN Tax Committee s Subcommittee on Practical Transfer Pricing Issues, but includes
Imputation and Analysis. Peter Fayers
 Missing Data in Palliative Care Research Imputation and Analysis Peter Fayers Department of Public Health University of Aberdeen NTNU Det medisinske fakultet Missing data Missing data is a major problem
AP: LAB 8: THE CHI-SQUARE TEST. Probability, Random Chance, and Genetics
 Ms. Foglia Date AP: LAB 8: THE CHI-SQUARE TEST Probability, Random Chance, and Genetics Why do we study random chance and probability at the beginning of a unit on genetics? Genetics is the study of inheritance,
Financial capability and saving: Evidence from the British Household Panel Survey
 CRS02 NOVEMBER 2010 Financial capability and saving: Evidence from the British Household Panel Survey About the Consumer Financial Education Body The Consumer Financial Education Body (CFEB) is an independent
HYPOTHESIS TESTING (ONE SAMPLE) - CHAPTER 7 1. used confidence intervals to answer questions such as...
 - CHAPTER 7 1. used confidence intervals to answer questions such as...") HYPOTHESIS TESTING (ONE SAMPLE) - CHAPTER 7 1 PREVIOUSLY used confidence intervals to answer questions such as... You know that 0.25% of women have red/green color blindness. You conduct a study of men
HYPOTHESIS TESTING (ONE SAMPLE) - CHAPTER 7 1 PREVIOUSLY used confidence intervals to answer questions such as... You know that 0.25% of women have red/green color blindness. You conduct a study of men
Non-random/non-probability sampling designs in quantitative research
 206 RESEARCH MET HODOLOGY Non-random/non-probability sampling designs in quantitative research N on-probability sampling designs do not follow the theory of probability in the choice of elements from the
Application in Predictive Analytics. FirstName LastName. Northwestern University
 Application in Predictive Analytics FirstName LastName Northwestern University Prepared for: Dr. Nethra Sambamoorthi, Ph.D. Author Note: Final Assignment PRED 402 Sec 55 Page 1 of 18 Contents Introduction...
Power Analysis for Correlation & Multiple Regression
 Power Analysis for Correlation & Multiple Regression Sample Size & multiple regression Subject-to-variable ratios Stability of correlation values Useful types of power analyses Simple correlations Full
Social Studies 201 Notes for November 19, 2003
 1 Social Studies 201 Notes for November 19, 2003 Determining sample size for estimation of a population proportion Section 8.6.2, p. 541. As indicated in the notes for November 17, when sample size is
Spreadsheet Analysis for Portfolio Optimization
 Spreadsheet Analysis for Portfolio Optimization Bob Smithson Anava Capital Management LLC 408-918-9333 Please Note: Individual companies shown or discussed in this presentation have been used as examples
The Margin of Error for Differences in Polls
 The Margin of Error for Differences in Polls Charles H. Franklin University of Wisconsin, Madison October 27, 2002 (Revised, February 9, 2007) The margin of error for a poll is routinely reported. 1 But
Name: (b) Find the minimum sample size you should use in order for your estimate to be within 0.03 of p when the confidence level is 95%.
 Find the minimum sample size you should use in order for your estimate to be within 0.03 of p when the confidence level is 95%.") Chapter 7-8 Exam Name: Answer the questions in the spaces provided. If you run out of room, show your work on a separate paper clearly numbered and attached to this exam. Please indicate which program
Chapter 7-8 Exam Name: Answer the questions in the spaces provided. If you run out of room, show your work on a separate paper clearly numbered and attached to this exam. Please indicate which program
DESCRIPTIVE STATISTICS. The purpose of statistics is to condense raw data to make it easier to answer specific questions; test hypotheses.
 DESCRIPTIVE STATISTICS The purpose of statistics is to condense raw data to make it easier to answer specific questions; test hypotheses. DESCRIPTIVE VS. INFERENTIAL STATISTICS Descriptive To organize,
Introduction to. Hypothesis Testing CHAPTER LEARNING OBJECTIVES. 1 Identify the four steps of hypothesis testing.
 Introduction to Hypothesis Testing CHAPTER 8 LEARNING OBJECTIVES After reading this chapter, you should be able to: 1 Identify the four steps of hypothesis testing. 2 Define null hypothesis, alternative
Friedman's Two-way Analysis of Variance by Ranks -- Analysis of k-within-group Data with a Quantitative Response Variable
 Friedman's Two-way Analysis of Variance by Ranks -- Analysis of k-within-group Data with a Quantitative Response Variable Application: This statistic has two applications that can appear very different,
Introduction to Analysis of Variance (ANOVA) Limitations of the t-test
 Limitations of the t-test") Introduction to Analysis of Variance (ANOVA) The Structural Model, The Summary Table, and the One- Way ANOVA Limitations of the t-test Although the t-test is commonly used, it has limitations Can only
Introduction to Analysis of Variance (ANOVA) The Structural Model, The Summary Table, and the One- Way ANOVA Limitations of the t-test Although the t-test is commonly used, it has limitations Can only
Chapter Seven. Multiple regression An introduction to multiple regression Performing a multiple regression on SPSS
 Chapter Seven Multiple regression An introduction to multiple regression Performing a multiple regression on SPSS Section : An introduction to multiple regression WHAT IS MULTIPLE REGRESSION? Multiple
Standard Deviation Estimator
 CSS.com Chapter 905 Standard Deviation Estimator Introduction Even though it is not of primary interest, an estimate of the standard deviation (SD) is needed when calculating the power or sample size of