Long-distance pollen transport from North America to Greenland in spring
|
|
|
- Joleen Bailey
- 8 years ago
- Views:
Transcription

1 Long-distance pollen transport from North America to Greenland in spring Denis-Didier Rousseau, Patrick Schevin, Jackie Ferrier, Dominique Jolly, Tore Andreasen, Svend Erik Ascanius, Svend-Erik Hendriksen, Ulrik Poulsen To cite this version: Denis-Didier Rousseau, Patrick Schevin, Jackie Ferrier, Dominique Jolly, Tore Andreasen, et al.. Long-distance pollen transport from North America to Greenland in spring. Journal of Geophysical Research Biogeosciences, 00, sous presse. <hal-00> HAL Id: hal-00 Submitted on Mar 00 HAL is a multi-disciplinary open access archive for the deposit and dissemination of scientific research documents, whether they are published or not. The documents may come from teaching and research institutions in France or abroad, or from public or private research centers. L archive ouverte pluridisciplinaire HAL, est destinée au dépôt et à la diffusion de documents scientifiques de niveau recherche, publiés ou non, émanant des établissements d enseignement et de recherche français ou étrangers, des laboratoires publics ou privés.

2 Long-distance pollen transport from North America to Greenland in spring Denis-Didier Rousseau 1,, Patrick Schevin, Jackie Ferrier, Dominique Jolly, Tore Andreasen, Svend Erik Ascanius, Svend-Erik Hendriksen, and Ulrik Poulsen 1 Ecole Normale Supérieure, Laboratoire de Modélisation Dynamique, UMR CNRS, rue Lhomond, 1 Paris cedex, France Lamont-Doherty Earth Observatory of Columbia University, Palisades, NY, USA Université Montpellier II-CNRS, Institut des Sciences de l'evolution, place Eugène Bataillon, 0 Montpellier cedex 0, France Danish Radio-Sonde Station, DK - 0 Ittoqqortroormitt, Greenland Danish Meteorological Institute (DMI), DK - 1 Qaanaaq, Greenland Danish Meteorological Institute (DMI), DK - Kangerlussuaq, Greenland Danish Radio-Sonde Station, DK - Narsarsuaq, Greenland to whom correspondence should be addressed; denis.rousseau@lmd.ens.fr 1
, DK - 1 Qaanaaq, Greenland Danish Meteorological Institute (DMI), DK - Kangerlussuaq, Greenland Danish Radio-Sonde Station, DK -")
3 1 Abstract [1] In the Arctic domain there is evidence for very long distance transport of pollen grains from boreal forests to tundra environments. However, the sampling protocol used in earlier studies did not allow the determination of the precise timing of the deposition of exotic grains. The ongoing "Epilobe" project monitors the deposition of exotic grains on both western and eastern coasts of Greenland utilizing wind filters, which are changed weekly throughout the entire year. A combination of the identification of tree pollen grains, the dates of deposition of the pollen on the filters, and the distribution map of the trees identified, allows the selection of modeled backward trajectories of air parcels responsible for the capture of the grains in the growing area of northeastern North America, and their long distance transport to Greenland. A survey of data obtained from four stations, analyzed during 00 and 00, indicates the occurrence of a general pattern, every spring, which follows the main cyclone tracks reaching this Arctic region.

4 Introduction [] Pollen transport is a crucial topic as it has a strong societal impact, especially when considering allergies[guérin, et al., ; Michel, et al., 1]. For decades, aerobiologists investigated this particular aspect of plant phenology, which eventually led to modeling [Chuine and Belmonte, 00; Ranzi, et al., 00] the particular relationship between pollen emission and temperature variations [Cambon, 10; Cour, 1; Palacios, et al., 00]. To accomplish this, therefore the biologists had to consider not only the local pollen dissemination but also a more complex process, involving some transport, especially wind blown material. Besides societal concern [Michel, et al., 1], the same preoccupations are faced by ecologists in terms of understanding the large scale transportation and deposition of exotic grains [Porsbjerg, et al., 00], i.e. pollen grains released by plants which are not growing in the studied region [Peternel, et al., 00; Smith, et al., 00]. Such investigations in temperate regions are much more difficult to carry out [Hicks, 1], because usually pollen is identified mostly at the generic level, except if particular pollen is easily distinguished, i.e. from tropical or subtropical trees [Cambon, et al., 1]. However, such tasks are much easier in the higher latitudes where the vegetation is greatly reduced and less diverse. Therefore, in high latitudes, the patterns of long-distance transport can be easily observed [Andrews, et al., 10; Bourgeois, et al., 1; Campbell, et al., 1; Franzen, et al., 1; Gajewski, 1; Hicks, et al., 001; Hjelmroos and Franzen, 1; Jacobs, et al., 1; Janssen, 1; Nichols, 1; Ritchie, 1; Ritchie and Lichti-Federovich, 1; Ritchie, et al., 1; Short and Holdsworth, 1]. In understanding the very long-range transport of pollen grains, most of which range from 1-0 microns, except for the larger bisaccate grains of conifer, bigger than a few microns, they can be considered as aerosol components [Hicks and Isaksson, 00; Prospero, et al., 00]} and a proxy indicator for more general atmospheric circulation [Fraile, et al., 00; Tunved, et al., 00]. [] Analysis of long distance transport of tree pollen to Narsarsuaq, Southern Greenland, in 00 and 00 [00; 00; Rousseau, et al., 00] indicated that eastern North America, south of the Great Lakes was the source region. The timing of the deposition regularly occurred during the second half of May but the air mass trajectories differed. On the other hand, long distance transport to the North Pole in 00 was found to have originated from Western Europe and
![, 00] the particular relationship between pollen emission and temperature variations [Cambon, 10; Cour, 1; Palacios, et al., 00]. To accomplish this, therefore the biologists had to consider not only the local pollen dissemination but also a more complex process, involving some transport, especially wind blown material.](/docs-images/45/2347980/images/page_4.jpg "Besides societal concern [Michel, et al.")
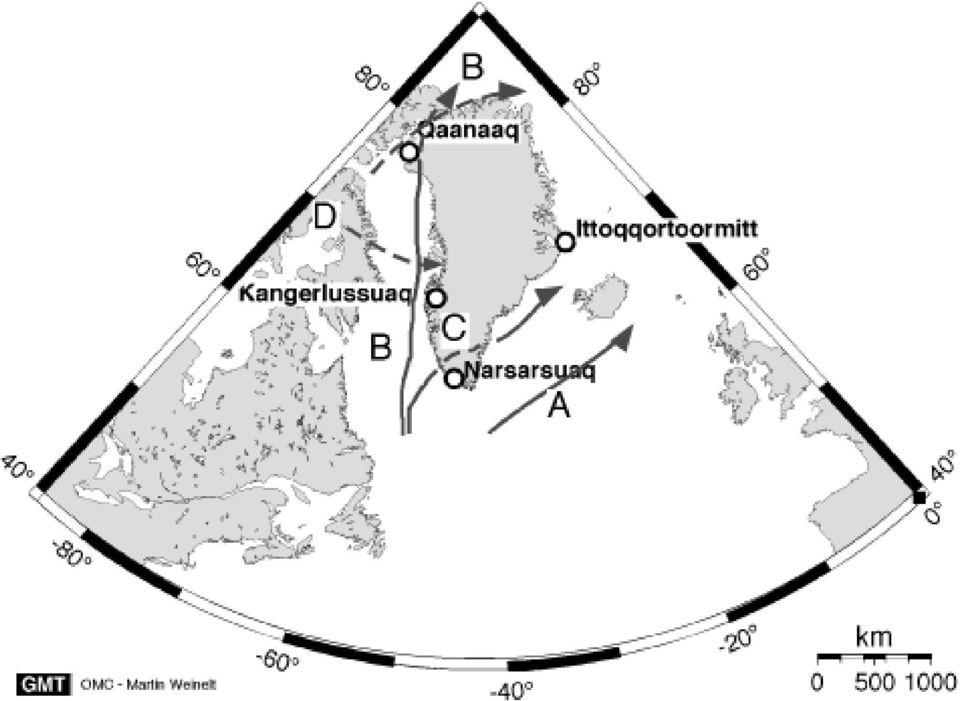
5 Eastern Siberia [Rousseau, et al., 00]. These were the first analyses to develop a complete description of the transport from the source area to the deposition site, characterizing the air masses responsible, and detailing the timing of the capture and deposition of the grains. Previous sampling in the Arctic region had demonstrated the occurrence of long distance pollen transport, but samples taken from snow or ice layers were limited to seasonal resolution, i.e. late winter/spring snow and in the summer melt layers [Bourgeois, et al., 1; Bourgeois, et al., 001; Hicks, et al., 001; Ritchie, 1; Ritchie and Lichti-Federovich, 1]. Other published data from fossil pollen records has led to assumptions about averaged trajectories. These studies did not allow for the precise description of long distance transport to the Arctic, due to annual sampling, which made the identification uncertain of the source of exotic pollen grains [Bourgeois, et al., 1; Bourgeois, et al., 001; Hicks, et al., 001; Ritchie, 1; Ritchie and Lichti-Federovich, 1]. [] Because we are currently limited to four sampling sites, the general transport pattern for the entire island of Greenland cannot be identified. In order to improve our understanding, a network of pollen stations is required all along the western and eastern coasts. At present it is not possible to locate sampling stations on the ice sheet. With an increased sampling network and continued monitoring, a much more reliable scenario for further modeling experiments will be possible. Nevertheless, the long distance pollen transport reported here from four stations with weekly resolution for the spring of 00 and 00 adds significantly to our understanding of circulation patterns from northeastern North America to Greenland.. Material and methods [] Within the "EPILOBE" (French name of willowweed, Epilobium, the national flower of Greenland) project, four pollen sites, each with two filters exposed to the wind, were installed on the western (Narsarsuaq 1.1 N,. W; Kangerlussuaq, N, 0. W; Qaanaaq,. N,. W) and eastern (Ittoqqortoormitt, 0. N, 1. W) coasts of Greenland. They are situated within a maximum of m from a meteorological station (Figure 1) and except in Kangerlussuaq, the pollen stations are located next to the sea. The interest in having a rotating frame on which the filters are placed is that it also collects the pollen from the local vegetation, if present.. The same collection protocols are used at each station and the pollen is acquired

6 throughout the year. One filter is changed weekly and the second fortnightly. The x cm filters are composed of several crossed bands of gauze bathed in a siliconed glue and set in a plastic framework. Half of each filter is processed for pollen extraction and the other half retained for future analysis. The yearly survey of the pollen occurrence is recorded for all four localities yielding a very precise record of the local vegetation, timing of pollen deposition, and also evidence for seasonal transport of exotic grains [00; 00; Rousseau, et al., 00]. Previous studiesin the Arctic mainly reported yearly observations of pollen flux [Ritchie and Litchi- Federovich, 1, Ritchie, 1, Bourgeois et al., 1, 001; Hicks et al., 001]. [] Before the pollen stations were installed (Figure ), ground samples in their vicinity were collected and analyzed. A few exotic pollen grains were identified, mainly pine (Pinus) at Kangerlussuaq, and oak (Quercus) at Narsarsuaq, indicating long-distant transport to these remote stations. However, since the the surface samples were taken more inland than that of the pollen stations, mostly close to the sea, we are confident that the grains identified in the filters are not reworked ones.. Only the results from fortnightly filters showing exotic grains are reported here. Using the dates of the filter exposures, backward air mass trajectories are then computed for every day in the two week period using the HYSPLIT on-line application [Draxler and Hess, 1; H Y S P L I T M o d e l, 1], model details can be found at ( The potential trajectories are selected to explain the observed long distance transport considering the probable dates of pollen emission and the dates of the air mass passing over the region of growing trees specific to the identified pollen captured at the Greenland sites [Thompson, et al., 1a; b]. Numerous computations were performed for a single day, with noon chosen as the most representative of the different times. We introduced the coordinates of the filters as our targets and thus when exotic grains were identified in the filters, trajectories were computed for the total time interval during which the filters were exposed, i.e. 1 days. In the first step, days were selected which corresponded to backward trajectories passing over the growing area, including all the trees producing the observed pollen. In a second step, we considered the elevation at which air parcels were passing over the determined area, rejecting those passing too high. Finally we considered the vertical motion, a very important factor, associated with the potential air mass: if upward motion existed for favoring the convection of the grains, and similarly if downward motion was present at the target location, then we selected the considered computation. By using this protocol it allowed us to considerably constrain the selection of the potential "candidates among all the computations

7 performed.[] Although the long distance transport was initially determined for Narsarsuaq [00; Rousseau, et al., 00], here we report on the stations operating in 00 and 00 which also show evidence of long distance transport whose source region can be identified.. Results.1 Pollen counts (Tab. 1) [] At Qaanaaq in 00, the filter exposed during weeks 1-1 (- April) recorded exotic grains ( oak Quercus, pine -Pinus, plane -Platanus, and 1 hornbeam Carpinusand walnut Juglans, respectively) out of a total of grains. This indicates that the majority of transported pollen grains corresponding to.% of the total counted, was exotic. [] At Kangerlussuaq in 00, the filter exposed during weeks 1 and 0 (-1 May) recorded 1 exotic grains ( oak - Quercus, hazel Corylus- and hops Humulus, pine - Pinus, and 1 plane - Platanus) among a total of 0 identified grains. This is a considerably less (.%) than in Qaanaaq. Indeed, the local vegetation in Kangerlussuaq is more abundant, consisting ofshrub tundra, composed of birch (Betula), juniper (Juniperus), and willow (Salix). [] At Narsarsuaq, where evidence of long distance transport has been reported [00; 00; Rousseau, et al., 00]., only exotic grains ( pine - Pinus, oak - Quercus, 1 fir - Abies, hazel - Corylus, walnut Juglans - and hornbeam - Carpinus, respectively) in over grains were identified for weeks 1-0 (-1 May, 00). This corresponds to an even smaller percentage,.%, compared to the two other west coast stations which are located further north. The local tundra vegetation surrounding the meteorological station is represented by birch (Betula), horsetail, willow (Salix), alder (Alnus), heath (Erica) and genera in the sedge family (Cyperaceae). [] On the eastern coast, at Ittoqqortoormitt in 00, the filter exposed during weeks - (1- June) recorded exotic grains ( pine - Pinus - and oak - Quercus, 1 chestnut (Castanea) and beech - Fagus) in 1 grains. This is the lowest percentage, 0.% out of the four stations. As in Qaanaaq, the local vegetation is very sparse and reduced to dwarf plants. [] The record is different for the exotic pollen grains transported in 00. Two stations,
![1) [] At Qaanaaq in 00, the filter exposed during weeks 1-1 (- April) recorded exotic grains ( oak Quercus, pine -Pinus, plane -Platanus, and 1 hornbeam Carpinusand walnut Juglans, respectively) out](/docs-images/45/2347980/images/page_7.jpg "of a total of grains. This indicates that the majority of transported pollen grains corresponding to.% of the total counted, was exotic.")
8 Kangerlussuaq and Qaanaaq, indicated only the transport of pine grains, which substantially differs from the results of the previous year. As pine is highly transportable and found nearly everywhere, trajectories were not calculated for these stations in 00. [] Conversely in Narsarsuaq, exotic pollen was identified during weeks 0-1 (May 1- ) with grains each of hornbeam - Carpinus - and walnut - Juglans, 1 each of chestnut - Castanea, pine Pinus - and elm - Ulmus, representing 0.% of the total 1 grains. The filter exposed during weeks 1-1 ( April - May) in Ittoqqortoormitt yielded exotic pollen grains out of counted, (0.%) corresponding to grains of oak - Quercus, pine - Pinus, 1 plane - Platanus - and 1 hickory - Carya. This is a considerably higher percentage of exotic grains compared to the 00 record. Most notable is the occurrence of hickory, which is solely a North American tree [Thompson, et al., 1a; b]. [1] Out of six cases in 00 and 00, the deposition of exotic pollen grains in the filters occurred half the time between weeks 1 and 1. With the exception of the east coast station in 00 where exotic grains were registered during weeks -, deposition occurred in nearly all cases between weeks 1 and 1. These findings are in agreement with the time of pollination (weeks 1 to 1) determined for the various trees species at four different stations in Southern Ontario, Canada, [Cambon, 1; Cambon, et al., 1]. One interesting feature of the data is that the southernmost station, Narsarsuaq, recorded long distance pollen transport in variable proportions during these two additional years of our experiment, yet reproduced similar observations to the earlier studies. Indeed, in 00, among 1 grains counted, only 1 (0.%) were from exotic plants while one year later, among grains counted, (.%) originated from different exotic trees [00; 00; Rousseau, et al., 00],. [1] A large degree of variability in both the diversity and abundance is demonstrated between stations within a given year as well as from year-to-year for any single station. Pollen diversity was greater in 00 than in 00. While not directly addressed by this study, further investigations in temperature conditions prevailing the source area may have to be conducted as well as meteorological conditions during the transport itself.. Backward trajectories [1] Backward air mass trajectories have been calculated at h intervals, for 1 hours of
![[] Conversely in Narsarsuaq, exotic pollen was identified during weeks 0-1 (May 1- ) with grains each of hornbeam - Carpinus - and walnut - Juglans, 1 each of chestnut - Castanea, pine Pinus - and](/docs-images/45/2347980/images/page_8.jpg "elm - Ulmus, representing 0.% of the total 1 grains. The filter exposed during weeks 1-1 ( April - May) in Ittoqqortoormitt yielded exotic pollen grains out of counted, (0.")
9 the 1 days of the fortnight records of exotic pollen grains. As in previous studies [00; 00; Rousseau, et al., 00], three altitudes were investigated; ground level, 00 and 000 meters. As air parcels change altitude with time, these altitudes designate their respective level at the time of pollen deposition in Greenland. For each station, the computed trajectories were then compared with the compiled distribution of trees to check whether the source area consisted of tree types consistent with the exotic pollen grains. [1] Given these air mass trajectories the most probable dates for the exotic pollen to arrive at the different sampling stations can be summarized as follows: [1] In 00, exotic pollen deposited in Qaanaaq on April 1 (Figure ), corresponded to the transport of pollen grains captured in the source area on April and. In Kangerlussuaq, the exotic pollen deposited on May (Figure ), were captured on May in the growing area. The transport of exotic pollen grains to Narsarsuaq ended on May (Figure ); they were deposited over the source area on May and. Finally, exotic pollen arrived at Ittoqqortoormitt on June 1, which corresponded to grains captured between June - by an air mass passing over the eastern coast of Greenland. The latter date appears to be the most probable as the earlier ones are related to very low air mass elevations (Figure ). In each case deposition occurred from an air mass flowing at 000 m over the Greenland stations. [1] In 00, exotic pollen deposited at Narsarsuaq on May 1, were captured on May in the emission area of the northeastern United States (Figure ). The transport of the exotic grains, among them hickory which is strictly a North American tree, to Ittoqqortoormitt occurred on April (Figure ). The pollen grains were advected into the atmosphere from the source region on April 1. [0] The air masses responsible for the transport of the exotic grains over the sampling stations are consistently at a 000 m elevation. However, when the air mass is passing over the source areas of the trees, the elevation is much lower permitting the capture of enough grains to be subsequently transported by this higher altitude air mass, and recorded at our stations over Greenland. Such a pattern has already been reported for similar long-distance transport to Narsarsuaq in 00 and 00 for grains characteristics of US trees, as well as to the North Pole in 00 for pollen released by European trees [00; 00; Rousseau, et al., 00],... Discussion

10 [1] Two groups according to the altitude of the capture of the exotic grains can be distinguished. The first group refers to air parcels between 00 and 000 m over the source region as is the case for Qaanaaq and Kangerlussuaq in 00, and Narsarsuaq and Ittoqqortoormitt in 00. The second group consists of air parcels below 00 m passing over the source area, which occurred in the transport to Narsarsuaq and Ittoqqortoormitt in 00. [] The timing of the capture of the pollen grains at these stations occurred between mid- April and mid-june. This finding is in agreement with the emission interval that Cambon [Cambon, 1; Cambon, et al., 1] determined in her yearly surveys of the pollen emission around Toronto, Ontario. The quantity of exotic grains is relatively low except in Qaanaaq. The duration of the transport is unlikely to be responsible for the low number of grains collected at the other stations as the time taken is similar in the majority of cases. Several factors have been invoked to explain variations in pollen grains on the filters ([Rousseau, et al., 00]. First, according to previous investigations on the northern growth limit of these trees, the maximum pollen emission varies between trees (Cambon, 1, 1; Cambon et al., 1), leading to the differential release of diverse pollen types into the atmosphere. For example, while oak (Quercus) mostly flowers between the second half of April until mid-june, with a maximum earlier, hornbeam (Carpinus) flowers between the end of May until mid June Thus, in Qaanaaq, such difference in the timing of pollen emission could explain partly the observed variations between the two taxa. Second, the meteorological conditions for pollen capture may have been less favorable during this particular time leading to a reduction in pollen transport (weak upward air motion). The comparison of the upward intensity during the capture interval as indicated by the red boxes shows such diverse conditions (Fig. c-c) the strongest upward motion occurs during the transport to Kangerlussuaq in 00 (Fig. c). Third, even given favorable conditions for pollen capture, downward air motion at the filter location could be highly variable. Moreover, the reconstructed air velocity diagrams plotted in figures c to c show that the strength of the downdrafts of the atmosphere varied not only from place to place but also from one year to another. Fourth, washout by rain during the transport to Greenland associated with turbulence effects, could result in a large reduction in the number of pollen grains remaining in the air parcel reaching Greenland. This is also shown in the velocity diagrams, which provide evidence for severe downdrafts of the atmosphere, for example, during the transport to Narsarsuaq in 00 and 00 (Fig. c and c), Ittoqqortoormitt in 00 and 00 (Fig. c and c). [] A comparison of the results obtained for the western coast of Greenland in 00 shows differences in the number and type of exotic grains. The total of grains transported varies

11 between and. The duration of transport is - days, dates of deposition occur in mid April or May while the exotic grains are captured from the source region around the beginning of the month. In contrast, the east coast station has a total of 1 pollen grains with dates of capture and deposition delayed until June. [] When comparing the results obtained from one year to another at Ittoqqortootmitt, the capture and deposition dates differ by two months, while the total grains deposited are an order of magnitude larger in 00. Indeed, although exotic pollen reaches the different stations on the coasts of Greenland, the identified trees vary from place to place, from one year to another, and the pattern of the air masses responsible for the transport varies as does the timing and the quantity of transported grains. In the later case, the amount of pollen grains deposited on the filters is linked mostly to the local production in the source area. Yearly pollen monitoring along a north south transect in Western Europe indicated that pollen production depends largely on temperatures affecting the trees during the year prior to pollination [Cour, et al., ]. The deposited quantity also depends on the different conditions that prevailed during transport in the air mass affecting the preservation of the grains. Marked reduction in the abundance can occur during transport due to losses via washout by precipitation [Barry, et al., 11]. The observed counts in Narsarsuaq in both 00 () and 00 () are similar compared to those reported in 00 (1), despite a much lower percentage of exotic grains out of the total identified. This is totally different to the values published for 00, which indicated exotic grains out of 0, [] Considering the airmass loops, their paths indeed reflect the influence of depression passing over a certain place, thus complicating the computation of the trajectories. Chen et al. [Chen, et al., 1] concluded that frontal cyclones were the main meteorological system responsible for the precipitation regime over Greenland. They identified three main regions according to precipitation amounts and also distinguished the possible effects of the relief on moving cyclones. Interestingly, a comparison of these regions with our trajectories shows some similarities. [] The first area they identified is from South Greenland north to N. Cyclones passing close to the southwest coast of Greenland or Cape Farewell are responsible for heavy precipitation over this area, and can induce lee cyclogenesis on the eastern coast. The second region is located northward of the southern region and referred to as the Central region. This area has an important blocking effect on cyclones moving from west to east. The third region is

12 located to the north of 0 N, where few cyclones influence this region during summer. They reported that the majority of precipitation over Greenland occurs in the southern region, peaking in winter and spring [Chen, et al., 1]. Thus, the dominance of the Labrador Sea and Icelandic cyclones determines the amount of precipitation over Greenland. Based on the location of the cyclone centers, they then determined five classes of cyclone tracks around Greenland (Figure 1). Track A is related to sea-level circulation, dominated by the Icelandic low. Track B is a major storm track into Baffin Bay from the south and from Hudson Bay. Track C corresponds to cyclones moving across the southern part of the Greenland ice-sheet and moving through the Denmark Strait. These three groups represent the three main tracks of the cyclone activity over Greenland. Tracks B and C are related to high precipitation over the southern region. Track D represents the cyclones approaching Greenland from the west which form during summer when polar and arctic front jets move northward. Track E characterizes cyclones formed in Baffin Bay moving northward and causing precipitation over the north coastal region. These latter two tracks are considered secondary. This characterization of cyclonic activity over Greenland fits with our pollen observations at the four stations installed on the both western and eastern coasts of Greenland. The observations of exotic pollen in Narsarsuaq, Kangerlussuaq and even Qaanaaq seem to be related to Track B cyclones, with a probable Track E effect in Qaanaaq. The results obtained in Ittoqqortoormitt, especially in 00, indicate the influence of Track C. This pattern of the cyclone activity responsible for the precipitation regime, lends support as to why long distance pollen transport from North America to Greenland is observed in association with wet deposition.. Conclusion [] Our results show that various air mass trajectories transported exotic pollen grains to Greenland from Northeastern America following the major cyclone tracks, which are responsible for the precipitation regime over Greenland. These air parcels are at different altitudes leading to more complex modeling than originally expected or previously recorded. The patterns of the trajectories are different from one week to another, from one year to another and also from one locality to another. Further experiments and continued monitoring are needed to assess the variability and to validate the potential usefulness of such results for paleoclimatic studies.
.")
13 Indeed as models of pollen dispersion and transport become more available and reliable on local or regional scales [Helbig, et al., 00], modeling transport over longer distances of several thousands kilometers will require more sophisticated parameterizations as our results clearly show, in order to fully understand the general atmospheric curculation involved [] Acknowledgements. We would like to thank anonymous reviewers for comments, Joyce Gavin and Alex- Chepstow-Lusty for discussions and extensive editing of this paper. This research is supported by a grant from the French Polar Institute Paul-Emile Victor (IPEV) and the help of the local operator, even among the co-authors, is greatly appreciated. This is LDEO yyy. References Andrews, J. T., W. N. Mode, and P. T. Davis (10), Holocene climate based on pollen transferfunctions, Eastern Canadian Arctic, Arctic and Alpine Research,, 1-. Barry, R. G., D. L. Elliott, and R. G. Crane (11), The palaeoclimatic interpretation of exotic pollen peaks in Holocene records from the eastern Canadian Arctic: a discussion, Rev. Palaeobot. Palynol.,, -1. Bourgeois, J. C., R. M. Koerner, and J. C. Alt (1), Airborne pollen: A unique air mass tracer, its influx to the Canadian high Arctic., Ann. Glaciol.,, -. Bourgeois, J. C., K. Gajewski, and R. M. Koerner (001), Spatial patterns of pollen deposition in arctic snow, J. Geophys. Res., (D), -. Cambon, G. (10), Dispersion aéroplanctonique et climats: variations latitudinales des spectres polliniques de l'atmosphère en Méditerranée occidentale., Mem. Mus. Nat. Hist. Nat. Paris, serie B,, -. Cambon, G. (1), Modern pollen spectra and vegetation in southern Ontario, Canada., Rev. Palaeobot. Palynol.,, 1-1. Cambon, G., J. C. Ritchie, and P. Guinet (1), Pollen marqueur de transports à longue distance dans l'atmosphère du sud de l'ontario (Canada), Canadian J. Botany, 0, -. Campbell, I. D., K. McDonald, M. Flannigan, and J. Kringayark (1), Long-distance transport of pollen into the Arctic, Nature,, -0. Chen, Q. S., D. H. Bromwich, and L. S. Bai (1), Precipitation over Greenland retrieved by a dynamic method and its relation to cyclonic activity, J. Climate,, -0. Chuine, I., and J. Belmonte (00), Improving prophylaxis for pollen allergies: Predicting the time
![atmospheric curculation involved. 1 1 1 1 1 1 0 1 0 1 [] Acknowledgements.](/docs-images/45/2347980/images/page_13.jpg "We would like to thank anonymous reviewers for comments, Joyce Gavin and Alex- Chepstow-Lusty for discussions and extensive editing of this paper.")
14 course of the pollen load of the atmosphere of major allergenic plants in France and Spain, Grana,, -0. Cour, P. (1), Nouvelles techniques de détection des flux et des retombées polliniques: Etude de la sédimentation des pollens et des spores à la surface du sol, Pollen et Spores, 1, -11. Cour, P., G. Cambon, J. Ferrier, D. Duzer, L. Janzon, L. Quet, Y. Loublier, J. Olivier, and R. Gros (), Calendriers polliniques de l'europe occidentale, région méditerranéenne comprise, in Pollen et allergies, edited by Guérin, B., J. Bousquet, P. Cour, Evrard, F. Guérin, N. Nolard, G. Peltre and Y. Sell, pp. -0, Allerbio, Varennes-en-Argonne. Draxler, R. R., and G. D. Hess (1), An overview of the Hysplit_ modelling system for trajectories, dispersion and deposition, Australian Met. Mag.,, -0. Fraile, R., A. I. Calvo, A. Castro, D. Fernandez-Gonzalez, and E. Garcia-Ortega (00), The behavior of the atmosphere in long-range transport, Aerobiologia,, -. Franzen, L. G., M. Hjelmroos, P. Kallberg, E. Brorstromlunden, S. Juntto, and A. L. Savolainen (1), The yellow-snow episode of Northern Fennoscandia, March-11. A case-study of long-distance transport of soil, pollen and stable organic-compounds, Atmosph. Env.,, - 0. Gajewski, K. (1), Modern and Holocene pollen assemblages from some small Arctic lakes on Somerset Island, NWT, Canada, Quat. Res.,, -. Guérin, B., J. Bousquet, P. Cour, Evrard, F. Guérin, N. Nolard, G. Peltre, and Y. Sell (Eds.) (), Pollen et allergies, pp., Allerbio, Varennes-en-Argonne. Helbig, N., B. Vogel, H. Vogel, and F. Fiedler (00), Numerical modelling of pollen dispersion on the regional scale, Aerobiologia,, -1. Hicks, S. (1), Modern pollen deposition records from Kuusamo, Finland, Grana,, 1-1. Hicks, S., and E. Isaksson (00), Assessing source areas of pollutants from studies of fly ash, charcoal, and pollen from Svalbard snow and ice, J. Geophys. Res., 1, D0, doi:./00jd001. Hicks, S., H. Tinsley, A. Huusko, C. Jensen, M. Hättestrand, A. Gerasimides, and E. Kvavadze (001), Some comments on spatial variation in arboreal pollen deposition: first records from the Pollen Monitoring Programme (PMP), Rev. Palaeobot. Palynol.,, 1-1. Hjelmroos, M., and L. G. Franzen (1), Implications or recent long-distance pollen transport events for the interpretation of fossil pollen records in Fennoscandia, Rev. Palaeobot. Palynol.,
, Calendriers polliniques de l'europe occidentale, région méditerranéenne comprise, in Pollen et allergies, edited by Guérin, B., J. Bousquet, P. Cour, Evrard, F. Guérin, N. Nolard, G.")
15 , 1-1. HYSPLITModel (1), (HYbrid Single-Particle Lagrangian Integrated Trajectory) NOAA Air Resources Laboratory, Silver Spring, MD. Jacobs, J. D., W. N. Mode, and E. K. Dowdeswell (1), Contemporary pollen deposition and the distribution of Betula glandulosa at the limit of low arctic tundra in Southern Baffin Island, Nwt, Canada, Arctic and Alpine Res., 1, -. Janssen, C. R. (1), Local and regional pollen deposition, in Quaternary plant Ecology, edited by Birks, J. H. B. and R. G. West, pp. 0-, Blackwell Scientific, Oxford. Michel, F. B., P. Cour, L. Quet, and J. P. Marty (1), Qualitative and quantitative comparison of pollen calendras for plain and mountain areas, Clin. Allergy,, -. Nichols, H. (1), Pollen diagrams from Sub-Arctic Central Canada, Science, 1, 1-1. Palacios, I. S., R. T. Molina, and A. F. M. Rodriguez (00), The importance of interactions between meteorological conditions when interpreting their effect on the dispersal of pollen from homogeneously distributed sources, Aerobiologia,, 1-. Peternel, R., J. Culig, I. Hrga, and P. Hercog (00), Airborne ragweed (Ambrosia artemisiifolia L.) pollen concentrations in Croatia, 00-00, Aerobiologia,, -1. Porsbjerg, C., A. Rasmussen, and A. Backer (00), Airbone pollen in Nuuk, Greenland, and the importance of meteorological parameters, Aerobiologia, 1, -. Prospero, J. M., E. Blades, G. Mathison, and R. Naidu (00), Interhemispheric transport of viable fungi and bacteria from Africa to the Caribbean with soil dust, Aerobiologia, 1, 1-1. Ranzi, A., P. Lauriola, V. Marletto, and F. Zinoni (00), Forecasting airbone pollen concentrations: Development of local models, Aerobiologia, 1, -. Ritchie, J. C. (1), Modern pollen assemblages near arctic tree Line, Mackenzie Delta Region, Northwest-Territories, Canadian J. Bot.,, 1-. Ritchie, J. C., and S. Lichti-Federovich (1), Pollen dispersal phenomena in Arctic-Subarctic Canada, Rev. Palaeobot. Palynol.,, -. Ritchie, J. C., K. A. Hadden, and K. Gajewski (1), Modern pollen spectra from lakes in Arctic Western Canada, Canadian J. Bot.,, -. Rousseau, D. D., D. Duzer, J. L. Etienne, G. Cambon, D. Jolly, J. Ferrier, and P. Schevin (00), Pollen record of rapidly changing air trajectories to the North Pole, J. Geophys. Res.,. 1
, Local and regional pollen deposition, in Quaternary plant Ecology, edited by Birks, J. H. B. and R. G. West, pp. 0-, Blackwell Scientific, Oxford. Michel, F. B., P. Cour, L.")
16 D0, doi:./00jd00. Rousseau, D. D., P. Schevin, D. Duzer, G. Cambon, J. Ferrier, D. Jolly, and U. Poulsen (00), New evidence of long distance pollen transport to southern Greenland in late Spring, Rev. Palaeobot. Palynol., 11, -. Rousseau, D. D., D. Duzer, G. Cambon, D. Jolly, U. Poulzen, J. Ferrier, P. Schevin, and R. Gros (00), Long distance transport of pollen to Greenland, Geophys. Res. Lett., 0, 1, doi: 1./00GL01. Short, S. K., and G. Holdsworth (1), Pollen, oxygen isotope content and seasonality in an ice core from the Penny ice cap, Baffin Island, Arctic,, 1-1. Smith, M., J. Emberlin, and A. Kress (00), Examining high magnitude grass pollen episodes at Worcester, United Kingdom, using back-trajectory analysis, Aerobiologia, 1, -. Thompson, R. S., K. H. Anderson, and P. J. Bartlein (1a), Atlas of relations between climatic parameters and distributions of important trees and shrubs in North America; introduction and conifers, pp., U. S. Geological Survey, Denver. Thompson, R. S., K. H. Anderson, and P. J. Bartlein (1b), Atlas of relations between climatic parameters and distributions of important trees and shrubs in North America; harwoods, pp., U. S. Geological Survey, Denver. Tunved, P., E. D. Nilsson, H. C. Hansson, J. Strom, M. Kulmala, P. Aalto, and Y. Viisanen (00), Aerosol characteristics of air masses in northern Europe: Influences of location, transport, sinks, and sources, J. Geophys. Res., 1. D001, doi:./00jd000 1
, Pollen, oxygen isotope content and seasonality in an ice core from the Penny ice cap, Baffin Island, Arctic,, 1-1. Smith, M., J. Emberlin, and A.")
17 Figure captions Figure 1. Location of the four pollen traps, Qaanaaq, Kangerlussuaq, Narsarsuaq and Ittoqqortoormitt in Greenland. Cyclone tracks over Greenland from Chen et al. [Chen, et al., 1] A-D main pathways, E,F secondary pathways. Figure. Pollen stations in Qaanaaq and Ittoqqortoormitt respectively, installed close to meteorological stations. Figure. Long distance transport of pollen to Qaanaaq, Greenland in April 00. (a) Backward trajectories provided by the HYSPLIT model of air parcels reaching Qaanaaq at different altitudes: ground level (red), 00m (blue) and 000m (green) on April 1, 00. The "000m" air parcel passed over the grey area in Northeastern America which represents the area from where all the identied pollen types caught in the filters originated - oak (Quercus), pine (Pinus), plane (Platanus), hornbeam (Carpinus) and walnut (Juglans)- (from [Thompson, et al., 1a; 1b]). (b) Altitudinal variation of the three air parcels used in the backward trajectory analysis. The "000 m" air parcel over Qaanaaq on April 1, 00, was at a lower elevation (between 00 and 000 m) on April and when it passed over the area where "exotic" trees grow. The red bar indicates the time span when potential uplift of the pollen was possible. (c) Updrafts and downdrafts in the atmosphere. Velocity of the air parcel passing over the growing area in northeastern North America, which reached Qaanaaq at 000 m on April 1, 00 versus time. Yellow to brown values indicate upward movements; light blue to purple indicate downward movements. The light colored red box characterizes the timing of the uplift of the pollen corresponding to the interval when the selected air parcel passed over the source region. Figure. Transport to Kangerlussuaq on May, 00. (a) Backward trajectories (as in Figure ). (b) Altitudinal variation of the three air parcels used in the backward trajectory analysis. The 000 m air volume over Kangerlussuaq on May, 00, was at lower elevation (between 00 and 000 m) on May when it passed over the area where oak (Quercus), hazel (Corylus), hops (Humulus), pine (Pinus), and plane (Platanus) are all growing (as in Figure ). (c) as in Figure. Figure. Transport to Narsarsuaq on May, 00. (a) Backward trajectories (as in Figure ). (b) Altitudinal variation of the three air parcels used in the backward trajectory analysis. The "000 m air volume over Narsarsuaq on May, 00, was at a lower elevation 1
, pine")
18 (between ground level and 00m) on May and when it passed over the area where pine (Pinus), oak (Quercus), fir (Abies), hazel (Corylus), walnut (Juglans) and hornbeam (Carpinus) all grow (as in Figure ). (c) as in Figure. Figure. Transport to Ittoqqortoormitt on June 1, 00. (a) Backward trajectories (as in Figure ). (b) Altitudinal variation of the three air parcels used in the backward trajectory analysis. The "000 m air volume over Ittoqqortoormitt on June 1, 00, was at a lower elevation (between ground level and 00 m) on June to when it passed over the area where pine (Pinus), oak (Quercus), chestnut (Castanea) and beech (Fagus) are all growing (as in Figure ). (c) as in Figure. Figure. Transport to Narsarsuaq on May 1, 00. (a) Backward trajectories (as in Figure ). (b) Altitudinal variation of the three air parcels used in the backward trajectory analysis. The "000 m air volume over Narsarsuaq on May 1, 00, was at lower elevation (between ground 00 and 000m) on May when it passed over the area where hornbeam (Carpinus), walnut (Juglans), chestnut (Castanea), pine (Pinus) -and elm (Ulmus), are all growing (as in Figure ). (c) as in Figure. Figure. Transport to Ittoqqortoormitt on April, 00. (a) Backward trajectories (as in Figure ). (b) Altitudinal variation of the three air parcels used in the backward trajectory analysis. The "000 m air volume over Ittoqqortoormitt on April, 00, was at lower elevation (between ground 0 and 000m) on April 1 when it passed over the area where oak (Quercus), pine (Pinus), plane (Platanus) and hickory (Carya) are all growing (as in Figure ). (c) as in Figure. Table 1. Exotic pollen grains identified in the four stations in Greenland in 00 and 00 1
 on June to when it passed over the area where pine (Pinus), oak (Quercus), chestnut")
19
20

Long-distance pollen transport from North America to Greenland in spring
 Click Here for Full Article JOURNAL OF GEOPHYSICAL RESEARCH, VOL. 113,, doi:10.1029/2007jg000456, 2008 Long-distance pollen transport from North America to Greenland in spring Denis-Didier Rousseau, 1,2
New evidence of long distance pollen transport to southern Greenland in late spring
 Review of Palaeobotany and Palynology 141 (2006) 277 286 www.elsevier.com/locate/revpalbo New evidence of long distance pollen transport to southern Greenland in late spring D.-D. Rousseau a,b,, P. Schevin
Mobility management and vertical handover decision making in heterogeneous wireless networks
 Mobility management and vertical handover decision making in heterogeneous wireless networks Mariem Zekri To cite this version: Mariem Zekri. Mobility management and vertical handover decision making in
ibalance-abf: a Smartphone-Based Audio-Biofeedback Balance System
 ibalance-abf: a Smartphone-Based Audio-Biofeedback Balance System Céline Franco, Anthony Fleury, Pierre-Yves Guméry, Bruno Diot, Jacques Demongeot, Nicolas Vuillerme To cite this version: Céline Franco,
Geography affects climate.
 KEY CONCEPT Climate is a long-term weather pattern. BEFORE, you learned The Sun s energy heats Earth s surface unevenly The atmosphere s temperature changes with altitude Oceans affect wind flow NOW, you
Expanding Renewable Energy by Implementing Demand Response
 Expanding Renewable Energy by Implementing Demand Response Stéphanie Bouckaert, Vincent Mazauric, Nadia Maïzi To cite this version: Stéphanie Bouckaert, Vincent Mazauric, Nadia Maïzi. Expanding Renewable
A graph based framework for the definition of tools dealing with sparse and irregular distributed data-structures
 A graph based framework for the definition of tools dealing with sparse and irregular distributed data-structures Serge Chaumette, Jean-Michel Lepine, Franck Rubi To cite this version: Serge Chaumette,
A usage coverage based approach for assessing product family design
 A usage coverage based approach for assessing product family design Jiliang Wang To cite this version: Jiliang Wang. A usage coverage based approach for assessing product family design. Other. Ecole Centrale
Chapter Overview. Seasons. Earth s Seasons. Distribution of Solar Energy. Solar Energy on Earth. CHAPTER 6 Air-Sea Interaction
 Chapter Overview CHAPTER 6 Air-Sea Interaction The atmosphere and the ocean are one independent system. Earth has seasons because of the tilt on its axis. There are three major wind belts in each hemisphere.
ANIMATED PHASE PORTRAITS OF NONLINEAR AND CHAOTIC DYNAMICAL SYSTEMS
 ANIMATED PHASE PORTRAITS OF NONLINEAR AND CHAOTIC DYNAMICAL SYSTEMS Jean-Marc Ginoux To cite this version: Jean-Marc Ginoux. ANIMATED PHASE PORTRAITS OF NONLINEAR AND CHAOTIC DYNAMICAL SYSTEMS. A.H. Siddiqi,
Information Technology Education in the Sri Lankan School System: Challenges and Perspectives
 Information Technology Education in the Sri Lankan School System: Challenges and Perspectives Chandima H. De Silva To cite this version: Chandima H. De Silva. Information Technology Education in the Sri
Monsoon Variability and Extreme Weather Events
 Monsoon Variability and Extreme Weather Events M Rajeevan National Climate Centre India Meteorological Department Pune 411 005 rajeevan@imdpune.gov.in Outline of the presentation Monsoon rainfall Variability
QASM: a Q&A Social Media System Based on Social Semantics
 QASM: a Q&A Social Media System Based on Social Semantics Zide Meng, Fabien Gandon, Catherine Faron-Zucker To cite this version: Zide Meng, Fabien Gandon, Catherine Faron-Zucker. QASM: a Q&A Social Media
Climate, Vegetation, and Landforms
 Climate, Vegetation, and Landforms Definitions Climate is the average weather of a place over many years Geographers discuss five broad types of climates Moderate, dry, tropical, continental, polar Vegetation:
Climate Extremes Research: Recent Findings and New Direc8ons
 Climate Extremes Research: Recent Findings and New Direc8ons Kenneth Kunkel NOAA Cooperative Institute for Climate and Satellites North Carolina State University and National Climatic Data Center h#p://assessment.globalchange.gov
Cracks detection by a moving photothermal probe
 Cracks detection by a moving photothermal probe J. Bodnar, M. Egée, C. Menu, R. Besnard, A. Le Blanc, M. Pigeon, J. Sellier To cite this version: J. Bodnar, M. Egée, C. Menu, R. Besnard, A. Le Blanc, et
2. The map below shows high-pressure and low-pressure weather systems in the United States.
 1. Which weather instrument has most improved the accuracy of weather forecasts over the past 40 years? 1) thermometer 3) weather satellite 2) sling psychrometer 4) weather balloon 6. Wind velocity is
Communities, Biomes, and Ecosystems
 Communities, Biomes, and Ecosystems Before You Read Before you read the chapter, respond to these statements. 1. Write an A if you agree with the statement. 2. Write a D if you disagree with the statement.
An update on acoustics designs for HVAC (Engineering)
") An update on acoustics designs for HVAC (Engineering) Ken MARRIOTT To cite this version: Ken MARRIOTT. An update on acoustics designs for HVAC (Engineering). Société Française d Acoustique. Acoustics 2012,
An update on acoustics designs for HVAC (Engineering) Ken MARRIOTT To cite this version: Ken MARRIOTT. An update on acoustics designs for HVAC (Engineering). Société Française d Acoustique. Acoustics 2012,
VR4D: An Immersive and Collaborative Experience to Improve the Interior Design Process
 VR4D: An Immersive and Collaborative Experience to Improve the Interior Design Process Amine Chellali, Frederic Jourdan, Cédric Dumas To cite this version: Amine Chellali, Frederic Jourdan, Cédric Dumas.
Climate, water and renewable energy in the Nordic countries
 102 Regional Hydrological Impacts of Climatic Change Hydroclimatic Variability (Proceedings of symposium S6 held during the Seventh IAHS Scientific Assembly at Foz do Iguaçu, Brazil, April 2005). IAHS
Faut-il des cyberarchivistes, et quel doit être leur profil professionnel?
 Faut-il des cyberarchivistes, et quel doit être leur profil professionnel? Jean-Daniel Zeller To cite this version: Jean-Daniel Zeller. Faut-il des cyberarchivistes, et quel doit être leur profil professionnel?.
Managing Risks at Runtime in VoIP Networks and Services
 Managing Risks at Runtime in VoIP Networks and Services Oussema Dabbebi, Remi Badonnel, Olivier Festor To cite this version: Oussema Dabbebi, Remi Badonnel, Olivier Festor. Managing Risks at Runtime in
P1.2 NUMERICAL SIMULATION OF LONG DISTANCE TRANSPORTATION OF VOLCANO ASH FROM PINATUBO
 P1.2 NUMERICAL SIMULATION OF LONG DISTANCE TRANSPORTATION OF VOLCANO ASH FROM PINATUBO Tan Jiqing Xu Juan (Institution of Meteorological Information and Prediction of Disaster Events, Zhejiang University,
FRENCH ARCTIC INITIATIVE SCIENTIFIC PRIORITIES
 FRENCH ARCTIC INITIATIVE SCIENTIFIC PRIORITIES J.J. Pangrazi / Biosphoto J.J. Pangrazi / Biosphoto Conference audience Edouard Bard introductory lecture Dr. Denis-Didier Rousseau (CNRS Senior Research
ATMS 310 Jet Streams
 ATMS 310 Jet Streams Jet Streams A jet stream is an intense (30+ m/s in upper troposphere, 15+ m/s lower troposphere), narrow (width at least ½ order magnitude less than the length) horizontal current
Chapter 3 Communities, Biomes, and Ecosystems
 Communities, Biomes, and Ecosystems Section 1: Community Ecology Section 2: Terrestrial Biomes Section 3: Aquatic Ecosystems Click on a lesson name to select. 3.1 Community Ecology Communities A biological
DEM modeling of penetration test in static and dynamic conditions
 DEM modeling of penetration test in static and dynamic conditions Quoc Anh Tran, Bastien Chevalier, Pierre Breul To cite this version: Quoc Anh Tran, Bastien Chevalier, Pierre Breul. DEM modeling of penetration
Jessica Blunden, Ph.D., Scientist, ERT Inc., Climate Monitoring Branch, NOAA s National Climatic Data Center
 Kathryn Sullivan, Ph.D, Acting Under Secretary of Commerce for Oceans and Atmosphere and NOAA Administrator Thomas R. Karl, L.H.D., Director,, and Chair of the Subcommittee on Global Change Research Jessica
FURTHER DISCUSSION ON: TREE-RING TEMPERATURE RECONSTRUCTIONS FOR THE PAST MILLENNIUM
 1 FURTHER DISCUSSION ON: TREE-RING TEMPERATURE RECONSTRUCTIONS FOR THE PAST MILLENNIUM Follow-up on the National Research Council Meeting on "Surface Temperature Reconstructions for the Past 1000-2000
FP-Hadoop: Efficient Execution of Parallel Jobs Over Skewed Data
 FP-Hadoop: Efficient Execution of Parallel Jobs Over Skewed Data Miguel Liroz-Gistau, Reza Akbarinia, Patrick Valduriez To cite this version: Miguel Liroz-Gistau, Reza Akbarinia, Patrick Valduriez. FP-Hadoop:
A modeling approach for locating logistics platforms for fast parcels delivery in urban areas
 A modeling approach for locating logistics platforms for fast parcels delivery in urban areas Olivier Guyon, Nabil Absi, Dominique Feillet, Thierry Garaix To cite this version: Olivier Guyon, Nabil Absi,
Southern AER Atmospheric Education Resource
 Southern AER Atmospheric Education Resource Vol. 9 No. 5 Spring 2003 Editor: Lauren Bell In this issue: g Climate Creations exploring mother nature s remote control for weather and Climate. g Crazy Climate
The IPCC Special Report on Managing the Risks of Extreme Events and Disasters to Advance Climate Change Adaptation
 The IPCC Special Report on Managing the Risks of Extreme Events and Disasters to Advance Climate Change Adaptation A changing climate leads to changes in extreme weather and climate events 2 How do changes
Online vehicle routing and scheduling with continuous vehicle tracking
 Online vehicle routing and scheduling with continuous vehicle tracking Jean Respen, Nicolas Zufferey, Jean-Yves Potvin To cite this version: Jean Respen, Nicolas Zufferey, Jean-Yves Potvin. Online vehicle
Aligning subjective tests using a low cost common set
 Aligning subjective tests using a low cost common set Yohann Pitrey, Ulrich Engelke, Marcus Barkowsky, Romuald Pépion, Patrick Le Callet To cite this version: Yohann Pitrey, Ulrich Engelke, Marcus Barkowsky,
Discussion on the paper Hypotheses testing by convex optimization by A. Goldenschluger, A. Juditsky and A. Nemirovski.
 Discussion on the paper Hypotheses testing by convex optimization by A. Goldenschluger, A. Juditsky and A. Nemirovski. Fabienne Comte, Celine Duval, Valentine Genon-Catalot To cite this version: Fabienne
6. Base your answer to the following question on the graph below, which shows the average monthly temperature of two cities A and B.
 1. Which single factor generally has the greatest effect on the climate of an area on the Earth's surface? 1) the distance from the Equator 2) the extent of vegetative cover 3) the degrees of longitude
Study on Cloud Service Mode of Agricultural Information Institutions
 Study on Cloud Service Mode of Agricultural Information Institutions Xiaorong Yang, Nengfu Xie, Dan Wang, Lihua Jiang To cite this version: Xiaorong Yang, Nengfu Xie, Dan Wang, Lihua Jiang. Study on Cloud
7613-1 - Page 1. Weather Unit Exam Pre-Test Questions
 Weather Unit Exam Pre-Test Questions 7613-1 - Page 1 Name: 1) Equal quantities of water are placed in four uncovered containers with different shapes and left on a table at room temperature. From which
Additional mechanisms for rewriting on-the-fly SPARQL queries proxy
 Additional mechanisms for rewriting on-the-fly SPARQL queries proxy Arthur Vaisse-Lesteven, Bruno Grilhères To cite this version: Arthur Vaisse-Lesteven, Bruno Grilhères. Additional mechanisms for rewriting
Territorial Intelligence and Innovation for the Socio-Ecological Transition
 Territorial Intelligence and Innovation for the Socio-Ecological Transition Jean-Jacques Girardot, Evelyne Brunau To cite this version: Jean-Jacques Girardot, Evelyne Brunau. Territorial Intelligence and
6.4 Taigas and Tundras
 6.4 Taigas and Tundras In this section, you will learn about the largest and coldest biomes on Earth. The taiga is the largest land biome and the tundra is the coldest. The taiga The largest land biome
Supporting Online Material for
 www.sciencemag.org/cgi/content/full/311/5768/1747/dc1 Supporting Online Material for Paleoclimatic Evidence for Future Ice-Sheet Instability and Rapid Sea- Level Rise Jonathan T. Overpeck,* Bette L. Otto-Bliesner,
Use of tabletop exercise in industrial training disaster.
 Use of tabletop exercise in industrial training disaster. Alexis Descatha, Thomas Loeb, François Dolveck, Nathalie-Sybille Goddet, Valerie Poirier, Michel Baer To cite this version: Alexis Descatha, Thomas
THE ECOSYSTEM - Biomes
 Biomes The Ecosystem - Biomes Side 2 THE ECOSYSTEM - Biomes By the end of this topic you should be able to:- SYLLABUS STATEMENT ASSESSMENT STATEMENT CHECK NOTES 2.4 BIOMES 2.4.1 Define the term biome.
SELECTIVELY ABSORBING COATINGS
 SELECTIVELY ABSORBING COATINGS J. Vuletin, P. Kuli ik, M. Bosanac To cite this version: J. Vuletin, P. Kuli ik, M. Bosanac. SELECTIVELY ABSORBING COATINGS. Journal de Physique Colloques, 1981, 42 (C1),
Can you see the difference between wind pollinated and insect pollinated flowers?
 Can you see the difference between wind pollinated and insect pollinated flowers? Age of Students 10 14 years Duration 1 hour Summary Pollination is a very effective factor in the evolution of plants and
CGC1D1: Interactions in the Physical Environment Factors that Affect Climate
 Name: Date: Day/Period: CGC1D1: Interactions in the Physical Environment Factors that Affect Climate Chapter 12 in the Making Connections textbook deals with Climate Connections. Use pages 127-144 to fill
Communities, Biomes, and Ecosystems
 Chapter Test A CHAPTER 3 Communities, Biomes, and Ecosystems Part A: Multiple Choice In the space at the left, write the letter of the term or phrase that best answers each question Part B: Matching 1
Project Title: Quantifying Uncertainties of High-Resolution WRF Modeling on Downslope Wind Forecasts in the Las Vegas Valley
 University: Florida Institute of Technology Name of University Researcher Preparing Report: Sen Chiao NWS Office: Las Vegas Name of NWS Researcher Preparing Report: Stanley Czyzyk Type of Project (Partners
Climate of Illinois Narrative Jim Angel, state climatologist. Introduction. Climatic controls
 Climate of Illinois Narrative Jim Angel, state climatologist Introduction Illinois lies midway between the Continental Divide and the Atlantic Ocean, and the state's southern tip is 500 miles north of
Global Identity Management of Virtual Machines Based on Remote Secure Elements
 Global Identity Management of Virtual Machines Based on Remote Secure Elements Hassane Aissaoui, P. Urien, Guy Pujolle To cite this version: Hassane Aissaoui, P. Urien, Guy Pujolle. Global Identity Management
What Development for Bioenergy in Asia: A Long-term Analysis of the Effects of Policy Instruments using TIAM-FR model
 What Development for Bioenergy in Asia: A Long-term Analysis of the Effects of Policy Instruments using TIAM-FR model Seungwoo Kang, Sandrine Selosse, Nadia Maïzi To cite this version: Seungwoo Kang, Sandrine
SIMS AND SCANNING ION MICROSCOPY
 SIMS AND SCANNING ION MICROSCOPY G. Allen, I. Brown To cite this version: G. Allen, I. Brown. SIMS AND SCANNING ION MICROSCOPY. Journal de Physique Colloques, 1989, 50 (C2), pp.c2-121-c2-125. .
SPATIAL DISTRIBUTION OF NORTHERN HEMISPHERE WINTER TEMPERATURES OVER THE SOLAR CYCLE DURING THE LAST 130 YEARS
 SPATIAL DISTRIBUTION OF NORTHERN HEMISPHERE WINTER TEMPERATURES OVER THE SOLAR CYCLE DURING THE LAST 130 YEARS Kalevi Mursula, Ville Maliniemi, Timo Asikainen ReSoLVE Centre of Excellence Department of
CHAPTER 3. The sun and the seasons. Locating the position of the sun
 zenith 90 summer solstice 75 equinox 52 winter solstice 29 altitude angles observer Figure 3.1: Solar noon altitude angles for Melbourne SOUTH winter midday shadow WEST summer midday shadow summer EAST
defined largely by regional variations in climate
 1 Physical Environment: Climate and Biomes EVPP 110 Lecture Instructor: Dr. Largen Fall 2003 2 Climate and Biomes Ecosystem concept physical and biological components of environment are considered as single,
Atmospheric Dynamics of Venus and Earth. Institute of Geophysics and Planetary Physics UCLA 2 Lawrence Livermore National Laboratory
 Atmospheric Dynamics of Venus and Earth G. Schubert 1 and C. Covey 2 1 Department of Earth and Space Sciences Institute of Geophysics and Planetary Physics UCLA 2 Lawrence Livermore National Laboratory
Overview of model-building strategies in population PK/PD analyses: 2002-2004 literature survey.
 Overview of model-building strategies in population PK/PD analyses: 2002-2004 literature survey. Céline Dartois, Karl Brendel, Emmanuelle Comets, Céline Laffont, Christian Laveille, Brigitte Tranchand,
5 th Grade Science Vocabulary Words
 5 th Grade Science Vocabulary Words abiotic factor A nonliving part of an ecosystem. acceleration Change in velocity with respect to time. action The force one object applies to a second, as in Newton
Radiative effects of clouds, ice sheet and sea ice in the Antarctic
 Snow and fee Covers: Interactions with the Atmosphere and Ecosystems (Proceedings of Yokohama Symposia J2 and J5, July 1993). IAHS Publ. no. 223, 1994. 29 Radiative effects of clouds, ice sheet and sea
Towards Unified Tag Data Translation for the Internet of Things
 Towards Unified Tag Data Translation for the Internet of Things Loïc Schmidt, Nathalie Mitton, David Simplot-Ryl To cite this version: Loïc Schmidt, Nathalie Mitton, David Simplot-Ryl. Towards Unified
REMOTE SENSING OF CLOUD-AEROSOL RADIATIVE EFFECTS FROM SATELLITE DATA: A CASE STUDY OVER THE SOUTH OF PORTUGAL
 REMOTE SENSING OF CLOUD-AEROSOL RADIATIVE EFFECTS FROM SATELLITE DATA: A CASE STUDY OVER THE SOUTH OF PORTUGAL D. Santos (1), M. J. Costa (1,2), D. Bortoli (1,3) and A. M. Silva (1,2) (1) Évora Geophysics
Cloud seeding. Frequently Asked Questions. What are clouds and how are they formed? How do we know cloud seeding works in Tasmania?
 What are clouds and how are they formed? Clouds are composed of water droplets and sometimes ice crystals. Clouds form when air that is rich in moisture near the Earth s surface rises higher into the atmosphere,
Seasonal & Daily Temperatures. Seasons & Sun's Distance. Solstice & Equinox. Seasons & Solar Intensity
 Seasonal & Daily Temperatures Seasons & Sun's Distance The role of Earth's tilt, revolution, & rotation in causing spatial, seasonal, & daily temperature variations Please read Chapter 3 in Ahrens Figure
8.5 Comparing Canadian Climates (Lab)
") These 3 climate graphs and tables of data show average temperatures and precipitation for each month in Victoria, Winnipeg and Whitehorse: Figure 1.1 Month J F M A M J J A S O N D Year Precipitation 139
These 3 climate graphs and tables of data show average temperatures and precipitation for each month in Victoria, Winnipeg and Whitehorse: Figure 1.1 Month J F M A M J J A S O N D Year Precipitation 139
Technical Support Document For The May 2, 2008 Exceptional Event
 Technical Support Document For The May 2, 2008 Exceptional Event Prepared by the Technical Services Program Air Pollution Control Division June 9, 2009 2 Table of Contents: 1.0 Introduction... 4 2.0 Ambient
Convective Clouds. Convective clouds 1
 Convective clouds 1 Convective Clouds Introduction Convective clouds are formed in vertical motions that result from the instability of the atmosphere. This instability can be caused by: a. heating at
Chapter 3: Climate and Climate Change Answers
 Chapter 3: Climate and Climate Change Answers Section A: Climate 1. (a) Explain what each of the following means: (4 x 1 mark) (i) climate the average weather of an area over a 25 30 year period (ii) maritime
Glaciogenic Cloud Seeding to Increase Orographic Precipitation Bruce A. Boe bboe@weathermod.com Director of Meteorology
 Glaciogenic Cloud Seeding to Increase Orographic Precipitation Bruce A. Boe bboe@weathermod.com Director of Meteorology Weather Modification, Inc. Fargo, North Dakota, USA www.weathermodification.com Content
WILLOCHRA BASIN GROUNDWATER STATUS REPORT 2009-10
 WILLOCHRA BASIN GROUNDWATER STATUS REPORT 2009-10 SUMMARY 2009-10 The Willochra Basin is situated in the southern Flinders Ranges in the Mid-North of South Australia, approximately 50 km east of Port Augusta
Orbital-Scale Climate Change
 Orbital-Scale Climate Change Climate Needed for Ice Age Warm winter and non-frozen oceans so lots of evaporation and snowfall Cool summer so that ice does not melt Ice Age Model When ice growing ocean
Developing Continuous SCM/CRM Forcing Using NWP Products Constrained by ARM Observations
 Developing Continuous SCM/CRM Forcing Using NWP Products Constrained by ARM Observations S. C. Xie, R. T. Cederwall, and J. J. Yio Lawrence Livermore National Laboratory Livermore, California M. H. Zhang
Sea level scenarios and extreme weather events
 Extreme weather and nuclear power plants (EXWE) Sea level scenarios and extreme weather events Milla Johansson, Kimmo Kahma, Hilkka Pellikka, Hanna Tietäväinen, Seppo Saku and Kirsti Jylhä Finnish Meteorological
Storms Short Study Guide
 Name: Class: Date: Storms Short Study Guide Multiple Choice Identify the letter of the choice that best completes the statement or answers the question. 1. A(n) thunderstorm forms because of unequal heating
Diurnal Cycle of Convection at the ARM SGP Site: Role of Large-Scale Forcing, Surface Fluxes, and Convective Inhibition
 Thirteenth ARM Science Team Meeting Proceedings, Broomfield, Colorado, March 31-April 4, 23 Diurnal Cycle of Convection at the ARM SGP Site: Role of Large-Scale Forcing, Surface Fluxes, and Convective
Week 1. Week 2. Week 3
 Week 1 1. What US city has the largest population? 2. Where is Aachen? 3. What is the capitol of Florida? 4. What is the longest mountain range in Spain? 5. What countries border Equador? Week 2 1. What
Impacts of Global Warming on North Carolina s Coastal Economy
 Impacts of Global Warming on North Carolina s Coastal Economy IMPACTS OF GLOBAL WARMING ON NORTH CAROLINA S COASTAL ECONOMY Key Findings Global warming is projected to have significant impacts on North
Graphing Sea Ice Extent in the Arctic and Antarctic
 Graphing Sea Ice Extent in the Arctic and Antarctic Summary: Students graph sea ice extent (area) in both polar regions (Arctic and Antarctic) over a three-year period to learn about seasonal variations
AIR TEMPERATURE IN THE CANADIAN ARCTIC IN THE MID NINETEENTH CENTURY BASED ON DATA FROM EXPEDITIONS
 PRACE GEOGRAFICZNE, zeszyt 107 Instytut Geografii UJ Kraków 2000 Rajmund Przybylak AIR TEMPERATURE IN THE CANADIAN ARCTIC IN THE MID NINETEENTH CENTURY BASED ON DATA FROM EXPEDITIONS Abstract: The paper
Modelling ragweed pollen in Rhône-Alpes (France)
") Modelling ragweed pollen in Rhône-Alpes (France) IRC Conference, Lyon, March 28 th 2012 Project funded by: E. Chaxel 1, C. Rieux 1, I. Rios 1, M. Thibaudon 2, G. Oliver 2 1 Air Rhône-Alpes, Bron (France)
Modelling ragweed pollen in Rhône-Alpes (France) IRC Conference, Lyon, March 28 th 2012 Project funded by: E. Chaxel 1, C. Rieux 1, I. Rios 1, M. Thibaudon 2, G. Oliver 2 1 Air Rhône-Alpes, Bron (France)
ISO9001 Certification in UK Organisations A comparative study of motivations and impacts.
 ISO9001 Certification in UK Organisations A comparative study of motivations and impacts. Scott McCrosson, Michele Cano, Eileen O Neill, Abdessamad Kobi To cite this version: Scott McCrosson, Michele Cano,
SECTION 3.2 CLIMATE AND PRECIPITATION
 SECTION 3.2 CLIMATE AND PRECIPITATION Ulster County Climate Data A preliminary analysis of the Preserve s weather data shows that the average temperature has risen about two degrees over the past 114 years.
Activity 8 Drawing Isobars Level 2 http://www.uni.edu/storm/activities/level2/index.shtml
 Activity 8 Drawing Isobars Level 2 http://www.uni.edu/storm/activities/level2/index.shtml Objectives: 1. Students will be able to define and draw isobars to analyze air pressure variations. 2. Students
RaysWeather.Com 2015-2016 Winter Fearless Forecast
 Author: Dr. Ray Russell Founder and President of RaysWeather.Com Date: October 10, 2015 RaysWeather.Com 2015-2016 Winter Fearless Forecast Background It's that time of year--leaves change, temperatures
Data Sets of Climate Science
 The 5 Most Important Data Sets of Climate Science Photo: S. Rahmstorf This presentation was prepared on the occasion of the Arctic Expedition for Climate Action, July 2008. Author: Stefan Rahmstorf, Professor
Chapter 2: Solar Radiation and Seasons
 Chapter 2: Solar Radiation and Seasons Spectrum of Radiation Intensity and Peak Wavelength of Radiation Solar (shortwave) Radiation Terrestrial (longwave) Radiations How to Change Air Temperature? Add
6.4 THE SIERRA ROTORS PROJECT, OBSERVATIONS OF MOUNTAIN WAVES. William O. J. Brown 1 *, Stephen A. Cohn 1, Vanda Grubiši 2, and Brian Billings 2
 6.4 THE SIERRA ROTORS PROJECT, OBSERVATIONS OF MOUNTAIN WAVES William O. J. Brown 1 *, Stephen A. Cohn 1, Vanda Grubiši 2, and Brian Billings 2 1 National Center for Atmospheric Research, Boulder, Colorado.
ANALYSIS OF SNOEK-KOSTER (H) RELAXATION IN IRON
 RELAXATION IN IRON") ANALYSIS OF SNOEK-KOSTER (H) RELAXATION IN IRON J. San Juan, G. Fantozzi, M. No, C. Esnouf, F. Vanoni To cite this version: J. San Juan, G. Fantozzi, M. No, C. Esnouf, F. Vanoni. ANALYSIS OF SNOEK-KOSTER
ANALYSIS OF SNOEK-KOSTER (H) RELAXATION IN IRON J. San Juan, G. Fantozzi, M. No, C. Esnouf, F. Vanoni To cite this version: J. San Juan, G. Fantozzi, M. No, C. Esnouf, F. Vanoni. ANALYSIS OF SNOEK-KOSTER
South Africa. General Climate. UNDP Climate Change Country Profiles. A. Karmalkar 1, C. McSweeney 1, M. New 1,2 and G. Lizcano 1
 UNDP Climate Change Country Profiles South Africa A. Karmalkar 1, C. McSweeney 1, M. New 1,2 and G. Lizcano 1 1. School of Geography and Environment, University of Oxford. 2. Tyndall Centre for Climate
The Ice Age By: Sue Peterson
 www.k5learning.com Objective sight words (pulses, intermittent, isotopes, chronicle, methane, tectonic plates, volcanism, configurations, land-locked, erratic); concepts (geological evidence and specific
Forecast-Informed Reservoir Operations: A Concept Supporting Water Supply and Flood Control
 16 inches of rain in 1 day in Central California Forecast-Informed Reservoir Operations: A Concept Supporting Water Supply and Flood Control Developed by the Center for Western Weather and Water Extremes
Straits of Mackinac Contaminant Release Scenarios: Flow Visualization and Tracer Simulations
 Straits of Mackinac Contaminant Release Scenarios: Flow Visualization and Tracer Simulations Research Report for the National Wildlife Federation Great Lakes Regional Center By David J. Schwab, Ph.D.,
Chapter 3: Weather Map. Weather Maps. The Station Model. Weather Map on 7/7/2005 4/29/2011
 Chapter 3: Weather Map Weather Maps Many variables are needed to described weather conditions. Local weathers are affected by weather pattern. We need to see all the numbers describing weathers at many
CARBON THROUGH THE SEASONS
 DESCRIPTION In this lesson plan, students learn about the carbon cycle and understand how concentrations of carbon dioxide (CO 2 ) in the Earth s atmosphere vary as the seasons change. Students also learn
Air Masses and Fronts
 Air Masses and Fronts Air Masses The weather of the United States east of the Rocky Mountains is dominated by large masses of air that travel south from the wide expanses of land in Canada, and north from
Chapter 7 Stability and Cloud Development. Atmospheric Stability
 Chapter 7 Stability and Cloud Development Atmospheric Stability 1 Cloud Development - stable environment Stable air (parcel) - vertical motion is inhibited if clouds form, they will be shallow, layered
The Surface Energy Budget
 The Surface Energy Budget The radiation (R) budget Shortwave (solar) Radiation Longwave Radiation R SW R SW α α = surface albedo R LW εσt 4 ε = emissivity σ = Stefan-Boltzman constant T = temperature Subsurface
Minkowski Sum of Polytopes Defined by Their Vertices
 Minkowski Sum of Polytopes Defined by Their Vertices Vincent Delos, Denis Teissandier To cite this version: Vincent Delos, Denis Teissandier. Minkowski Sum of Polytopes Defined by Their Vertices. Journal