SPATIAL DISTRIBUTION OF NORTHERN HEMISPHERE WINTER TEMPERATURES OVER THE SOLAR CYCLE DURING THE LAST 130 YEARS
|
|
|
- Kellie Gibson
- 8 years ago
- Views:
Transcription
1 SPATIAL DISTRIBUTION OF NORTHERN HEMISPHERE WINTER TEMPERATURES OVER THE SOLAR CYCLE DURING THE LAST 130 YEARS Kalevi Mursula, Ville Maliniemi, Timo Asikainen ReSoLVE Centre of Excellence Department of Physics University of Oulu, Finland

2 CONTENTS Background Possible connection between energetic electron precipitation and Northern Hemisphere winter surface temperatures NOAA/MEPED data period Sunspot cycle phases in Conclusions

3 BACKGROUND... NORTH ATLANTIC OSCILLATION (ARCTIC OSCILLATION) Normalised sea- level pressure difference between Iceland and Azores/Iberia Closely related to the evolution of polar vortex Strongly affects winter conditions in Europe and N. America NAO+ NAO+ ü More and stronger storms cross Atlantic ü Warm & wet in N. Eurasia and US east coast ü Strong polar vortex NAO- ü Reduced p gradient=> fewer and weaker storms ü Dry & cold in N. Eurasia and US east coast ü Weaker polar vortex NAO-

4 DAILY NAO INDEX AND MELTING OF SNOW IN FINLAND Very low snow levels in most of Finland: Two events of snow melting Positive NAO from Jan 21, until now

5 DAILY NAO INDEX AND MELTING OF SNOW IN FINLAND Very low snow levels in most of Finland: Two events of snow melting Positive NAO from Jan 21, until now

6 NAO AND WINTER SURFACE AIR TEMPERATURES (SAT) Winter monthly surface air temperature anomalies during (left) positive NAO and (right) negative NAO. White lines represent 95% confidence levels. Data gaps represent temperature grids with more than 5% of the data points missing.

7 BACKGROUND... GEOMAGNETIC EFFECT ON WINTER NAO Several studies have indicated a relation between geomagnetic activity and winter time tropospheric circulation and temperature [Bochnicek et al. (1999); Thejll et al. (2003) Rozanov et al. (2005); Seppälä et al. (2009); Baumgaertner et al. (2011)]. Particle precipitation can cause dramatic changes in the upper atmospheric chemistry, producing NOx. During polar winter NOx can descend down to stratosphere and affect ozone balance, which can modulate stratospheric and tropospheric circulation [Randall et al. (2005); Funke et al. (2006); Seppälä et al. (2007)] Particle precipitation leads to the strengthening of the polar vortex, which is also connected to the North Atlantic oscillation (or northern annular mode) [Baumgaertner et al. (2011)]. Seppälä et al. (2009), JGR Baumgaertner et al. (2011), ACP
; Funke et al.")
8 NOAA/MEPED: ENERGETIC ELECTRON PRECIPITATION (EEP) Corrected and recalibrated MEPED data [Asikainen and Mursula, 2011, JASTP; Asikainen et al., 2012, JGR; Asikainen and Mursula, 2013, JGR] Sun- synchronous polar orbits at 850km altitude Same LT- sector (Dawn- Dusk) with NOAA- 06, 08, 10, 12 and 15 Continuous time series for years MEPED 0 - telescope points roughly radially away from the Earth ( detect precipitating particles at high latitudes).
![, 2012, JGR; Asikainen and Mursula, 2013, JGR] Sun- synchronous polar orbits at 850km altitude Same LT- sector](/docs-images/45/11379869/images/page_8.jpg "(Dawn- Dusk) with NOAA- 06, 08, 10, 12 and 15 Continuous time series for years 1980-2010 MEPED 0 - telescope")
9 LONG TERM EVOLUTION OF MEPED ELECTRONS Electron kluxes maximize fairly late in the declining phase. Large cycle variation! Interestingly the electron klux at latest solar max 2013 is even stronger than in the previous solar max at è Interesting next 2-3 years ahead.

10 HIGH SPEED STREAMS MOST IMPORTANT FOR ENERGETIC ELECTRONS Clear relation of electron kluxes to high speed streams in the solar wind.

11 SOLAR CYCLE EVOLUTION OF EEP, GA AND SW SPEED Two differential energy channels of MEPED: D1 ( kev) and D2 ( kev). Averages over 3 winter months (Nov, Dec, Jan) Differences in solar cycle evolution: EEP kluxes peak later in the declining phase of the solar cycle than GA (Ap index) and co- varies more closely with solar wind speed than with Ap. GA is produced by CMEs and HSS/CIRs! These differences may in principle affect earlier results based on GA.
 and co- varies more closely with solar wind speed than with Ap.")
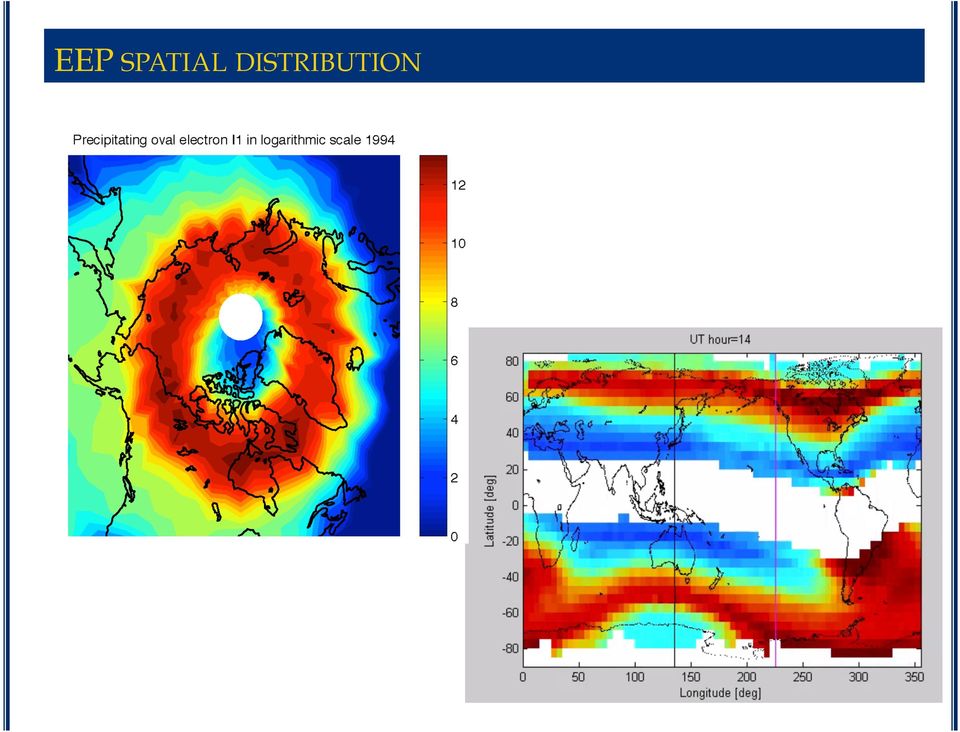
12 EEP SPATIAL DISTRIBUTION
13 SURFACE AIR TEMPERATURE (SAT) ANOMALIES Temperature data is presented as gridded monthly temperature maps in 5 x5 (2 x2 ) boxes of latitude and longitude since 1980 (1880) (Nasa GISS temperature record). Constructed from ground station data of the Global Historical Climatology Network (GHCN), from Hadley Centre analysis of sea surface temperatures (HadISST1) for and from satellite measurements of sea surface temperature from 1982 onwards (Optimum Interpolation Sea Surface Temperature Version 2, OISST.v2). Temperature anomalies are calculated as monthly anomalies from the climatology period ( ) in each grid box. (In the longer term studies we used 31- year running anomaly). Hansen et al. (2010), Rev. Geophys
.")
14 NAO AND WINTER SAT IN Correlation Range of SAT variation

15 NAO AND EEP Correlations between NAO index and D1 (cc=0.44, p=0.015) and between NAO index and D2 (0.44, p=0.031) are signikicant. Excluding winters with unprecentedly strong SSW event (1985 and 2004; open circles) yields signikicantly stronger correlations (cc=0.64, p<0.001) between NAO index and D1, and (cc=0.65, p<0.001) between NAO index and D2. p- values were obtained by bootstrapping the residuals with 1000 resamplings, shufkling the harmonic phases of the samples and calculating the fraction of those shufklings with correlation larger than original. The same procudure was also used to calculate the p- values for EEP and SAT in each grid box.

16 SUDDEN STRATOSPHERIC WARMING (SSW) Sudden stratospheric warmings dramatically change overall circulation in the stratosphere and can slow down the polar vortex. Weak vortex signal can propagate down to troposphere and turn NAO more negative. For SSWs to show in mean winter conditions it has to be strong and persistent. Manney et al. (JGR, 2005): Jan mean zonal wind in N is easterly only during Winters 1984/1985 and 2003/2004. We made a similar zonal wind analysis between 60 N and 90 N at 50 hpa, by using the same (NCEP/NCAR) data for and found the same Winters (1984/1985 and 2003/2004) to be the only ones with easterly mean zonal wind in January. These Winters were also the only ones where the value differs from the mean January zonal wind value during by more than two standard deviations.
 data for 1980 2010 and found the same Winters (1984/1985 and 2003/2004) to be the only ones with")
17 SAT AND EEP Correlation FOR ALL WINTERS Range of SAT variation

18 SAT AND EEP EXCLUDING THE TWO EXTREME SSW WINTERS D1 Correlation 4.3 ± 2.9 C cc=0.44 and p- value Range of SAT variation 4.5 ± 2.3 C cc= and p- value ± 3.4 C cc=0.32 and p- value D2 4.1 ± 2.2 C cc= and p- value 0.011

19 NAO AND WINTER SAT IN Correlation Range of SAT variation

20 QUASI-BIENNIAL OSCILLATION (QBO) About 28- month oscillation in equatorial stratospheric zonal winds. Affects the strength of the polar vortex. Baldwin et al. (2001), Rev. Geophys

21 QBO DIVISION Averaged EEP during three winter months (NDJ) in D1 and D2 energies. Divide Winters according to westerly and easterly QBO phase. (3-month (NDJ) mean at 30 hpa, about 25km) Grey bars represent winters with average QBO index being westerly, other winters being easterly. Red circles represent the exceptional winters 1985 and 2004 of strong SSW. Scaled sunspot numbers are indicated with light blue shading.
22 QBO PHASE SEPARATION
23 Bafkin Island North Siberia QBOe: 6.0 ± 2.6 C cc= and p- value QBOw: 2.5 ± 3.7 C cc= and p- value D2 QBOe: 6.7 ± 4.7 C cc=0.59 and p- value QBOw: 0.9 ± 2.7 C cc=0.17 and p- value 0.540
24 CONCLUSIONS SO FAR Northern Hemisphere winter surface temperatures and associated NAO variability are positively correlated with energetic electron precipitation during the last 30 years. Connection is strongly dependent on the QBO phase, so that easterly (at 30 hpa) phase enhances the NAO pattern observed earlier but during westerly phase the effect disappears almost completely. Results are quite similar to those earlier obtained when using geomagnetic activity indices as proxy to EEP. (Quite similar solar cycle variation). The results support the idea that high- speed solar wind streams and related energetic particle precipitation are more important than TSI/UV klux or cosmic rays in modulating Northern Hemisphere winter NAO and associated surface temperatures. V. Maliniemi, T. Asikainen, K. Mursula and A. Seppälä, QBO- dependent relation between electron precipitation and wintertime surface temperature, JGR, DOI: /jgrd.50518, 2013
25 SOLAR CYCLE VARIABILITY SINCE SC 11 (1860S) Several studies have found solar related modulation of Northern Hemisphere winter climate (NAO). Proposed modulating drivers include total solar irradiance and UV irradiance (vary in phase with the solar cycle), galactic cosmic rays (in opposite phase with the solar cycle), geomagnetic activity, magnetospheric energetic particle precipitation (peak in the declining phase) While the effect of the drivers in the same or opposite phase may be difkicult to distinguish, the effects of drivers with different phases can be better separated.
26 SOLAR CYCLE PHASE FUNCTION Four separate phases with a 60 wide window in the phase function (ascending phase centered at 90, maximum at 180, declining at 270 and minimum at 360 /0 ). Only winter months (Dec, Jan, Feb) included. In total 53 winter months in the ascending phase, 69 in the maximum phase, 86 in the declining phase and 71 in the minimum phase. Since cycle 16 the cycles are asymmetric, having longer declining phase than ascending phase (top panel). This is also visible in the numbers of winter months in each phase during each cycle (bottom panel)
27 MEAN WINTER VALUES IN DIFFERENT SOLAR CYCLE PHASES Cosmic rays are in opposite phase with the sunpot cycle. Geomagnetic activity peaks between the maximum and the declining phase. Only EEP and solar wind speed peak in the declining phase.
28 VALUES IN DIFFERENT SOLAR CYCLES AND PHASES Mean winter values of sunspot number, aa index, cosmic ray flux and solar wind speed in the four cycle phases for cycles 11 to 23.
29 TEMPERATURE ANOMALIES DURING DIFFERENT CYCLE PHASES Temperature data is presented as gridded monthly temperature maps in 2 x2 boxes of latitude and longitude since 1880 (NASA GISS temperature record). Mean temperature anomalies (calculated by subtracting 31- year running mean for each month separately in each grid box) in each phase during winter months were calculated for years p- values were calculated by one- sample t- test. Only the declining phase produces the positive NAO temperature pattern at high latitudes with high signi;icance. Maximum phase produces a negative NAO pattern, but with a weak signi;icance.
30 NAO IN Mean winter monthly temperature anomalies during (left) positive NAO and (right) negative NAO. White lines represent 95% conkidence level. White areas denote data gaps of temperature grids with more than 5% of monthly data missing. 3/27/14 31
31 SUMMARY Northern Hemisphere winter surface temperatures and NAO variability are positively correlated with energetic electron precipitation during the last 30 years. Connection is strongly dependent on the QBO phase, so that easterly (at 30 hpa) phase enhances the NAO pattern observed earlier but during westerly phase the effect disappears almost completely. Temperature pattern resembles the pattern associated with positive phase of NAO only during the declining phase of the solar cycle. Declining phase produces the positive NAO for the last 13 cycles, i.e. even during the weak solar cycles around 1900! This supports the similar cycle evolution of coronal holes and the importance of HSS/EEP for NAO. The results support the idea that high- speed solar wind streams and related energetic particle precipitation are more important than TSI/UV klux or cosmic rays in modulating Northern Hemisphere winter NAO and associated surface temperatures. V. Maliniemi, T. Asikainen, K. Mursula and A. Seppälä, JGR, DOI: /jgrd.50518, 2013 V. Maliniemi, T. Asikainen and K. Mursula, Spatial distribution of Northern Hemisphere winter temperatures during different phases of the solar cycle, under review in JGR, 2014
32 THANKS, FOLKS!
Studies on the ionospheric region during low solar activity in Brazil
 Studies on the ionospheric region during low solar activity in Brazil Claudia M. N. Candido National Institute for Space Research - INPE Brazil 1 Plasma Bubbles-Spread-F OI 630.0-nm Peak at 250 km - F-layer
ESCI 107/109 The Atmosphere Lesson 2 Solar and Terrestrial Radiation
 ESCI 107/109 The Atmosphere Lesson 2 Solar and Terrestrial Radiation Reading: Meteorology Today, Chapters 2 and 3 EARTH-SUN GEOMETRY The Earth has an elliptical orbit around the sun The average Earth-Sun
Chapter Overview. Seasons. Earth s Seasons. Distribution of Solar Energy. Solar Energy on Earth. CHAPTER 6 Air-Sea Interaction
 Chapter Overview CHAPTER 6 Air-Sea Interaction The atmosphere and the ocean are one independent system. Earth has seasons because of the tilt on its axis. There are three major wind belts in each hemisphere.
Precipitation, cloud cover and Forbush decreases in galactic cosmic rays. Dominic R. Kniveton 1. Journal of Atmosphere and Solar-Terrestrial Physics
 Precipitation, cloud cover and Forbush decreases in galactic cosmic rays Dominic R. Kniveton 1 Journal of Atmosphere and Solar-Terrestrial Physics 1 School of Chemistry, Physics and Environmental Science,
A review of the fall/winter 2000/01 and comparison with
 A review of the fall/winter 2000/01 and comparison with 1978/79. J. Cohen, AER Inc., jcohen@aer.com A review of fall/winter 2000/01 shows it consistent with the hypothesis that the winter Arctic Oscillation
James Hansen, Reto Ruedy, Makiko Sato, Ken Lo
 If It s That Warm, How Come It s So Damned Cold? James Hansen, Reto Ruedy, Makiko Sato, Ken Lo The past year, 2009, tied as the second warmest year in the 130 years of global instrumental temperature records,
Solar Activity and Earth's Climate
 Rasmus E. Benestad Solar Activity and Earth's Climate Second Edition Published in association with Springer Praxis ids Publishing Publisl PRAXI Chichester, UK Contents Preface to the second edition Preface
Fundamentals of Climate Change (PCC 587): Water Vapor
: Water Vapor") Fundamentals of Climate Change (PCC 587): Water Vapor DARGAN M. W. FRIERSON UNIVERSITY OF WASHINGTON, DEPARTMENT OF ATMOSPHERIC SCIENCES DAY 2: 9/30/13 Water Water is a remarkable molecule Water vapor
Fundamentals of Climate Change (PCC 587): Water Vapor DARGAN M. W. FRIERSON UNIVERSITY OF WASHINGTON, DEPARTMENT OF ATMOSPHERIC SCIENCES DAY 2: 9/30/13 Water Water is a remarkable molecule Water vapor
Seasonal & Daily Temperatures. Seasons & Sun's Distance. Solstice & Equinox. Seasons & Solar Intensity
 Seasonal & Daily Temperatures Seasons & Sun's Distance The role of Earth's tilt, revolution, & rotation in causing spatial, seasonal, & daily temperature variations Please read Chapter 3 in Ahrens Figure
Visualizing of Berkeley Earth, NASA GISS, and Hadley CRU averaging techniques
 Visualizing of Berkeley Earth, NASA GISS, and Hadley CRU averaging techniques Robert Rohde Lead Scientist, Berkeley Earth Surface Temperature 1/15/2013 Abstract This document will provide a simple illustration
Geography affects climate.
 KEY CONCEPT Climate is a long-term weather pattern. BEFORE, you learned The Sun s energy heats Earth s surface unevenly The atmosphere s temperature changes with altitude Oceans affect wind flow NOW, you
Atmospheric Dynamics of Venus and Earth. Institute of Geophysics and Planetary Physics UCLA 2 Lawrence Livermore National Laboratory
 Atmospheric Dynamics of Venus and Earth G. Schubert 1 and C. Covey 2 1 Department of Earth and Space Sciences Institute of Geophysics and Planetary Physics UCLA 2 Lawrence Livermore National Laboratory
A decadal solar effect in the tropics in July August
 Journal of Atmospheric and Solar-Terrestrial Physics 66 (2004) 1767 1778 www.elsevier.com/locate/jastp A decadal solar effect in the tropics in July August Harry van Loon a, Gerald A. Meehl b,, Julie M.
Anyone Else Notice That Its Been Windy Lately?
 National Weather Service Aberdeen, South Dakota January 2014 Inside this issue: Has it Been Windy Lately or What? 2013 Year in Review 2013 Year in Review (cont.) 1 2 3 Has it Been Windy Lately or What?
Solar Forcing of Electron and Ion Auroral Inputs
 Solar Forcing of Electron and Ion Auroral Inputs Barbara A. Emery (NCAR), Ian G. Richardson (GSFC), David S. Evans (NOAA), Frederick J. Rich (LL/MIT), Gordon Wilson (AFRL), Sarah Gibson (NCAR), Giuliana
Jessica Blunden, Ph.D., Scientist, ERT Inc., Climate Monitoring Branch, NOAA s National Climatic Data Center
 Kathryn Sullivan, Ph.D, Acting Under Secretary of Commerce for Oceans and Atmosphere and NOAA Administrator Thomas R. Karl, L.H.D., Director,, and Chair of the Subcommittee on Global Change Research Jessica
2008 Global Surface Temperature in GISS Analysis
 2008 Global Surface Temperature in GISS Analysis James Hansen, Makiko Sato, Reto Ruedy, Ken Lo Calendar year 2008 was the coolest year since 2000, according to the Goddard Institute for Space Studies analysis
RaysWeather.Com 2015-2016 Winter Fearless Forecast
 Author: Dr. Ray Russell Founder and President of RaysWeather.Com Date: October 10, 2015 RaysWeather.Com 2015-2016 Winter Fearless Forecast Background It's that time of year--leaves change, temperatures
ENSO: Recent Evolution, Current Status and Predictions. Update prepared by: Climate Prediction Center / NCEP 29 June 2015
 ENSO: Recent Evolution, Current Status and Predictions Update prepared by: Climate Prediction Center / NCEP 29 June 2015 Outline Summary Recent Evolution and Current Conditions Oceanic Niño Index (ONI)
Tropical Horticulture: Lecture 2
 Lecture 2 Theory of the Tropics Earth & Solar Geometry, Celestial Mechanics The geometrical relationship between the earth and sun is responsible for the earth s climates. The two principal movements of
Daily High-resolution Blended Analyses for Sea Surface Temperature
 Daily High-resolution Blended Analyses for Sea Surface Temperature by Richard W. Reynolds 1, Thomas M. Smith 2, Chunying Liu 1, Dudley B. Chelton 3, Kenneth S. Casey 4, and Michael G. Schlax 3 1 NOAA National
Examining the Recent Pause in Global Warming
 Examining the Recent Pause in Global Warming Global surface temperatures have warmed more slowly over the past decade than previously expected. The media has seized this warming pause in recent weeks,
Orbital-Scale Climate Change
 Orbital-Scale Climate Change Climate Needed for Ice Age Warm winter and non-frozen oceans so lots of evaporation and snowfall Cool summer so that ice does not melt Ice Age Model When ice growing ocean
Sun Earth Relationships
 1 ESCI-61 Introduction to Photovoltaic Technology Sun Earth Relationships Ridha Hamidi, Ph.D. Spring (sun aims directly at equator) Winter (northern hemisphere tilts away from sun) 23.5 2 Solar radiation
Solar Flux and Flux Density. Lecture 3: Global Energy Cycle. Solar Energy Incident On the Earth. Solar Flux Density Reaching Earth
 Lecture 3: Global Energy Cycle Solar Flux and Flux Density Planetary energy balance Greenhouse Effect Vertical energy balance Latitudinal energy balance Seasonal and diurnal cycles Solar Luminosity (L)
Chapter 6: Cloud Development and Forms
 Chapter 6: Cloud Development and Forms (from The Blue Planet ) Why Clouds Form Static Stability Cloud Types Why Clouds Form? Clouds form when air rises and becomes saturated in response to adiabatic cooling.
Temporal and spatial evolution of the Antarctic sea ice prior to the September 2012 record maximum extent
 GEOPHYSICAL RESEARCH LETTERS, VOL. 40, 5894 5898, doi:10.1002/2013gl058371, 2013 Temporal and spatial evolution of the Antarctic sea ice prior to the September 2012 record maximum extent John Turner, 1
Extra-Tropical Cyclones in a Warming Climate:
 Extra-Tropical Cyclones in a Warming Climate: Observational Evidence of Trends in Frequencies and Intensities in the North Pacific, North Atlantic, & Great Lakes Regions David Levinson Scientific Services
- 1 - Jennifer McClure. To: env.essay@physics.org. From: Jennifer McClure (j.m.mcclure@student.liverpool.ac.uk)
") To: env.essay@physics.org Jennifer McClure From: Jennifer McClure (j.m.mcclure@student.liverpool.ac.uk) 1 st year Physics (F300), Department of Physics, University of Liverpool. - 1 - The Northern Lights;
To: env.essay@physics.org Jennifer McClure From: Jennifer McClure (j.m.mcclure@student.liverpool.ac.uk) 1 st year Physics (F300), Department of Physics, University of Liverpool. - 1 - The Northern Lights;
ULTRALONG SOLAR CYCLE 23 AND POSSIBLE CONSEQUENCES
 ULTRALONG SOLAR CYCLE 23 AND POSSIBLE CONSEQUENCES By Joseph D Aleo, CCM WHAT ARE SUNSPOTS? In 1610, shortly after viewing the sun with his new telescope, Galileo Galilei made the first European observations
Temporal variation in snow cover over sea ice in Antarctica using AMSR-E data product
 Temporal variation in snow cover over sea ice in Antarctica using AMSR-E data product Michael J. Lewis Ph.D. Student, Department of Earth and Environmental Science University of Texas at San Antonio ABSTRACT
Was UV spectral solar irradiance lower during the recent low sunspot minimum?
 JOURNAL OF GEOPHYSICAL RESEARCH, VOL. 116,, doi:10.1029/2010jd014746, 2011 Was UV spectral solar irradiance lower during the recent low sunspot minimum? Mike Lockwood 1,2 Received 11 July 2010; revised
Monsoon Variability and Extreme Weather Events
 Monsoon Variability and Extreme Weather Events M Rajeevan National Climate Centre India Meteorological Department Pune 411 005 rajeevan@imdpune.gov.in Outline of the presentation Monsoon rainfall Variability
How Do Oceans Affect Weather and Climate?
 How Do Oceans Affect Weather and Climate? In Learning Set 2, you explored how water heats up more slowly than land and also cools off more slowly than land. Weather is caused by events in the atmosphere.
ATMS 310 Jet Streams
 ATMS 310 Jet Streams Jet Streams A jet stream is an intense (30+ m/s in upper troposphere, 15+ m/s lower troposphere), narrow (width at least ½ order magnitude less than the length) horizontal current
ENSO Cycle: Recent Evolution, Current Status and Predictions. Update prepared by Climate Prediction Center / NCEP 9 May 2011
 ENSO Cycle: Recent Evolution, Current Status and Predictions Update prepared by Climate Prediction Center / NCEP 9 May 2011 Outline Overview Recent Evolution and Current Conditions Oceanic Niño Index (ONI)
Name Period 4 th Six Weeks Notes 2015 Weather
 Name Period 4 th Six Weeks Notes 2015 Weather Radiation Convection Currents Winds Jet Streams Energy from the Sun reaches Earth as electromagnetic waves This energy fuels all life on Earth including the
Global Seasonal Phase Lag between Solar Heating and Surface Temperature
 Global Seasonal Phase Lag between Solar Heating and Surface Temperature Summer REU Program Professor Tom Witten By Abstract There is a seasonal phase lag between solar heating from the sun and the surface
Statistical analysis of total column ozone data
 Statistical analysis of total column ozone data Jurrien Knibbe De Bilt, 2 Trainee report Statistical analysis of total column ozone data Version Date March 27, 2 Status Final Statistical analysis of
Solar Heating Basics. 2007 Page 1. a lot on the shape, colour, and texture of the surrounding
 2007 Page 1 Solar Heating Basics Reflected radiation is solar energy received by collectorsfrom adjacent surfaces of the building or ground. It depends a lot on the shape, colour, and texture of the surrounding
Supporting Online Material for
 www.sciencemag.org/cgi/content/full/science.1182274/dc1 Supporting Online Material for Asian Monsoon Transport of Pollution to the Stratosphere William J. Randel,* Mijeong Park, Louisa Emmons, Doug Kinnison,
Solar wind - atmospheric electricity - cloud microphysics connections to weather
 ISSI, Bern, Switzerland January 2015 Solar wind - atmospheric electricity - cloud microphysics connections to weather Mai Mai Lam (BAS) Brian A. Tinsley (University of Texas at Dallas) Outline Aerosols,
The Four Seasons. A Warm Up Exercise. A Warm Up Exercise. A Warm Up Exercise. The Moon s Phases
 The Four Seasons A Warm Up Exercise What fraction of the Moon s surface is illuminated by the Sun (except during a lunar eclipse)? a) Between zero and one-half b) The whole surface c) Always half d) Depends
SPACE WEATHER INTERPRETING THE WIND. Petra Vanlommel & Luciano Rodriguez
 SPACE WEATHER INTERPRETING THE WIND Petra Vanlommel & Luciano Rodriguez THE SUN LOSES ENERGY Radiation Mass Particles THE SUN LOSES ENERGY PHYSICAL REPHRASING Total Solar Irradiance Solar Wind Fast Particles
Antarctic Temperature and Sea Ice Trends over the Last Century
 Antarctic Temperature and Sea Ice Trends over the Last Century High latitude regions of the Earth (the Arctic and Antarctic) have been considered as bellwethers in the detection of global climate change.
DIURNAL CYCLE OF CLOUD SYSTEM MIGRATION OVER SUMATERA ISLAND
 DIURNAL CYCLE OF CLOUD SYSTEM MIGRATION OVER SUMATERA ISLAND NAMIKO SAKURAI 1, FUMIE MURATA 2, MANABU D. YAMANAKA 1,3, SHUICHI MORI 3, JUN-ICHI HAMADA 3, HIROYUKI HASHIGUCHI 4, YUDI IMAN TAUHID 5, TIEN
Development of an Integrated Data Product for Hawaii Climate
 Development of an Integrated Data Product for Hawaii Climate Jan Hafner, Shang-Ping Xie (PI)(IPRC/SOEST U. of Hawaii) Yi-Leng Chen (Co-I) (Meteorology Dept. Univ. of Hawaii) contribution Georgette Holmes
Climate Change. Lauma M. Jurkevics - DWR, Southern Region Senior Environmental Scientist
 Climate Change A n o t h e r F a c t o r i n M a n a g i n g S o u t h e r n C a l i f o r n i a s W a t e r R e s o u r c e s Lauma M. Jurkevics - DWR, Southern Region Senior Environmental Scientist USEPA-Region
List 10 different words to describe the weather in the box, below.
 Weather and Climate Lesson 1 Web Quest: What is the Weather? List 10 different words to describe the weather in the box, below. How do we measure the weather? Use this web link to help you: http://www.bbc.co.uk/weather/weatherwise/activities/weatherstation/
Chapter 3: Weather Map. Weather Maps. The Station Model. Weather Map on 7/7/2005 4/29/2011
 Chapter 3: Weather Map Weather Maps Many variables are needed to described weather conditions. Local weathers are affected by weather pattern. We need to see all the numbers describing weathers at many
Renewable Energy. Solar Power. Courseware Sample 86352-F0
 Renewable Energy Solar Power Courseware Sample 86352-F0 A RENEWABLE ENERGY SOLAR POWER Courseware Sample by the staff of Lab-Volt Ltd. Copyright 2009 Lab-Volt Ltd. All rights reserved. No part of this
163 ANALYSIS OF THE URBAN HEAT ISLAND EFFECT COMPARISON OF GROUND-BASED AND REMOTELY SENSED TEMPERATURE OBSERVATIONS
 ANALYSIS OF THE URBAN HEAT ISLAND EFFECT COMPARISON OF GROUND-BASED AND REMOTELY SENSED TEMPERATURE OBSERVATIONS Rita Pongrácz *, Judit Bartholy, Enikő Lelovics, Zsuzsanna Dezső Eötvös Loránd University,
The ozone hole indirect effect: Cloud-radiative anomalies accompanying the poleward shift of the eddy-driven jet in the Southern Hemisphere
 GEOPHYSICAL RESEARCH LETTERS, VOL., 1 5, doi:1.1/grl.575, 1 The ozone hole indirect effect: Cloud-radiative anomalies accompanying the poleward shift of the eddy-driven jet in the Southern Hemisphere Kevin
Clouds and the Energy Cycle
 August 1999 NF-207 The Earth Science Enterprise Series These articles discuss Earth's many dynamic processes and their interactions Clouds and the Energy Cycle he study of clouds, where they occur, and
Climate Extremes Research: Recent Findings and New Direc8ons
 Climate Extremes Research: Recent Findings and New Direc8ons Kenneth Kunkel NOAA Cooperative Institute for Climate and Satellites North Carolina State University and National Climatic Data Center h#p://assessment.globalchange.gov
Near Real Time Blended Surface Winds
 Near Real Time Blended Surface Winds I. Summary To enhance the spatial and temporal resolutions of surface wind, the remotely sensed retrievals are blended to the operational ECMWF wind analyses over the
Data Sets of Climate Science
 The 5 Most Important Data Sets of Climate Science Photo: S. Rahmstorf This presentation was prepared on the occasion of the Arctic Expedition for Climate Action, July 2008. Author: Stefan Rahmstorf, Professor
How to analyze synoptic-scale weather patterns Table of Contents
 How to analyze synoptic-scale weather patterns Table of Contents Before You Begin... 2 1. Identify H and L pressure systems... 3 2. Locate fronts and determine frontal activity... 5 3. Determine surface
Solar Storms and Northern lights - how to predict Space Weather and the Aurora
 Solar Storms and Northern lights - how to predict Space Weather and the Aurora Pål Brekke Norwegian Space Centre/UNIS Pål Brekke torsdag 12. mars 15 Fleet of satellites watching the Sun Stereo SDO SOHO
We already went through a (small, benign) climate change in The Netherlands
 climate change in The Netherlands") We already went through a (small, benign) climate change in The Netherlands 15-16 October 1987, gusts till 220 km/h, great damage 2004, almost 1400 tornado s December (!!) 2001, Faxai, 879 mbar 27 December
We already went through a (small, benign) climate change in The Netherlands 15-16 October 1987, gusts till 220 km/h, great damage 2004, almost 1400 tornado s December (!!) 2001, Faxai, 879 mbar 27 December
Stratosphere-Troposphere Exchange in the Tropics. Masatomo Fujiwara Hokkaido University, Japan (14 March 2006)
") Stratosphere-Troposphere Exchange in the Tropics Masatomo Fujiwara Hokkaido University, Japan (14 March 2006) Contents 1. Structure of Tropical Atmosphere 2. Water Vapor in the Stratosphere 3. General
Stratosphere-Troposphere Exchange in the Tropics Masatomo Fujiwara Hokkaido University, Japan (14 March 2006) Contents 1. Structure of Tropical Atmosphere 2. Water Vapor in the Stratosphere 3. General
Multi-decadal modulations in the Aleutian-Icelandic Low seesaw and the axial symmetry of the Arctic Oscillation
 1 2 3 4 5 6 Multi-decadal modulations in the Aleutian-Icelandic Low seesaw and the axial symmetry of the Arctic Oscillation signature, as revealed in the 20th century reanalysis 7 8 9 10 Ning Shi 1* and
Southern AER Atmospheric Education Resource
 Southern AER Atmospheric Education Resource Vol. 9 No. 5 Spring 2003 Editor: Lauren Bell In this issue: g Climate Creations exploring mother nature s remote control for weather and Climate. g Crazy Climate
2. The map below shows high-pressure and low-pressure weather systems in the United States.
 1. Which weather instrument has most improved the accuracy of weather forecasts over the past 40 years? 1) thermometer 3) weather satellite 2) sling psychrometer 4) weather balloon 6. Wind velocity is
CHAPTER 5 Lectures 10 & 11 Air Temperature and Air Temperature Cycles
 CHAPTER 5 Lectures 10 & 11 Air Temperature and Air Temperature Cycles I. Air Temperature: Five important factors influence air temperature: A. Insolation B. Latitude C. Surface types D. Coastal vs. interior
W.C. Rusty Riese, PhD Adjunct Professor, Rice University
 W.C. Rusty Riese, PhD Adjunct Professor, Rice University What are we being told? What are the data? What are the take-aways? What are your responsibilities? Mann Hockey Stick Curve The Arctic is melting
The Sun, Solar Analogs and the Climate
 The Sun, Solar Analogs and the Climate Swiss Society for Astrophysics and Astronomy 34 th Saas-Fee Advanced Course Davos, Switzerland 15-20 March 2004 Climate lectures Joanna D. Haigh Imperial College
Space Weather: Forecasting & Impacts on Critical Infrastructure
 Space Weather: Forecasting & Impacts on Critical Infrastructure Dr. Genene Fisher Senior Advisor for Space Weather National Weather Service AMS Washington Forum 12 April 2012 Outline Solar Activity Update
Hurricanes. Characteristics of a Hurricane
 Hurricanes Readings: A&B Ch. 12 Topics 1. Characteristics 2. Location 3. Structure 4. Development a. Tropical Disturbance b. Tropical Depression c. Tropical Storm d. Hurricane e. Influences f. Path g.
A study of long-term climatology of ionospheric irregularities by using GPS phase fluctuations at the Brazilian longitudes
 Advances in Space Research xxx (2007) xxx xxx www.elsevier.com/locate/asr A study of long-term climatology of ionospheric irregularities by using GPS phase fluctuations at the Brazilian longitudes F.D.
Space Weather Research and Forecasting in CRL, Japan
 Space Weather Research and Forecasting in CRL, Japan Maki Akioka Hiraiso Solar Observatory Communications Research Laboratory Contact akioka@crl.go.jp 1 Contents of Presentation 1.Space Weather Observation
Can latent heat release have a negative effect on polar low intensity?
 Can latent heat release have a negative effect on polar low intensity? Ivan Føre, Jon Egill Kristjansson, Erik W. Kolstad, Thomas J. Bracegirdle and Øyvind Sætra Polar lows: are intense mesoscale cyclones
Ensuring the Preparedness of Users: NOAA Satellites GOES R, JPSS Laura K. Furgione
 Ensuring the Preparedness of Users: NOAA Satellites GOES R, JPSS Laura K. Furgione U.S. Permanent Representative with the WMO Deputy Director, NOAA s s National Weather Service WMO Executive Council 65
STATUS AND RESULTS OF OSEs. (Submitted by Dr Horst Böttger, ECMWF) Summary and Purpose of Document
 Summary and Purpose of Document") WORLD METEOROLOGICAL ORGANIZATION COMMISSION FOR BASIC SYSTEMS OPEN PROGRAMMME AREA GROUP ON INTEGRATED OBSERVING SYSTEMS EXPERT TEAM ON OBSERVATIONAL DATA REQUIREMENTS AND REDESIGN OF THE GLOBAL OBSERVING
WORLD METEOROLOGICAL ORGANIZATION COMMISSION FOR BASIC SYSTEMS OPEN PROGRAMMME AREA GROUP ON INTEGRATED OBSERVING SYSTEMS EXPERT TEAM ON OBSERVATIONAL DATA REQUIREMENTS AND REDESIGN OF THE GLOBAL OBSERVING
Present trends and climate change projections for the Mediterranean region
 Present trends and climate change projections for the Mediterranean region Prof. Piero Lionello, piero.lionello@unile.it Science of Materials Department, University of Salento, Italy Plan of the talk:
Earth-Sun Relationships. The Reasons for the Seasons
 Earth-Sun Relationships The Reasons for the Seasons Solar Radiation The earth intercepts less than one two-billionth of the energy given off by the sun. However, the radiation is sufficient to provide
Space Weather: An Introduction C. L. Waters. Centre for Space Physics University of Newcastle, Australia
 Space Weather: An Introduction C. L. Waters Centre for Space Physics University of Newcastle, Australia 1 Outline Space weather: Conditions on the Sun and in the solar wind, magnetosphere, ionosphere and
Full credit for this chapter to Prof. Leonard Bachman of the University of Houston
 Chapter 6: SOLAR GEOMETRY Full credit for this chapter to Prof. Leonard Bachman of the University of Houston SOLAR GEOMETRY AS A DETERMINING FACTOR OF HEAT GAIN, SHADING AND THE POTENTIAL OF DAYLIGHT PENETRATION...
WEATHER AND CLIMATE practice test
 WEATHER AND CLIMATE practice test Multiple Choice Identify the choice that best completes the statement or answers the question. 1. What role does runoff play in the water cycle? a. It is the process in
Unusual declining phase of solar cycle 23: Weak semi-annual variations of auroral hemispheric power and geomagnetic activity
 Click Here for Full Article GEOPHYSICAL RESEARCH LETTERS, VOL. 36, L22102, doi:10.1029/2009gl040825, 2009 Unusual declining phase of solar cycle 23: Weak semi-annual variations of auroral hemispheric power
Intra-seasonal and Annual variability of the Agulhas Current from satellite observations
 Intra-seasonal and Annual variability of the Agulhas Current from satellite observations Marjolaine Krug Ecosystem Earth Observation (CSIR NRE) Pierrick Penven Laboratoire de Physique des Océans (IRD)
Can cosmic rays affect cloud condensation nuclei by altering new particle formation rates?
 Click Here for Full Article GEOPHYSICAL RESEARCH LETTERS, VOL. 36, L09820, doi:10.1029/2009gl037946, 2009 Can cosmic rays affect cloud condensation nuclei by altering new particle formation rates? J. R.
Radiative effects of clouds, ice sheet and sea ice in the Antarctic
 Snow and fee Covers: Interactions with the Atmosphere and Ecosystems (Proceedings of Yokohama Symposia J2 and J5, July 1993). IAHS Publ. no. 223, 1994. 29 Radiative effects of clouds, ice sheet and sea
Lab Activity on Global Wind Patterns
 Lab Activity on Global Wind Patterns 2002 Ann Bykerk-Kauffman, Dept. of Geological and Environmental Sciences, California State University, Chico * Objectives When you have completed this lab you should
Chapter 3: Weather Map. Station Model and Weather Maps Pressure as a Vertical Coordinate Constant Pressure Maps Cross Sections
 Chapter 3: Weather Map Station Model and Weather Maps Pressure as a Vertical Coordinate Constant Pressure Maps Cross Sections Weather Maps Many variables are needed to described dweather conditions. Local
Solar Irradiance Variability
 Solar Radiative Output and its Variability Claus Frölich and Judith Lean Preethi Ganapathy November 22, 2005 Solar Irradiance Variability Historical Investigations Contemporary Investigations Limitations
6. The greatest atmospheric pressure occurs in the 1) troposphere 3) mesosphere 2) stratosphere 4) thermosphere
 troposphere 3) mesosphere 2) stratosphere 4) thermosphere") 1. The best evidence of the Earth's nearly spherical shape is obtained through telescopic observations of other planets photographs of the Earth from an orbiting satellite observations of the Sun's altitude
1. The best evidence of the Earth's nearly spherical shape is obtained through telescopic observations of other planets photographs of the Earth from an orbiting satellite observations of the Sun's altitude
UCCS PES/ENSC 2500: Renewable Energy Spring 2014 Test 3 name:
 UCCS PES/ENSC 2500: Renewable Energy Spring 2014 Test 3 name: 1. When a wind turbine is positioned between radio, television or microwave transmitter and receiver it can sometime reflect some of the in
2015 Climate Review for Puerto Rico and the U.S. Virgin Islands. Odalys Martínez-Sánchez
 2015 Climate Review for Puerto Rico and the U.S. Virgin Islands. Odalys Martínez-Sánchez 2015 can be described as a dry and hot year across Puerto Rico (PR) and the U.S. Virgin Islands (USVI). Below normal
Chapter 2: Solar Radiation and Seasons
 Chapter 2: Solar Radiation and Seasons Spectrum of Radiation Intensity and Peak Wavelength of Radiation Solar (shortwave) Radiation Terrestrial (longwave) Radiations How to Change Air Temperature? Add
The solar wind (in 90 minutes) Mathew Owens
 Mathew Owens") The solar wind (in 90 minutes) Mathew Owens 5 th Sept 2013 STFC Advanced Summer School m.j.owens@reading.ac.uk Overview There s simply too much to cover in 90 minutes Hope to touch on: Formation of the
The solar wind (in 90 minutes) Mathew Owens 5 th Sept 2013 STFC Advanced Summer School m.j.owens@reading.ac.uk Overview There s simply too much to cover in 90 minutes Hope to touch on: Formation of the
CLIMATE, WATER & LIVING PATTERNS THINGS
 CLIMATE, WATER & LIVING PATTERNS NAME THE SIX MAJOR CLIMATE REGIONS DESCRIBE EACH CLIMATE REGION TELL THE FIVE FACTORS THAT AFFECT CLIMATE EXPLAIN HOW THOSE FACTORS AFFECT CLIMATE DESCRIBE HOW CLIMATES
7613-1 - Page 1. Weather Unit Exam Pre-Test Questions
 Weather Unit Exam Pre-Test Questions 7613-1 - Page 1 Name: 1) Equal quantities of water are placed in four uncovered containers with different shapes and left on a table at room temperature. From which
State of the Art of Mesospheric Modeling
 State of the Art of Mesospheric Modeling David E. Siskind Upper Atmospheric Physics Branch Space Science Division, Code 7640 202-767-0928 Siskind@nrl.navy.mil Overview: Focus on three dimensional global
Water & Climate Review
 Water & Climate Review 1. The cross section below shows the direction of air flowing over a mountain. Points A and B are at the same elevation on opposite sides of the mountain. 4. The graph below shows
Possible causes of decreasing cloud cover in the Arctic winter, 1982 2000
 Click Here for Full Article GEOPHYSICAL RESEARCH LETTERS, VOL. 34, L14705, doi:10.1029/2007gl030042, 2007 Possible causes of decreasing cloud cover in the Arctic winter, 1982 2000 Yinghui Liu, 1 Jeffrey
The Earth's Atmosphere. Layers of the Earth's Atmosphere
 The Earth's Atmosphere The atmosphere surrounds Earth and protects us by blocking out dangerous rays from the sun. The atmosphere is a mixture of gases that becomes thinner until it gradually reaches space.
Solar atmosphere. Solar activity and solar wind. Reading for this week: Chap. 6.2, 6.3, 6.5, 6.7 Homework #2 (posted on website) due Oct.
 due Oct.") Solar activity and solar wind Solar atmosphere Reading for this week: Chap. 6.2, 6.3, 6.5, 6.7 Homework #2 (posted on website) due Oct. 17 Photosphere - visible surface of sun. Only ~100 km thick. Features
Solar activity and solar wind Solar atmosphere Reading for this week: Chap. 6.2, 6.3, 6.5, 6.7 Homework #2 (posted on website) due Oct. 17 Photosphere - visible surface of sun. Only ~100 km thick. Features
Frequently Asked Questions
 From the report accepted by Working Group I of the Intergovernmental Panel on Climate Change but not approved in detail Frequently Asked Questions FAQ Citation: These Frequently Asked Questions have been