Activity 8 Drawing Isobars Level 2
|
|
|
- Bernice Hopkins
- 7 years ago
- Views:
Transcription
1 Activity 8 Drawing Isobars Level 2 Objectives: 1. Students will be able to define and draw isobars to analyze air pressure variations. 2. Students will be able to identify highs and lows on the analyzed maps. National Science Standards: As a result of activities in grades 5-8, all students should develop an understanding of: structure of earth system, science and technology, risks and benefits, and science and technology in society. Engage: In order to understand air pressure patterns, it is necessary to have the ability to decode or analyze the symbols on the weather map. Look at the following sample station plot. What was the weather at this station at the time the observations were made? (Students should know that the wind was about 20 knots from the southwest, sky was overcast, and there were rain showers. The information given by the number 998 is likely new to them. For more information about air pressure, see the Background Information section) You know that the number 71 represents the dew point temperature and 77 represents the air temperature-- both in degrees Fahrenheit. So what doe the 998 represent? It gives the pressure in millibars. A surface map gives the sea level pressure and is corrected for altitude. Decoding this pressure is relatively simple to do. If the three-digit number is 499 or less, place a 10 in front of it. If it is 500 or greater, place a 9 in front of it. Also, put a decimal point before the last digit. This will give the pressure in millibars (mb). In the example above, 998 is equal to 999.8mb. If the 3-digit code were 275, the decoded pressure is simply mb. 1. Decode the following pressures: 325 = mb mb = 930 = mb 976.2mb = 560 = mb 990.3mb = 870 = mb mb =

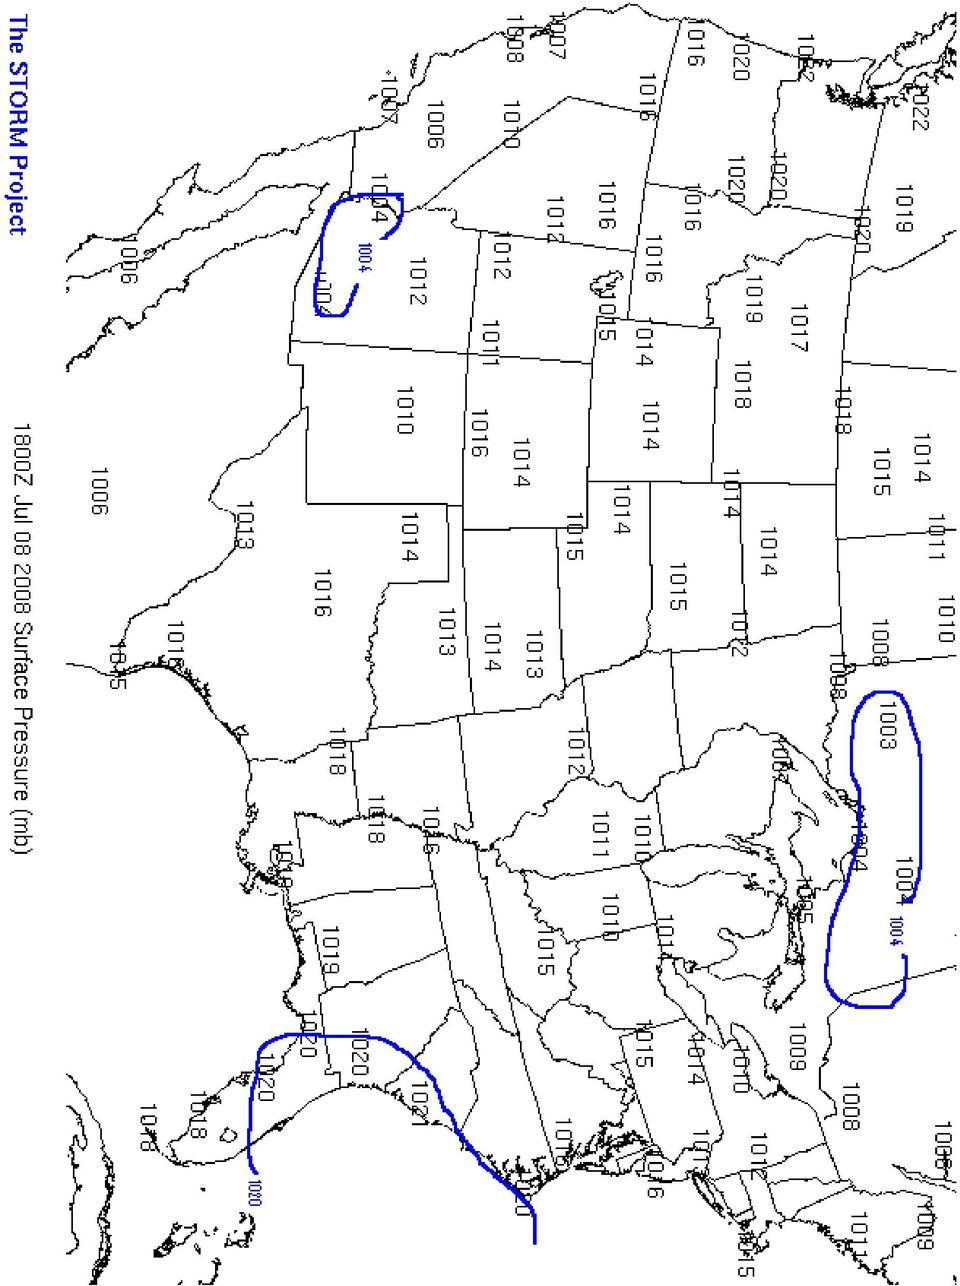
2 Explore: Access the activity website: Click on the Surface Pressures link. Then click on the next link. Carefully observe each of the pressure maps that are available. Write down similarities and differences that you detect between the maps. Have students share their individual observations with others in the class. (You may choose to do small groups or the class as a whole. The first map shows pressures in millibars, and the second shows isobars drawn on the map in four-millibar intervals. Isobars connect areas of similar barometric pressure.) Explain: Tell students that the second pressure map website shows bands of pressures within 4-mb intervals. Isobar is the name given to the lines on the map. Iso means same, and therm can be interpreted as temperature. Therefore Isotherm means same temperature. Isotherms drawn on temperature maps connect equal temperatures. Here are some helpful hints: 1. Isobars are drawn in 4-millibar intervals. 2. Always label the isobar value. 3. Pressures lower than the isobar value are always on one side of the isobar and higher pressures are consistently on the other side. 4. Draw an isobar until it reaches the end of the plotted data or closes off a loop as it encircles data. (The map shows students an example of a closed-loop isobar) 5. Neighboring isobars tend to take similar paths. 6. Isobars never cross and never split or fork. 7. Do not skip isobar values if they fall within the pressure range on the map. 8. When the highest or lowest pressure values reported on the map are equal to an isobar value, do not draw the isobar. If a pressure value appears abnormally out of place, just circle that value. 9. More than one isobar of the same value can appear on a map. Tell students they will draw isobars to analyze pressure variations on surface temperature map from July 8, Help your students understand how the sample isobars were drawn and assist them as needed with the rest of the process. 1. The attached image is a plot of Surface Pressures for 1800Z, July 6, You are going to do an analysis of the pressures on this map. The first step in this analysis is to find the lowest and highest reported pressure values. Lightly place a circle around each highest and lowest pressure value. The lowest pressure shown on the map is mb and the highest is mb. 2. Using a 4 mb interval for the analysis, complete the sequence of isobars (line of equal pressure) that would appear at least once on the pressure plot: 1004, 1008,,,. 3. Two examples of isobars appear on the map. In the Southwestern United States, and in the Great Lakes area, 1004 mb isobar show example of closed loop isobars. The second example is the 1020 mb isobar along the Atlantic Coast. 4. Draw more isobars to show pressure patterns at map time. Work through the following steps to complete a temperature analysis on the surface temperature plot.

3 5. Label the highest-pressure area on the map with a large capitol H. 6. Label the lowest pressure area on the map with a large capitol L. Extend: Using similar procedures draw isobars on a map provided by your teacher. EVALUATE: Student progress must be closely monitored while completing the practice maps. It is easy for them to become frustrated on this. Their maps must be analyzed and graded with an open mind until they have mastered drawing isobars. Final maps and worksheets will be graded. Here is a sample analysis of the map provided to the students: For Further Inquiry: How do pressure patterns change during a five-day period? Challenge students to design an investigation to answer this or any other question they have about pressure and isobars.

4 Science Background: The particles that make up the various layers in the atmosphere are always moving in random directions. Despite their tiny size, when they strike a surface they exert pressure. Each particle is too small to feel and only exerts a tiny bit of pressure. However, when we add up the all the pressures from the large number of particles that strike a surface each moment, then the total pressure is considerable. This is air pressure. As the density of the air increases, then the number of strikes per unit of time and area also increases. Since the particles move in all directions, they can even exert air pressure upwards as they smash into object from underneath. Air pressure can be exerted in all directions. As elevation above Earth s surface increases, the number of particles decreases and the density of air therefore is less, meaning a decrease in air pressure. In fact, while the atmosphere extends more than 15 miles (24 km) up, one half of the air particles in the atmosphere are contained within the first 18,000 feet (5.6 km). Because of this decrease in pressure with height, it makes it very hard to compare the air pressure at one location to another, especially when the elevations of each site differ. Therefore, to give meaning to the pressure values observed at each station, we need to convert the station air pressures reading to a value with a common dominator. The common dominator we use is the sea level. At observation stations around the world, through a series of calculations, the air pressure reading, regardless of the station elevation, is converted a value that would be observed if that instrument were located at sea level. In the International Space Station, the density of the air is maintained so that it is similar to the density at the earth's surface. Therefore, the air pressure is the same in the space station as the earth's surface (14.7 pounds per square inch). The two most common units in the United States to measure the pressure are "Inches of Mercury" and "Millibars". The term Inches of mercury refers to the height of a column of mercury measured in hundredths of inches. This is what you will usually hear from the NOAA Weather Radio or from your favorite weather or news source. At sea level, standard air pressure in inches of mercury is Millibar comes from the original term for pressure "bar". Bar is from the Greek "báros" meaning weight. A millibar is 1/1000th of a bar and is approximately equal to 1000 dynes (one dyne is the amount of force it takes to accelerate an object weighing one gram, one centimeter, in one second). Millibar values, used in meteorology, range from about 100 to At sea level, standard air pressure in millibars is Weather maps showing the pressure at the surface are drawn using millibars. Although the changes are usually too slow to observe directly, air pressure is almost always changing. This change in pressure is caused by changes in air density, and air density is related to temperature.

5 Warm air is less dense than cooler air because the particles in warm air have a greater velocity and are farther apart than in cooler air. So, while the average altitude of the 500-millibar level is around 18,000 feet (5,600 meters) the actual elevation will be higher in warm air than in cold air. The most basic change in pressure is the twice daily rise and fall in due to the heating from the sun. Each day, around 4 a.m./p.m. the pressure is at it s lowest and near its peak around 10 a.m./p.m. The magnitude of the daily cycle are greatest near the equator decreasing toward the poles. On top of the daily fluctuations are the larger pressure changes as a result of the migrating weather systems. Weather systems are identified by the blue H's and red L's drawn on weather maps. The H's represent the location of the area of highest pressure. The L's represent the position of the lowest pressure.

6 Activity 8 Drawing Isobars Student Sheets Engage: In order to understand air pressure patterns, it is necessary to have the ability to decode or analyze the symbols on the weather map. Look at the following sample station plot. What was the weather at this station at the time the observations were made? You know that the number 71 represents the dew point temperature and 77 represents the air temperature-- both in degrees Fahrenheit. So what doe the 998 represent? It gives the pressure in millibars. A surface map gives the sea level pressure and is corrected for altitude. Decoding this pressure is relatively simple to do. If the three-digit number is 499 or less, place a 10 in front of it. If it is 500 or greater, place a 9 in front of it. Also, put a decimal point before the last digit. This will give the pressure in millibars (mb). In the example above, 998 is equal to 999.8mb. If the 3-digit code were 275, the decoded pressure is simply mb. Explore: 1. Decode the following pressures: 325 = mb mb = 930 = mb 976.2mb = 560 = mb 990.3mb = 870 = mb mb = Access the activity website: Click on the Surface Pressures link. Then click on the next link. Carefully observe each of the pressure maps that are available. Write down similarities and differences that you detect between the maps. Explain: The second pressure map website shows lines of pressures within 4-mb intervals. Isobar is the name given to the lines on the map. Iso means same, and therm can be interpreted as temperature. Therefore Isotherm means same temperature. Isotherms drawn on temperature maps connect equal temperatures. Here are some helpful hints:

7 1. Isobars are drawn in 4-millibar intervals. 2. Always label the isobar value. 3. Pressures lower than the isobar value are always on one side of the isobar and higher pressures are consistently on the other side. 4. Draw an isobar until it reaches the end of the plotted data or closes off a loop as it encircles data. (The map shows students an example of a closed-loop isobar) 5. Neighboring isobars tend to take similar paths. 6. Isobars never cross and never split or fork. 7. Do not skip isobar values if they fall within the pressure range on the map. 8. When the highest or lowest pressure values reported on the map are equal to an isobar value, do not draw the isobar. If a pressure value appears abnormally out of place, just circle that value. 9. More than one isobar of the same value can appear on a map. You will now analyze a surface map to reveal surface pressure patterns: 1. The attached image is a plot of Surface Pressures for 1800Z, July 6, You are going to do an analysis of the pressures on this map. The first step in this analysis is to find the lowest and highest reported pressure values. Lightly place a circle around each highest and lowest pressure value. The lowest pressure shown on the map is mb and the highest is mb. 2. Using a 4 mb interval for the analysis, complete the sequence of isobars (line of equal pressure) that would appear at least once on the pressure plot: 1004, 1008,,,. 3. Two examples of isobars appear on the map. In the Southwestern United States, and in the Great Lakes area, 1004 mb isobar show example of closed loop isobars. The second example is the 1020 mb isobar along the Atlantic Coast. 4. Draw more isobars to show pressure patterns at map time. Work through the following steps to complete a temperature analysis on the surface temperature plot. 5. Label the highest-pressure area on the map with a large capitol H. 6. Label the lowest pressure area on the map with a large capitol L. Extend: Using similar procedures, draw isobars on a map provided by your teacher.

8
Name: OBJECTIVES Correctly define: WEATHER BASICS: STATION MODELS: MOISTURE: PRESSURE AND WIND: Weather
 Name: OBJECTIVES Correctly define: air mass, air pressure, anemometer, barometer, cyclone, dew point, front, isobar, isotherm, meteorology, precipitation, psychrometer, relative humidity, saturated, transpiration
Chapter 3: Weather Map. Weather Maps. The Station Model. Weather Map on 7/7/2005 4/29/2011
 Chapter 3: Weather Map Weather Maps Many variables are needed to described weather conditions. Local weathers are affected by weather pattern. We need to see all the numbers describing weathers at many
Chapter 3: Weather Map. Station Model and Weather Maps Pressure as a Vertical Coordinate Constant Pressure Maps Cross Sections
 Chapter 3: Weather Map Station Model and Weather Maps Pressure as a Vertical Coordinate Constant Pressure Maps Cross Sections Weather Maps Many variables are needed to described dweather conditions. Local
FOR TEACHERS ONLY. The University of the State of New York REGENTS HIGH SCHOOL EXAMINATION PHYSICAL SETTING/EARTH SCIENCE
 FOR TEACHERS ONLY PS ES The University of the State of New York REGENTS HIGH SCHOOL EXAMINATION PHYSICAL SETTING/EARTH SCIENCE Tuesday, June 22, 2010 9:15 a.m. to 12:15 p.m., only SCORING KEY AND RATING
2. The map below shows high-pressure and low-pressure weather systems in the United States.
 1. Which weather instrument has most improved the accuracy of weather forecasts over the past 40 years? 1) thermometer 3) weather satellite 2) sling psychrometer 4) weather balloon 6. Wind velocity is
Air Masses and Fronts
 Air Masses and Fronts Air Masses The weather of the United States east of the Rocky Mountains is dominated by large masses of air that travel south from the wide expanses of land in Canada, and north from
Chapter 4 Atmospheric Pressure and Wind
 Chapter 4 Atmospheric Pressure and Wind Understanding Weather and Climate Aguado and Burt Pressure Pressure amount of force exerted per unit of surface area. Pressure always decreases vertically with height
Name Date Class. As you read about the properties of air, fill in the detail boxes that explain the main idea in the graphic organizer below.
 Name Date Class The Atmosphere Guided Reading and Study Air Pressure This section describes several properties of air, including density and air pressure. The section also explains how air pressure is
SIXTH GRADE WEATHER 1 WEEK LESSON PLANS AND ACTIVITIES
 SIXTH GRADE WEATHER 1 WEEK LESSON PLANS AND ACTIVITIES WATER CYCLE OVERVIEW OF SIXTH GRADE WATER WEEK 1. PRE: Evaluating components of the water cycle. LAB: Experimenting with porosity and permeability.
7613-1 - Page 1. Weather Unit Exam Pre-Test Questions
 Weather Unit Exam Pre-Test Questions 7613-1 - Page 1 Name: 1) Equal quantities of water are placed in four uncovered containers with different shapes and left on a table at room temperature. From which
Pressure & Density. Pressure is defined as force divided by area (force/area) One can also assume that pressure = weight/area.
 One can also assume that pressure = weight/area.") Drillingformulas.com Kurtus Pressure is defined as force divided by area (force/area) One can also assume that pressure = weight/area 1 The Weather Channel Air pressure is considered to be the weight of
Drillingformulas.com Kurtus Pressure is defined as force divided by area (force/area) One can also assume that pressure = weight/area 1 The Weather Channel Air pressure is considered to be the weight of
Winds. Winds on a weather map are represented by wind barbs; e.g., Notes:
 Winds Winds on a weather map are represented by wind barbs; e.g., flag half flag pennant wind direction The wind is blowing from the side with the flags and pennants (think an arrow with feathers) Speeds
6 th Grade Science Assessment: Weather & Water Select the best answer on the answer sheet. Please do not make any marks on this test.
 Select the be answer on the answer sheet. Please do not make any marks on this te. 1. Weather is be defined as the A. changes that occur in cloud formations from day to day. B. amount of rain or snow that
How Do Oceans Affect Weather and Climate?
 How Do Oceans Affect Weather and Climate? In Learning Set 2, you explored how water heats up more slowly than land and also cools off more slowly than land. Weather is caused by events in the atmosphere.
CHAPTER 5 Lectures 10 & 11 Air Temperature and Air Temperature Cycles
 CHAPTER 5 Lectures 10 & 11 Air Temperature and Air Temperature Cycles I. Air Temperature: Five important factors influence air temperature: A. Insolation B. Latitude C. Surface types D. Coastal vs. interior
Basics of weather interpretation
 Basics of weather interpretation Safety at Sea Seminar, April 2 nd 2016 Dr. Gina Henderson Oceanography Dept., USNA ghenders@usna.edu Image source: http://earthobservatory.nasa.gov/naturalhazards/view.php?id=80399,
barometer 1 of 5 For the complete encyclopedic entry with media resources, visit: http://education.nationalgeographic.com/encyclopedia/barometer/
 This website would like to remind you: Your browser (Apple Safari 4) is out of date. Update your browser for more security, comfort and the best experience on this site. Encyclopedic Entry For the complete
EXPLANATION OF WEATHER ELEMENTS AND VARIABLES FOR THE DAVIS VANTAGE PRO 2 MIDSTREAM WEATHER STATION
 EXPLANATION OF WEATHER ELEMENTS AND VARIABLES FOR THE DAVIS VANTAGE PRO 2 MIDSTREAM WEATHER STATION The Weather Envoy consists of two parts: the Davis Vantage Pro 2 Integrated Sensor Suite (ISS) and the
AIRCRAFT PERFORMANCE Pressure Altitude And Density Altitude
 Performance- Page 67 AIRCRAFT PERFORMANCE Pressure Altitude And Density Altitude Pressure altitude is indicated altitude corrected for nonstandard pressure. It is determined by setting 29.92 in the altimeter
UNIT 6a TEST REVIEW. 1. A weather instrument is shown below.
 UNIT 6a TEST REVIEW 1. A weather instrument is shown below. Which weather variable is measured by this instrument? 1) wind speed 3) cloud cover 2) precipitation 4) air pressure 2. Which weather station
Name Period 4 th Six Weeks Notes 2015 Weather
 Name Period 4 th Six Weeks Notes 2015 Weather Radiation Convection Currents Winds Jet Streams Energy from the Sun reaches Earth as electromagnetic waves This energy fuels all life on Earth including the
SKEW-T, LOG-P DIAGRAM ANALYSIS PROCEDURES
 SKEW-T, LOG-P DIAGRAM ANALYSIS PROCEDURES I. THE SKEW-T, LOG-P DIAGRAM The primary source for information contained in this appendix was taken from the Air Weather Service Technical Report TR-79/006. 1
Climates are described by the same conditions used to describe
 58 The Causes of Climate R E A D I N G Climates are described by the same conditions used to describe weather, such as temperature, precipitation, and wind. You now know that oceans have an important effect
Chapter Overview. Seasons. Earth s Seasons. Distribution of Solar Energy. Solar Energy on Earth. CHAPTER 6 Air-Sea Interaction
 Chapter Overview CHAPTER 6 Air-Sea Interaction The atmosphere and the ocean are one independent system. Earth has seasons because of the tilt on its axis. There are three major wind belts in each hemisphere.
Activity 4 Clouds Over Your Head Level 1
 Activity 4 Clouds Over Your Head Level 1 1 Objectives: Students will become familiar with the four main types of clouds: stratus, cirrus, cumulus, and cumulonimbus and their characteristics. Students will
Motion & The Global Positioning System (GPS)
") Grade Level: K - 8 Subject: Motion Prep Time: < 10 minutes Duration: 30 minutes Objective: To learn how to analyze GPS data in order to track an object and derive its velocity from positions and times.
Grade Level: K - 8 Subject: Motion Prep Time: < 10 minutes Duration: 30 minutes Objective: To learn how to analyze GPS data in order to track an object and derive its velocity from positions and times.
MEASUREMENT. Historical records indicate that the first units of length were based on people s hands, feet and arms. The measurements were:
 MEASUREMENT Introduction: People created systems of measurement to address practical problems such as finding the distance between two places, finding the length, width or height of a building, finding
Ambient Pressure = and Pressure, collectively
 Three in One Pressure: Ambient, Barometric, Atmospheric 1 Ambient Pressure Overhead Transparency Ambient Pressure = and Pressure, collectively When surrounded by air, pressure =? pressure =? pressure The
Studying Topography, Orographic Rainfall, and Ecosystems (STORE)
") Studying Topography, Orographic Rainfall, and Ecosystems (STORE) Basic Lesson 3: Using Microsoft Excel to Analyze Weather Data: Topography and Temperature Introduction This lesson uses NCDC data to compare
Studying Topography, Orographic Rainfall, and Ecosystems (STORE) Basic Lesson 3: Using Microsoft Excel to Analyze Weather Data: Topography and Temperature Introduction This lesson uses NCDC data to compare
FP1. HiSET TM Mathematics Practice Test
 FP1 HiSET TM Mathematics Practice Test Copyright 013 Educational Testing Service. All rights reserved. E T S and the E T S logo are registered trademarks of Educational Testing Service (E T S) in the United
Clouds and What They Mean
 Vocabulary and Writing Worksheet 1. Choose the best vocabulary word for each sentence and write it in the blank. dew point evaporation fog gas precipitation relative humidity a. Relative humidity refers
Partnerships Implementing Engineering Education Worcester Polytechnic Institute Worcester Public Schools
 Partnerships Implementing Engineering Education Worcester Polytechnic Institute Worcester Public Schools Supported by: National Science Foundation Weather: 4.H.3 Weather and Classical Instruments Grade
Education and Outreach Lesson Plan
 Education and Outreach Lesson Plan Visit our online activities collection http://education.arm.gov/ Grade levels K 2 Common Covering Clouds Common Covering Clouds Approximate Time 1 1/2 hours, or two 45-minute
Temperature. PJ Brucat
 PJ Brucat Temperature - the measure of average kinetic energy (KE) of a gas, liquid, or solid. KE is energy of motion. KE = ½ mv 2 where m=mass and v=velocity (speed) 1 All molecules have KE whether solid,
How do Scientists Forecast Thunderstorms?
 How do Scientists Forecast Thunderstorms? Objective In the summer, over the Great Plains, weather predictions often call for afternoon thunderstorms. While most of us use weather forecasts to help pick
Weather Merit Badge Workbook
 Merit Badge Workbook This workbook can help you but you still need to read the merit badge pamphlet. The work space provided for each requirement should be used by the Scout to make notes for discussing
AP Physics 1 and 2 Lab Investigations
 AP Physics 1 and 2 Lab Investigations Student Guide to Data Analysis New York, NY. College Board, Advanced Placement, Advanced Placement Program, AP, AP Central, and the acorn logo are registered trademarks
For further information, and additional background on the American Meteorological Society s Education Program, please contact:
 Project ATMOSPHERE This guide is one of a series produced by Project ATMOSPHERE, an initiative of the American Meteorological Society. Project ATMOSPHERE has created and trained a network of resource agents
Geography affects climate.
 KEY CONCEPT Climate is a long-term weather pattern. BEFORE, you learned The Sun s energy heats Earth s surface unevenly The atmosphere s temperature changes with altitude Oceans affect wind flow NOW, you
Content Guide & Five Items Resource
 Content Guide & Five Items Resource Introduction The following information should be used as a companion to the CPI Links. It provides clarifications concerning the content and skills contained in the
When the fluid velocity is zero, called the hydrostatic condition, the pressure variation is due only to the weight of the fluid.
 Fluid Statics When the fluid velocity is zero, called the hydrostatic condition, the pressure variation is due only to the weight of the fluid. Consider a small wedge of fluid at rest of size Δx, Δz, Δs
Microclimate in the Outdoor Classroom
 Microclimate in the Outdoor Classroom 1. CONTRIBUTOR S NAME: TJ FONTAINE 2. NAME OF INQUIRY: MICROCLIMATE IN THE OUTDOOR CLASSROOM 3. GOALS AND OBJECTIVES: TEACH STUDENTS ABOUT THE SIMULARITIES AND DIFFERENCES
Activity 1 Reading Universal Time Level 2 http://www.uni.edu/storm/activities/level2/index.shtml
 Activity 1 Reading Universal Time Level 2 http://www.uni.edu/storm/activities/level2/index.shtml National Science Education Standards: As a result of activities in grades 5-8, all students should develop
NIFA REGIONAL SAFECON 2006 Manual Flight Computer Accuracy Explanations
 NIFA REGIONAL SAFECON 2006 Manual Flight Computer Accuracy Explanations Note to competitor: This will offer some basic help in solving the problems on the test. There is often more than one way to correctly
Cloud seeding. Frequently Asked Questions. What are clouds and how are they formed? How do we know cloud seeding works in Tasmania?
 What are clouds and how are they formed? Clouds are composed of water droplets and sometimes ice crystals. Clouds form when air that is rich in moisture near the Earth s surface rises higher into the atmosphere,
CGC1D1: Interactions in the Physical Environment Factors that Affect Climate
 Name: Date: Day/Period: CGC1D1: Interactions in the Physical Environment Factors that Affect Climate Chapter 12 in the Making Connections textbook deals with Climate Connections. Use pages 127-144 to fill
Stability and Cloud Development. Stability in the atmosphere AT350. Why did this cloud form, whereas the sky was clear 4 hours ago?
 Stability and Cloud Development AT350 Why did this cloud form, whereas the sky was clear 4 hours ago? Stability in the atmosphere An Initial Perturbation Stable Unstable Neutral If an air parcel is displaced
ORANGE PUBLIC SCHOOLS OFFICE OF CURRICULUM AND INSTRUCTION OFFICE OF SCIENCE. GRADE 6 SCIENCE Post - Assessment
 ORANGE PUBLIC SCHOOLS OFFICE OF CURRICULUM AND INSTRUCTION OFFICE OF SCIENCE GRADE 6 SCIENCE Post - Assessment School Year 2013-2014 Directions for Grade 6 Post-Assessment The Grade 6 Post-Assessment is
Weather Forecasting. DELTA SCIENCE READER Overview... 103 Before Reading... 104 Guide the Reading... 105 After Reading... 114
 Weather Forecasting T ABLE OF CONTENTS ABOUT DELTA SCIENCE MODULES Program Introduction................... iii Teacher s Guide..................... iv Delta Science Readers................ vi Equipment
Weather Help - NEXRAD Radar Maps. Base Reflectivity
 Weather Help - NEXRAD Radar Maps Base Reflectivity Base Reflectivity Severe Thunderstorm/Torna do Watch Areas 16 levels depicted with colors from dark green (very light) to red (extreme) that indicate
FOR SUBSCRIBERS ONLY! - TRIAL PASSWORD USERS MAY NOT REPRODUCE AND DISTRIBUTE PRINTABLE MATERIALS OFF THE SOLPASS WEBSITE!
 FOR SUBSCRIBERS ONLY! - TRIAL PASSWORD USERS MAY NOT REPRODUCE AND DISTRIBUTE PRINTABLE MATERIALS OFF THE SOLPASS WEBSITE! 1 NAME DATE GRADE 5 SCIENCE SOL REVIEW WEATHER LABEL the 3 stages of the water
OBJECTIVES. Identify the means by which latitude and longitude were created and the science upon which they are based.
 Name: Key OBJECTIVES Correctly define: isolines, gradient, topographic map, contour interval, hachured lines, profile, latitude, longitude, hydrosphere, lithosphere, atmosphere, elevation, model EARTH
Measurements 1. BIRKBECK MATHS SUPPORT www.mathsupport.wordpress.com. In this section we will look at. Helping you practice. Online Quizzes and Videos
 BIRKBECK MATHS SUPPORT www.mathsupport.wordpress.com Measurements 1 In this section we will look at - Examples of everyday measurement - Some units we use to take measurements - Symbols for units and converting
Lecture 1: A Brief Survey of the Atmosphere
 Lecture 1: A Brief Survey of the Atmosphere Origins of the atmosphere Vertical structures of the atmosphere Weather maps Thickness of the Atmosphere (from Meteorology Today) 70% The thickness of the atmosphere
Seasonal Temperature Variations
 Seasonal and Daily Temperatures Fig. 3-CO, p. 54 Seasonal Temperature Variations What causes the seasons What governs the seasons is the amount of solar radiation reaching the ground What two primary factors
Grade 6 Standard 3 Unit Test A Astronomy. 1. The four inner planets are rocky and small. Which description best fits the next four outer planets?
 Grade 6 Standard 3 Unit Test A Astronomy Multiple Choice 1. The four inner planets are rocky and small. Which description best fits the next four outer planets? A. They are also rocky and small. B. They
Section 1 The Earth System
 Section 1 The Earth System Key Concept Earth is a complex system made up of many smaller systems through which matter and energy are continuously cycled. What You Will Learn Energy and matter flow through
What Causes Climate? Use Target Reading Skills
 Climate and Climate Change Name Date Class Climate and Climate Change Guided Reading and Study What Causes Climate? This section describes factors that determine climate, or the average weather conditions
Lab Activity on Global Wind Patterns
 Lab Activity on Global Wind Patterns 2002 Ann Bykerk-Kauffman, Dept. of Geological and Environmental Sciences, California State University, Chico * Objectives When you have completed this lab you should
This chapter discusses: 1. Definitions and causes of stable and unstable atmospheric air. 2. Processes that cause instability and cloud development
 Stability & Cloud Development This chapter discusses: 1. Definitions and causes of stable and unstable atmospheric air 2. Processes that cause instability and cloud development Stability & Movement A rock,
Use the following information to deduce that the gravitational field strength at the surface of the Earth is approximately 10 N kg 1.
 IB PHYSICS: Gravitational Forces Review 1. This question is about gravitation and ocean tides. (b) State Newton s law of universal gravitation. Use the following information to deduce that the gravitational
How Does Atmospheric Pressure Vary? Measuring Atmospheric Pressure At Different Altitudes Above Sea Level (Teacher s Guide)
") How Does Atmospheric Pressure Vary? Measuring Atmospheric Pressure At Different Altitudes Above Sea Level (Teacher s Guide) OVERVIEW Students will evaluate air pressure variations in different altitudes
How Does Atmospheric Pressure Vary? Measuring Atmospheric Pressure At Different Altitudes Above Sea Level (Teacher s Guide) OVERVIEW Students will evaluate air pressure variations in different altitudes
How to analyze synoptic-scale weather patterns Table of Contents
 How to analyze synoptic-scale weather patterns Table of Contents Before You Begin... 2 1. Identify H and L pressure systems... 3 2. Locate fronts and determine frontal activity... 5 3. Determine surface
FOURTH GRADE WEATHER
 FOURTH GRADE WEATHER 1 WEEK LESSON PLANS AND ACTIVITIES WATER CYCLE OVERVIEW OF FOURTH GRADE WATER WEEK 1. PRE: Comparing different reservoirs of water. LAB: Experimenting with surface tension and capillary
How High Up Is Space?
 I11 How High Up Is Space? Activity I11 Grade Level: 5 12 Source: This activity was written by Andrew Fraknoi and is copyright 2010 by Andrew Fraknoi. Its first publication is in The Universe at Your Fingertips.
WEATHER AND CLIMATE practice test
 WEATHER AND CLIMATE practice test Multiple Choice Identify the choice that best completes the statement or answers the question. 1. What role does runoff play in the water cycle? a. It is the process in
Southern AER Atmospheric Education Resource
 Southern AER Atmospheric Education Resource Vol. 9 No. 5 Spring 2003 Editor: Lauren Bell In this issue: g Climate Creations exploring mother nature s remote control for weather and Climate. g Crazy Climate
Formation & Classification
 CLOUDS Formation & Classification DR. K. K. CHANDRA Department of forestry, Wildlife & Environmental Sciences, GGV, Bilaspur What is Cloud It is mass of tiny water droplets or ice crystals or both of size
U s e r M a n u a l. Avalanche Warning Service Eduard-Wallnoefer-Platz 3 A-6020 Innsbruck. Weather stations. 1 The map window: Version 12/2015
 Avalanche Warning Service Eduard-Wallnoefer-Platz 3 A-6020 Innsbruck U s e r M a n u a l Weather stations In this database you will find all available weather stations from currently participating avalanche
Kinetic Molecular Theory and Gas Laws
 Kinetic Molecular Theory and Gas Laws I. Handout: Unit Notes II. Modeling at the Atomic Scale I. In another unit you learned about the history of the atom and the different models people had of what the
Physics 2A, Sec B00: Mechanics -- Winter 2011 Instructor: B. Grinstein Final Exam
 Physics 2A, Sec B00: Mechanics -- Winter 2011 Instructor: B. Grinstein Final Exam INSTRUCTIONS: Use a pencil #2 to fill your scantron. Write your code number and bubble it in under "EXAM NUMBER;" an entry
[7] SD3.1 The student demonstrates an understanding of cycles influenced by energy from the
![[7] SD3.1 The student demonstrates an understanding of cycles influenced by energy from the](/thumbs/27/12373649.jpg "[7] SD3.1 The student demonstrates an understanding of cycles influenced by energy from the") Cloud Types Levels Overview: During this project, students learn about different types of clouds and determine which type of cloud is most commonly overhead in their area over a period of four weeks. Objectives:
Cloud Types Levels Overview: During this project, students learn about different types of clouds and determine which type of cloud is most commonly overhead in their area over a period of four weeks. Objectives:
GETTING TO THE CORE: THE LINK BETWEEN TEMPERATURE AND CARBON DIOXIDE
 DESCRIPTION This lesson plan gives students first-hand experience in analyzing the link between atmospheric temperatures and carbon dioxide ( ) s by looking at ice core data spanning hundreds of thousands
INSTALLING A/C ADAPTER
 WS 6502 INTRODUCTION 1. SNOOZE/LIGHT BUTTON 2. BASE 3. ALM SET BUTTON 4. + / C/F BUTTON 5. HISTORY BUTTON 6. MODE BUTTON 7. CHANNEL BUTTON 8. - / RCC BUTTON 9. MAX/MIN BUTTON 10. BATTERY COMPARTMENT 11.
Sample Questions Chapter 2. Stoker
 Sample Questions Chapter 2. Stoker 1. The mathematical meaning associated with the metric system prefixes centi, milli, and micro is, respectively, A) 2, 4, and 6. B) 2, 3, and 6. C) 3, 6, and 9. D) 3,
Tide - rhythmic oscillation of the ocean surface due to gravitational & centrifugal forces ( inertia ) between the Earth, Moon and Sun.
 between the Earth, Moon and Sun.") Chapter 4: The Changing Level of the Sea Tides Longer Scale Variations Influence on Beaches Tide - rhythmic oscillation of the ocean surface due to gravitational & centrifugal forces ( inertia ) between
Chapter 4: The Changing Level of the Sea Tides Longer Scale Variations Influence on Beaches Tide - rhythmic oscillation of the ocean surface due to gravitational & centrifugal forces ( inertia ) between
WEATHER THEORY Temperature, Pressure And Moisture
 WEATHER THEORY Temperature, Pressure And Moisture Air Masses And Fronts Weather Theory- Page 77 Every physical process of weather is a result of a heat exchange. The standard sea level temperature is 59
What Is Energy? Energy and Work: Working Together. 124 Chapter 5 Energy and Energy Resources
 1 What You Will Learn Explain the relationship between energy and work. Compare kinetic and potential energy. Describe the different forms of energy. Vocabulary energy kinetic energy potential energy mechanical
MiSP WEATHER WIND SPEED AND DIRECTION Teacher Guide, L1 L3. Introduction
 MiSP WEATHER WIND SPEED AND DIRECTION Teacher Guide, L1 L3 Introduction This MiSP unit can be included in a standard weather and climate unit. Some teachers may like it as part of the introduction. Others
4 th Grade Summer Mathematics Review #1. Name: 1. How many sides does each polygon have? 2. What is the rule for this function machine?
 . How many sides does each polygon have? th Grade Summer Mathematics Review #. What is the rule for this function machine? A. Pentagon B. Nonagon C. Octagon D. Quadrilateral. List all of the factors of
Grade 6 FCAT 2.0 Mathematics Sample Questions
 Grade FCAT. Mathematics Sample Questions The intent of these sample test materials is to orient teachers and students to the types of questions on FCAT. tests. By using these materials, students will become
WeatherBug Vocabulary Bingo
 Type of Activity: Game: Interactive activity that is competitive, and allows students to learn at the same time. Activity Overview: WeatherBug Bingo is a fun and engaging game for you to play with students!
Experiment 2 Free Fall and Projectile Motion
 Name Partner(s): Experiment 2 Free Fall and Projectile Motion Objectives Preparation Pre-Lab Learn how to solve projectile motion problems. Understand that the acceleration due to gravity is constant (9.8
NASA Explorer Schools Pre-Algebra Unit Lesson 2 Student Workbook. Solar System Math. Comparing Mass, Gravity, Composition, & Density
 National Aeronautics and Space Administration NASA Explorer Schools Pre-Algebra Unit Lesson 2 Student Workbook Solar System Math Comparing Mass, Gravity, Composition, & Density What interval of values
39th International Physics Olympiad - Hanoi - Vietnam - 2008. Theoretical Problem No. 3
 CHANGE OF AIR TEMPERATURE WITH ALTITUDE, ATMOSPHERIC STABILITY AND AIR POLLUTION Vertical motion of air governs many atmospheric processes, such as the formation of clouds and precipitation and the dispersal
Glaciogenic Cloud Seeding to Increase Orographic Precipitation Bruce A. Boe bboe@weathermod.com Director of Meteorology
 Glaciogenic Cloud Seeding to Increase Orographic Precipitation Bruce A. Boe bboe@weathermod.com Director of Meteorology Weather Modification, Inc. Fargo, North Dakota, USA www.weathermodification.com Content
Temperature and Humidity
 Temperature and Humidity Overview Water vapor is a very important gas in the atmosphere and can influence many things like condensation and the formation of clouds and rain, as well as how hot or cold
Practice Test. 4) The planet Earth loses heat mainly by A) conduction. B) convection. C) radiation. D) all of these Answer: C
 The planet Earth loses heat mainly by A) conduction. B) convection. C) radiation. D) all of these Answer: C") Practice Test 1) Increase the pressure in a container of oxygen gas while keeping the temperature constant and you increase the A) molecular speed. B) molecular kinetic energy. C) Choice A and choice B
Practice Test 1) Increase the pressure in a container of oxygen gas while keeping the temperature constant and you increase the A) molecular speed. B) molecular kinetic energy. C) Choice A and choice B
Chapter 6: Cloud Development and Forms
 Chapter 6: Cloud Development and Forms (from The Blue Planet ) Why Clouds Form Static Stability Cloud Types Why Clouds Form? Clouds form when air rises and becomes saturated in response to adiabatic cooling.
= 800 kg/m 3 (note that old units cancel out) 4.184 J 1000 g = 4184 J/kg o C
 4.184 J 1000 g = 4184 J/kg o C") Units and Dimensions Basic properties such as length, mass, time and temperature that can be measured are called dimensions. Any quantity that can be measured has a value and a unit associated with it.
Units and Dimensions Basic properties such as length, mass, time and temperature that can be measured are called dimensions. Any quantity that can be measured has a value and a unit associated with it.
2. Room temperature: C. Kelvin. 2. Room temperature:
 Temperature I. Temperature is the quantity that tells how hot or cold something is compared with a standard A. Temperature is directly proportional to the average kinetic energy of molecular translational
Solar System. 1. The diagram below represents a simple geocentric model. Which object is represented by the letter X?
 Solar System 1. The diagram below represents a simple geocentric model. Which object is represented by the letter X? A) Earth B) Sun C) Moon D) Polaris 2. Which object orbits Earth in both the Earth-centered
Name Date Class STATES OF MATTER. SECTION 13.1 THE NATURE OF GASES (pages 385 389)
") 13 STATES OF MATTER SECTION 13.1 THE NATURE OF GASES (pages 385 389) This section introduces the kinetic theory and describes how it applies to gases. It defines gas pressure and explains how temperature
13 STATES OF MATTER SECTION 13.1 THE NATURE OF GASES (pages 385 389) This section introduces the kinetic theory and describes how it applies to gases. It defines gas pressure and explains how temperature
2After completing this chapter you should be able to
 After completing this chapter you should be able to solve problems involving motion in a straight line with constant acceleration model an object moving vertically under gravity understand distance time
Weather Map Symbols, Abbreviations, and Features
 Weather Map Symbols, Abbreviations, and Features Table of Contents 1. Symbols... 2 Pressure Systems/Fronts... 2 Precipitation... 3 Wind Speed... 4 Center pressures (on Surface Maps)... 4 2. Abbreviations...
Understanding the altimeter
 Understanding the altimeter What you see isn't always what you have by Jack Willams Flying is an adventure for most pilots--sometimes more adventure than they really want. A pilot's report to Canada's
Lecture 4: Pressure and Wind
 Lecture 4: Pressure and Wind Pressure, Measurement, Distribution Forces Affect Wind Geostrophic Balance Winds in Upper Atmosphere Near-Surface Winds Hydrostatic Balance (why the sky isn t falling!) Thermal
CLIMATE, WATER & LIVING PATTERNS THINGS
 CLIMATE, WATER & LIVING PATTERNS NAME THE SIX MAJOR CLIMATE REGIONS DESCRIBE EACH CLIMATE REGION TELL THE FIVE FACTORS THAT AFFECT CLIMATE EXPLAIN HOW THOSE FACTORS AFFECT CLIMATE DESCRIBE HOW CLIMATES
What is Energy? 1 45 minutes Energy and You: Energy Picnic Science, Physical Education Engage
 Unit Grades K-3 Awareness Teacher Overview What is energy? Energy makes change; it does things for us. It moves cars along the road and boats over the water. It bakes a cake in the oven and keeps ice frozen
Density: Sea Water Mixing and Sinking
 Density: Sea Water Mixing and Sinking Unit: Salinity Patterr~s & the Water Cycle I Grade Level: Middle or High I Time Required: two 45 minute class periods I Content Standard: NSES Physical Science, properties