Measures of Central Tendency and Variability: Summarizing your Data for Others
|
|
|
- Osborne Richardson
- 9 years ago
- Views:
Transcription
1 Measures of Central Tendency and Variability: Summarizing your Data for Others 1

2 I. Measures of Central Tendency: -Allow us to summarize an entire data set with a single value (the midpoint). 1. Mode : The value (score) that occurs most often in a data set. -Mo x = Sample mode -Mo = Population mode 2. Median : the point (score) which divides the data set in ½ : e.g. ½ of the subjects are above the median and ½ are below the median. -Mdn x = Sample Median -Mdn = Population Median 3. Mean: the arithmetic average: Directly considers every score in a distribution. 2

3 II. Skewed Distributions & the 3M s -Skewness refers to the shape of the distribution which can be influenced by extreme scores. - Skewness is also an estimate of the deviation of the Mean, Median, and Mode. 3

4 -Symmetrical Dist. = Mean, Median, Mode are all in the same location in the dist. 4

5 -Skewed Right (Positively Skewed) = Mode in peak of dist.(left of center), Median in center of distribution, Mean in right tail of distribution. 5

6 -Skewed Left (Negatively Skewed) = Mode in peak of dist (right of center), Median in center of distribution, Mean in left tail of distribution. 6

7 I. Measures of Variability (Dispersion) -Allow us to summarize our data set with a single value. -Central Tendency + Variability = a more accurate picture of our data set. -The 3 main measures of variability: Range, Variance, and Standard Deviation. These formulas are the root formulas for many of the statistical tests that will be covered later t-test, ANOVA, and Correlation Tell us how much observations in a data set vary (differ from one another) How are they dispersed within the distribution? 7

8 8

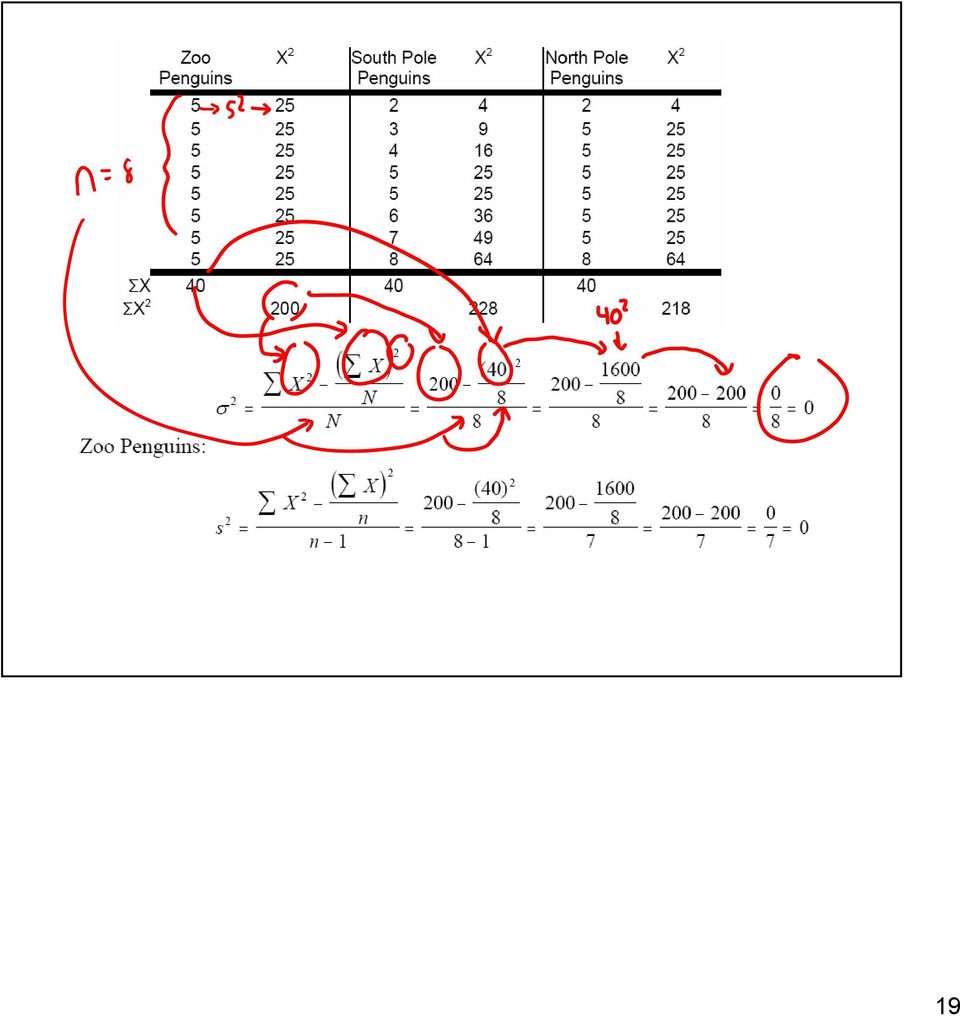
9 -Although measures of central tendency tell summarize some aspects of our data, they don't tell us much about the variance within our data. Example. Number of miles traveled before traveling companion appears human n=8 Mean = 5, Mode = 5, Median = 5 for both data sets (They do not differ) -all zoo penguins hallucinate after traveling 5 mile, while there is much more variability in the distances traveled by South Pole Penguins. -In order to draw accurate conclusions about our data both central tendency and variability must be considered. 9
 -all zoo penguins hallucinate after traveling 5 mile, while there is much more variability in the distances traveled by South")
10 II.Range : The numerical distance between the largest (X maximum) and smallest values (X minimum), tells us something about the variation in scores we have in our data, or it tells us the width of our data set. Range = X maximum - X minimum - Range for Zoo penguins = 5-5 = 0 - Range for South Pole P's = 8-2 = 6 10

11 -Problems with Range: Does not directly consider every value in the data set (here only the two extreme numbers; largest and smallest). We do not know whether most of the scores occur at the extremes of the distribution or toward the center. For example: 11

12 III. Variance = indicates the total amount of variability (differences between scores) in a data set by directly considering every observation. -Requires a point from which each observation can be compared to assess the amount they differ. -The Mean can be used as a point of comparison, since it considers every observation in its calculation. 12

13 The sum of the mean deviation for any data set is always 0. This limits the usefulness of the mean deviation for summarizing different data sets with a single point. if we square each deviation value then the negative values cancel out and we are left with a more meaningful value. 13

14 -If we sum these values we no longer get 0, but a number that reflects the total variance for this data set, -if we divide that number by N or n we get the average variance for this data set. Definitional Population Formula = σ 2 = Σ(X - Mean) 2 N Definitional Sample Formula = s 2 = Σ(X - Mean) 2 n 1 Note sample variance uses n-1 rather than N because it is an estimate of the population variance. Due to the smaller denominator, the sample variance will always be slightly larger than the population variance. 14

15 15

16 16

17 17

18 - Definitional Formula is time consuming for large data sets. - We have developed mathematically identical (algebraically equivalent) formulas that are easier to calculate. Computational Formulas= Population Variance = σ 2 = ΣX 2 -(ΣX ) 2 /N N Sample Variance = s 2 = ΣX 2 -(ΣX ) 2 /n n-1 -Note sample variance uses n-1 rather than N because it is an estimate of the population variance. Due to this reduced denominator the sample variance will always be slightly larger than the population variance. 18

19 19
20 20

21 21
22 -Problems: This formula is the base for many other statistical formulas, however as a single summary measure it has little numerical meaning until it is converted to a standardized score. Right now it represents the average distance each penguin is from the mean, in squared mile units. 3. Standard Deviation= The square root of a variance. - The standardized variance value. - It provides us with a numerically meaningful measure of variance: -The average distance each observation is from the mean. -This value (when combined with other stats methods) allow us to infer what percentage of our observations are a certain distance from the mean. Standard Deviation (based on computational formula of variance) 22
23 With respect to sample standard deviations (s), we can say: -Zoo penguins are an average of 0 miles from the mean number of miles walked before hallucinating 23
24 With respect to sample standard deviations (s), we can say: - South Pole penguins are an average of 2 miles from the mean number of miles walked before hallucinating. 24
25 With respect to sample standard deviations (s), we can say: - North Pole penguins are an average of 1.69 miles from the mean number miles walked before hallucinating. 25
Lesson 4 Measures of Central Tendency
 Outline Measures of a distribution s shape -modality and skewness -the normal distribution Measures of central tendency -mean, median, and mode Skewness and Central Tendency Lesson 4 Measures of Central
Biostatistics: DESCRIPTIVE STATISTICS: 2, VARIABILITY
 Biostatistics: DESCRIPTIVE STATISTICS: 2, VARIABILITY 1. Introduction Besides arriving at an appropriate expression of an average or consensus value for observations of a population, it is important to
1) Write the following as an algebraic expression using x as the variable: Triple a number subtracted from the number
 Write the following as an algebraic expression using x as the variable: Triple a number subtracted from the number") 1) Write the following as an algebraic expression using x as the variable: Triple a number subtracted from the number A. 3(x - x) B. x 3 x C. 3x - x D. x - 3x 2) Write the following as an algebraic expression
1) Write the following as an algebraic expression using x as the variable: Triple a number subtracted from the number A. 3(x - x) B. x 3 x C. 3x - x D. x - 3x 2) Write the following as an algebraic expression
Descriptive Statistics and Measurement Scales
 Descriptive Statistics 1 Descriptive Statistics and Measurement Scales Descriptive statistics are used to describe the basic features of the data in a study. They provide simple summaries about the sample
Probability and Statistics Prof. Dr. Somesh Kumar Department of Mathematics Indian Institute of Technology, Kharagpur
 Probability and Statistics Prof. Dr. Somesh Kumar Department of Mathematics Indian Institute of Technology, Kharagpur Module No. #01 Lecture No. #15 Special Distributions-VI Today, I am going to introduce
Means, standard deviations and. and standard errors
 CHAPTER 4 Means, standard deviations and standard errors 4.1 Introduction Change of units 4.2 Mean, median and mode Coefficient of variation 4.3 Measures of variation 4.4 Calculating the mean and standard
COMPARISON MEASURES OF CENTRAL TENDENCY & VARIABILITY EXERCISE 8/5/2013. MEASURE OF CENTRAL TENDENCY: MODE (Mo) MEASURE OF CENTRAL TENDENCY: MODE (Mo)
 MEASURE OF CENTRAL TENDENCY: MODE (Mo)") COMPARISON MEASURES OF CENTRAL TENDENCY & VARIABILITY Prepared by: Jess Roel Q. Pesole CENTRAL TENDENCY -what is average or typical in a distribution Commonly Measures: 1. Mode. Median 3. Mean quantified
COMPARISON MEASURES OF CENTRAL TENDENCY & VARIABILITY Prepared by: Jess Roel Q. Pesole CENTRAL TENDENCY -what is average or typical in a distribution Commonly Measures: 1. Mode. Median 3. Mean quantified
Descriptive Statistics. Purpose of descriptive statistics Frequency distributions Measures of central tendency Measures of dispersion
 Descriptive Statistics Purpose of descriptive statistics Frequency distributions Measures of central tendency Measures of dispersion Statistics as a Tool for LIS Research Importance of statistics in research
DESCRIPTIVE STATISTICS. The purpose of statistics is to condense raw data to make it easier to answer specific questions; test hypotheses.
 DESCRIPTIVE STATISTICS The purpose of statistics is to condense raw data to make it easier to answer specific questions; test hypotheses. DESCRIPTIVE VS. INFERENTIAL STATISTICS Descriptive To organize,
MEASURES OF VARIATION
 NORMAL DISTRIBTIONS MEASURES OF VARIATION In statistics, it is important to measure the spread of data. A simple way to measure spread is to find the range. But statisticians want to know if the data are
CALCULATIONS & STATISTICS
 CALCULATIONS & STATISTICS CALCULATION OF SCORES Conversion of 1-5 scale to 0-100 scores When you look at your report, you will notice that the scores are reported on a 0-100 scale, even though respondents
Introduction; Descriptive & Univariate Statistics
 Introduction; Descriptive & Univariate Statistics I. KEY COCEPTS A. Population. Definitions:. The entire set of members in a group. EXAMPLES: All U.S. citizens; all otre Dame Students. 2. All values of
DESCRIPTIVE STATISTICS & DATA PRESENTATION*
 Level 1 Level 2 Level 3 Level 4 0 0 0 0 evel 1 evel 2 evel 3 Level 4 DESCRIPTIVE STATISTICS & DATA PRESENTATION* Created for Psychology 41, Research Methods by Barbara Sommer, PhD Psychology Department
Descriptive Statistics
 Y520 Robert S Michael Goal: Learn to calculate indicators and construct graphs that summarize and describe a large quantity of values. Using the textbook readings and other resources listed on the web
The right edge of the box is the third quartile, Q 3, which is the median of the data values above the median. Maximum Median
 CONDENSED LESSON 2.1 Box Plots In this lesson you will create and interpret box plots for sets of data use the interquartile range (IQR) to identify potential outliers and graph them on a modified box
Week 3&4: Z tables and the Sampling Distribution of X
 Week 3&4: Z tables and the Sampling Distribution of X 2 / 36 The Standard Normal Distribution, or Z Distribution, is the distribution of a random variable, Z N(0, 1 2 ). The distribution of any other normal
Descriptive Statistics
 Descriptive Statistics Primer Descriptive statistics Central tendency Variation Relative position Relationships Calculating descriptive statistics Descriptive Statistics Purpose to describe or summarize
1.5 Oneway Analysis of Variance
 Statistics: Rosie Cornish. 200. 1.5 Oneway Analysis of Variance 1 Introduction Oneway analysis of variance (ANOVA) is used to compare several means. This method is often used in scientific or medical experiments
6.4 Normal Distribution
 Contents 6.4 Normal Distribution....................... 381 6.4.1 Characteristics of the Normal Distribution....... 381 6.4.2 The Standardized Normal Distribution......... 385 6.4.3 Meaning of Areas under
Standard Deviation Estimator
 CSS.com Chapter 905 Standard Deviation Estimator Introduction Even though it is not of primary interest, an estimate of the standard deviation (SD) is needed when calculating the power or sample size of
How To Write A Data Analysis
 Mathematics Probability and Statistics Curriculum Guide Revised 2010 This page is intentionally left blank. Introduction The Mathematics Curriculum Guide serves as a guide for teachers when planning instruction
Reliability Overview
 Calculating Reliability of Quantitative Measures Reliability Overview Reliability is defined as the consistency of results from a test. Theoretically, each test contains some error the portion of the score
CA200 Quantitative Analysis for Business Decisions. File name: CA200_Section_04A_StatisticsIntroduction
 CA200 Quantitative Analysis for Business Decisions File name: CA200_Section_04A_StatisticsIntroduction Table of Contents 4. Introduction to Statistics... 1 4.1 Overview... 3 4.2 Discrete or continuous
Chapter 1: Looking at Data Section 1.1: Displaying Distributions with Graphs
 Types of Variables Chapter 1: Looking at Data Section 1.1: Displaying Distributions with Graphs Quantitative (numerical)variables: take numerical values for which arithmetic operations make sense (addition/averaging)
individualdifferences
 1 Simple ANalysis Of Variance (ANOVA) Oftentimes we have more than two groups that we want to compare. The purpose of ANOVA is to allow us to compare group means from several independent samples. In general,
3.2 Measures of Spread
 3.2 Measures of Spread In some data sets the observations are close together, while in others they are more spread out. In addition to measures of the center, it's often important to measure the spread
MBA 611 STATISTICS AND QUANTITATIVE METHODS
 MBA 611 STATISTICS AND QUANTITATIVE METHODS Part I. Review of Basic Statistics (Chapters 1-11) A. Introduction (Chapter 1) Uncertainty: Decisions are often based on incomplete information from uncertain
Descriptive statistics parameters: Measures of centrality
 Descriptive statistics parameters: Measures of centrality Contents Definitions... 3 Classification of descriptive statistics parameters... 4 More about central tendency estimators... 5 Relationship between
consider the number of math classes taken by math 150 students. how can we represent the results in one number?
 ch 3: numerically summarizing data - center, spread, shape 3.1 measure of central tendency or, give me one number that represents all the data consider the number of math classes taken by math 150 students.
Exercise 1.12 (Pg. 22-23)
") Individuals: The objects that are described by a set of data. They may be people, animals, things, etc. (Also referred to as Cases or Records) Variables: The characteristics recorded about each individual.
Individuals: The objects that are described by a set of data. They may be people, animals, things, etc. (Also referred to as Cases or Records) Variables: The characteristics recorded about each individual.
II. DISTRIBUTIONS distribution normal distribution. standard scores
 Appendix D Basic Measurement And Statistics The following information was developed by Steven Rothke, PhD, Department of Psychology, Rehabilitation Institute of Chicago (RIC) and expanded by Mary F. Schmidt,
Introduction to Statistics for Psychology. Quantitative Methods for Human Sciences
 Introduction to Statistics for Psychology and Quantitative Methods for Human Sciences Jonathan Marchini Course Information There is website devoted to the course at http://www.stats.ox.ac.uk/ marchini/phs.html
Statistics. Measurement. Scales of Measurement 7/18/2012
 Statistics Measurement Measurement is defined as a set of rules for assigning numbers to represent objects, traits, attributes, or behaviors A variableis something that varies (eye color), a constant does
Topic 9 ~ Measures of Spread
 AP Statistics Topic 9 ~ Measures of Spread Activity 9 : Baseball Lineups The table to the right contains data on the ages of the two teams involved in game of the 200 National League Division Series. Is
CHAPTER 14 NONPARAMETRIC TESTS
 CHAPTER 14 NONPARAMETRIC TESTS Everything that we have done up until now in statistics has relied heavily on one major fact: that our data is normally distributed. We have been able to make inferences
Exploratory Data Analysis. Psychology 3256
 Exploratory Data Analysis Psychology 3256 1 Introduction If you are going to find out anything about a data set you must first understand the data Basically getting a feel for you numbers Easier to find
3. What is the difference between variance and standard deviation? 5. If I add 2 to all my observations, how variance and mean will vary?
 Variance, Standard deviation Exercises: 1. What does variance measure? 2. How do we compute a variance? 3. What is the difference between variance and standard deviation? 4. What is the meaning of the
Simple Regression Theory II 2010 Samuel L. Baker
 SIMPLE REGRESSION THEORY II 1 Simple Regression Theory II 2010 Samuel L. Baker Assessing how good the regression equation is likely to be Assignment 1A gets into drawing inferences about how close the
STA-201-TE. 5. Measures of relationship: correlation (5%) Correlation coefficient; Pearson r; correlation and causation; proportion of common variance
 Correlation coefficient; Pearson r; correlation and causation; proportion of common variance") Principles of Statistics STA-201-TE This TECEP is an introduction to descriptive and inferential statistics. Topics include: measures of central tendency, variability, correlation, regression, hypothesis
Principles of Statistics STA-201-TE This TECEP is an introduction to descriptive and inferential statistics. Topics include: measures of central tendency, variability, correlation, regression, hypothesis
Statistics Review PSY379
 Statistics Review PSY379 Basic concepts Measurement scales Populations vs. samples Continuous vs. discrete variable Independent vs. dependent variable Descriptive vs. inferential stats Common analyses
Summary of Formulas and Concepts. Descriptive Statistics (Ch. 1-4)
") Summary of Formulas and Concepts Descriptive Statistics (Ch. 1-4) Definitions Population: The complete set of numerical information on a particular quantity in which an investigator is interested. We assume
Summary of Formulas and Concepts Descriptive Statistics (Ch. 1-4) Definitions Population: The complete set of numerical information on a particular quantity in which an investigator is interested. We assume
Module 3: Correlation and Covariance
 Using Statistical Data to Make Decisions Module 3: Correlation and Covariance Tom Ilvento Dr. Mugdim Pašiƒ University of Delaware Sarajevo Graduate School of Business O ften our interest in data analysis
How do you compare numbers? On a number line, larger numbers are to the right and smaller numbers are to the left.
 The verbal answers to all of the following questions should be memorized before completion of pre-algebra. Answers that are not memorized will hinder your ability to succeed in algebra 1. Number Basics
3: Summary Statistics
 3: Summary Statistics Notation Let s start by introducing some notation. Consider the following small data set: 4 5 30 50 8 7 4 5 The symbol n represents the sample size (n = 0). The capital letter X denotes
DATA ANALYSIS. QEM Network HBCU-UP Fundamentals of Education Research Workshop Gerunda B. Hughes, Ph.D. Howard University
 DATA ANALYSIS QEM Network HBCU-UP Fundamentals of Education Research Workshop Gerunda B. Hughes, Ph.D. Howard University Quantitative Research What is Statistics? Statistics (as a subject) is the science
Lecture 1: Review and Exploratory Data Analysis (EDA)
") Lecture 1: Review and Exploratory Data Analysis (EDA) Sandy Eckel [email protected] Department of Biostatistics, The Johns Hopkins University, Baltimore USA 21 April 2008 1 / 40 Course Information I Course
Lecture 1: Review and Exploratory Data Analysis (EDA) Sandy Eckel [email protected] Department of Biostatistics, The Johns Hopkins University, Baltimore USA 21 April 2008 1 / 40 Course Information I Course
When to use Excel. When NOT to use Excel 9/24/2014
 Analyzing Quantitative Assessment Data with Excel October 2, 2014 Jeremy Penn, Ph.D. Director When to use Excel You want to quickly summarize or analyze your assessment data You want to create basic visual
Descriptive statistics Statistical inference statistical inference, statistical induction and inferential statistics
 Descriptive statistics is the discipline of quantitatively describing the main features of a collection of data. Descriptive statistics are distinguished from inferential statistics (or inductive statistics),
Module 4: Data Exploration
 Module 4: Data Exploration Now that you have your data downloaded from the Streams Project database, the detective work can begin! Before computing any advanced statistics, we will first use descriptive
STATS8: Introduction to Biostatistics. Data Exploration. Babak Shahbaba Department of Statistics, UCI
 STATS8: Introduction to Biostatistics Data Exploration Babak Shahbaba Department of Statistics, UCI Introduction After clearly defining the scientific problem, selecting a set of representative members
4.1 Exploratory Analysis: Once the data is collected and entered, the first question is: "What do the data look like?"
 Data Analysis Plan The appropriate methods of data analysis are determined by your data types and variables of interest, the actual distribution of the variables, and the number of cases. Different analyses
1.3 Measuring Center & Spread, The Five Number Summary & Boxplots. Describing Quantitative Data with Numbers
 1.3 Measuring Center & Spread, The Five Number Summary & Boxplots Describing Quantitative Data with Numbers 1.3 I can n Calculate and interpret measures of center (mean, median) in context. n Calculate
1 Descriptive statistics: mode, mean and median
 1 Descriptive statistics: mode, mean and median Statistics and Linguistic Applications Hale February 5, 2008 It s hard to understand data if you have to look at it all. Descriptive statistics are things
business statistics using Excel OXFORD UNIVERSITY PRESS Glyn Davis & Branko Pecar
 business statistics using Excel Glyn Davis & Branko Pecar OXFORD UNIVERSITY PRESS Detailed contents Introduction to Microsoft Excel 2003 Overview Learning Objectives 1.1 Introduction to Microsoft Excel
Introduction to Quantitative Methods
 Introduction to Quantitative Methods October 15, 2009 Contents 1 Definition of Key Terms 2 2 Descriptive Statistics 3 2.1 Frequency Tables......................... 4 2.2 Measures of Central Tendencies.................
MATH 10: Elementary Statistics and Probability Chapter 7: The Central Limit Theorem
 MATH 10: Elementary Statistics and Probability Chapter 7: The Central Limit Theorem Tony Pourmohamad Department of Mathematics De Anza College Spring 2015 Objectives By the end of this set of slides, you
Non-Parametric Tests (I)
") Lecture 5: Non-Parametric Tests (I) KimHuat LIM [email protected] http://www.stats.ox.ac.uk/~lim/teaching.html Slide 1 5.1 Outline (i) Overview of Distribution-Free Tests (ii) Median Test for Two Independent
Lecture 5: Non-Parametric Tests (I) KimHuat LIM [email protected] http://www.stats.ox.ac.uk/~lim/teaching.html Slide 1 5.1 Outline (i) Overview of Distribution-Free Tests (ii) Median Test for Two Independent
z-scores AND THE NORMAL CURVE MODEL
 z-scores AND THE NORMAL CURVE MODEL 1 Understanding z-scores 2 z-scores A z-score is a location on the distribution. A z- score also automatically communicates the raw score s distance from the mean A
2. Filling Data Gaps, Data validation & Descriptive Statistics
 2. Filling Data Gaps, Data validation & Descriptive Statistics Dr. Prasad Modak Background Data collected from field may suffer from these problems Data may contain gaps ( = no readings during this period)
Northumberland Knowledge
 Northumberland Knowledge Know Guide How to Analyse Data - November 2012 - This page has been left blank 2 About this guide The Know Guides are a suite of documents that provide useful information about
DATA INTERPRETATION AND STATISTICS
 PholC60 September 001 DATA INTERPRETATION AND STATISTICS Books A easy and systematic introductory text is Essentials of Medical Statistics by Betty Kirkwood, published by Blackwell at about 14. DESCRIPTIVE
SKEWNESS. Measure of Dispersion tells us about the variation of the data set. Skewness tells us about the direction of variation of the data set.
 SKEWNESS All about Skewness: Aim Definition Types of Skewness Measure of Skewness Example A fundamental task in many statistical analyses is to characterize the location and variability of a data set.
Zeros of a Polynomial Function
 Zeros of a Polynomial Function An important consequence of the Factor Theorem is that finding the zeros of a polynomial is really the same thing as factoring it into linear factors. In this section we
Introduction to Statistics and Quantitative Research Methods
 Introduction to Statistics and Quantitative Research Methods Purpose of Presentation To aid in the understanding of basic statistics, including terminology, common terms, and common statistical methods.
Analyzing and interpreting data Evaluation resources from Wilder Research
 Wilder Research Analyzing and interpreting data Evaluation resources from Wilder Research Once data are collected, the next step is to analyze the data. A plan for analyzing your data should be developed
Section 14 Simple Linear Regression: Introduction to Least Squares Regression
 Slide 1 Section 14 Simple Linear Regression: Introduction to Least Squares Regression There are several different measures of statistical association used for understanding the quantitative relationship
PowerScore Test Preparation (800) 545-1750
 545-1750") Question 1 Test 1, Second QR Section (version 1) List A: 0, 5,, 15, 20... QA: Standard deviation of list A QB: Standard deviation of list B Statistics: Standard Deviation Answer: The two quantities are
Question 1 Test 1, Second QR Section (version 1) List A: 0, 5,, 15, 20... QA: Standard deviation of list A QB: Standard deviation of list B Statistics: Standard Deviation Answer: The two quantities are
Frequency Distributions
 Descriptive Statistics Dr. Tom Pierce Department of Psychology Radford University Descriptive statistics comprise a collection of techniques for better understanding what the people in a group look like
Variables. Exploratory Data Analysis
 Exploratory Data Analysis Exploratory Data Analysis involves both graphical displays of data and numerical summaries of data. A common situation is for a data set to be represented as a matrix. There is
Data Analysis Tools. Tools for Summarizing Data
 Data Analysis Tools This section of the notes is meant to introduce you to many of the tools that are provided by Excel under the Tools/Data Analysis menu item. If your computer does not have that tool
Center: Finding the Median. Median. Spread: Home on the Range. Center: Finding the Median (cont.)
") Center: Finding the Median When we think of a typical value, we usually look for the center of the distribution. For a unimodal, symmetric distribution, it s easy to find the center it s just the center
Center: Finding the Median When we think of a typical value, we usually look for the center of the distribution. For a unimodal, symmetric distribution, it s easy to find the center it s just the center
Mathematical goals. Starting points. Materials required. Time needed
 Level S6 of challenge: B/C S6 Interpreting frequency graphs, cumulative cumulative frequency frequency graphs, graphs, box and box whisker and plots whisker plots Mathematical goals Starting points Materials
The Dummy s Guide to Data Analysis Using SPSS
 The Dummy s Guide to Data Analysis Using SPSS Mathematics 57 Scripps College Amy Gamble April, 2001 Amy Gamble 4/30/01 All Rights Rerserved TABLE OF CONTENTS PAGE Helpful Hints for All Tests...1 Tests
Engineering Problem Solving and Excel. EGN 1006 Introduction to Engineering
 Engineering Problem Solving and Excel EGN 1006 Introduction to Engineering Mathematical Solution Procedures Commonly Used in Engineering Analysis Data Analysis Techniques (Statistics) Curve Fitting techniques
Statistical Process Control (SPC) Training Guide
 Training Guide") Statistical Process Control (SPC) Training Guide Rev X05, 09/2013 What is data? Data is factual information (as measurements or statistics) used as a basic for reasoning, discussion or calculation. (Merriam-Webster
Statistical Process Control (SPC) Training Guide Rev X05, 09/2013 What is data? Data is factual information (as measurements or statistics) used as a basic for reasoning, discussion or calculation. (Merriam-Webster
BNG 202 Biomechanics Lab. Descriptive statistics and probability distributions I
 BNG 202 Biomechanics Lab Descriptive statistics and probability distributions I Overview The overall goal of this short course in statistics is to provide an introduction to descriptive and inferential
An introduction to using Microsoft Excel for quantitative data analysis
 Contents An introduction to using Microsoft Excel for quantitative data analysis 1 Introduction... 1 2 Why use Excel?... 2 3 Quantitative data analysis tools in Excel... 3 4 Entering your data... 6 5 Preparing
03 The full syllabus. 03 The full syllabus continued. For more information visit www.cimaglobal.com PAPER C03 FUNDAMENTALS OF BUSINESS MATHEMATICS
 0 The full syllabus 0 The full syllabus continued PAPER C0 FUNDAMENTALS OF BUSINESS MATHEMATICS Syllabus overview This paper primarily deals with the tools and techniques to understand the mathematics
THE BINOMIAL DISTRIBUTION & PROBABILITY
 REVISION SHEET STATISTICS 1 (MEI) THE BINOMIAL DISTRIBUTION & PROBABILITY The main ideas in this chapter are Probabilities based on selecting or arranging objects Probabilities based on the binomial distribution
Lecture 2: Descriptive Statistics and Exploratory Data Analysis
 Lecture 2: Descriptive Statistics and Exploratory Data Analysis Further Thoughts on Experimental Design 16 Individuals (8 each from two populations) with replicates Pop 1 Pop 2 Randomly sample 4 individuals
Lecture 19: Chapter 8, Section 1 Sampling Distributions: Proportions
 Lecture 19: Chapter 8, Section 1 Sampling Distributions: Proportions Typical Inference Problem Definition of Sampling Distribution 3 Approaches to Understanding Sampling Dist. Applying 68-95-99.7 Rule
LAB 4 INSTRUCTIONS CONFIDENCE INTERVALS AND HYPOTHESIS TESTING
 LAB 4 INSTRUCTIONS CONFIDENCE INTERVALS AND HYPOTHESIS TESTING In this lab you will explore the concept of a confidence interval and hypothesis testing through a simulation problem in engineering setting.
Paper 1. Calculator not allowed. Mathematics test. First name. Last name. School. Remember KEY STAGE 3 TIER 6 8
 Ma KEY STAGE 3 Mathematics test TIER 6 8 Paper 1 Calculator not allowed First name Last name School 2009 Remember The test is 1 hour long. You must not use a calculator for any question in this test. You
Unit 31 A Hypothesis Test about Correlation and Slope in a Simple Linear Regression
 Unit 31 A Hypothesis Test about Correlation and Slope in a Simple Linear Regression Objectives: To perform a hypothesis test concerning the slope of a least squares line To recognize that testing for a
Chapter 13 Introduction to Linear Regression and Correlation Analysis
 Chapter 3 Student Lecture Notes 3- Chapter 3 Introduction to Linear Regression and Correlation Analsis Fall 2006 Fundamentals of Business Statistics Chapter Goals To understand the methods for displaing
Business Statistics. Successful completion of Introductory and/or Intermediate Algebra courses is recommended before taking Business Statistics.
 Business Course Text Bowerman, Bruce L., Richard T. O'Connell, J. B. Orris, and Dawn C. Porter. Essentials of Business, 2nd edition, McGraw-Hill/Irwin, 2008, ISBN: 978-0-07-331988-9. Required Computing
Testing Group Differences using T-tests, ANOVA, and Nonparametric Measures
 Testing Group Differences using T-tests, ANOVA, and Nonparametric Measures Jamie DeCoster Department of Psychology University of Alabama 348 Gordon Palmer Hall Box 870348 Tuscaloosa, AL 35487-0348 Phone:
Myth or Fact: The Diminishing Marginal Returns of Variable Creation in Data Mining Solutions
 Myth or Fact: The Diminishing Marginal Returns of Variable in Data Mining Solutions Data Mining practitioners will tell you that much of the real value of their work is the ability to derive and create
Measurement & Data Analysis. On the importance of math & measurement. Steps Involved in Doing Scientific Research. Measurement
 Measurement & Data Analysis Overview of Measurement. Variability & Measurement Error.. Descriptive vs. Inferential Statistics. Descriptive Statistics. Distributions. Standardized Scores. Graphing Data.
Midterm Review Problems
 Midterm Review Problems October 19, 2013 1. Consider the following research title: Cooperation among nursery school children under two types of instruction. In this study, what is the independent variable?
Friedman's Two-way Analysis of Variance by Ranks -- Analysis of k-within-group Data with a Quantitative Response Variable
 Friedman's Two-way Analysis of Variance by Ranks -- Analysis of k-within-group Data with a Quantitative Response Variable Application: This statistic has two applications that can appear very different,
Adding and Subtracting Fractions. 1. The denominator of a fraction names the fraction. It tells you how many equal parts something is divided into.
 Tallahassee Community College Adding and Subtracting Fractions Important Ideas:. The denominator of a fraction names the fraction. It tells you how many equal parts something is divided into.. The numerator
Exploratory data analysis (Chapter 2) Fall 2011
 Fall 2011") Exploratory data analysis (Chapter 2) Fall 2011 Data Examples Example 1: Survey Data 1 Data collected from a Stat 371 class in Fall 2005 2 They answered questions about their: gender, major, year in school,
Exploratory data analysis (Chapter 2) Fall 2011 Data Examples Example 1: Survey Data 1 Data collected from a Stat 371 class in Fall 2005 2 They answered questions about their: gender, major, year in school,
" Y. Notation and Equations for Regression Lecture 11/4. Notation:
 Notation: Notation and Equations for Regression Lecture 11/4 m: The number of predictor variables in a regression Xi: One of multiple predictor variables. The subscript i represents any number from 1 through
CHAPTER THREE COMMON DESCRIPTIVE STATISTICS COMMON DESCRIPTIVE STATISTICS / 13
 COMMON DESCRIPTIVE STATISTICS / 13 CHAPTER THREE COMMON DESCRIPTIVE STATISTICS The analysis of data begins with descriptive statistics such as the mean, median, mode, range, standard deviation, variance,
Characteristics of Binomial Distributions
 Lesson2 Characteristics of Binomial Distributions In the last lesson, you constructed several binomial distributions, observed their shapes, and estimated their means and standard deviations. In Investigation
The GED math test gives you a page of math formulas that
 Math Smart 643 The GED Math Formulas The GED math test gives you a page of math formulas that you can use on the test, but just seeing the formulas doesn t do you any good. The important thing is understanding
Simple linear regression
 Simple linear regression Introduction Simple linear regression is a statistical method for obtaining a formula to predict values of one variable from another where there is a causal relationship between
Advanced Topics in Statistical Process Control
 Advanced Topics in Statistical Process Control The Power of Shewhart s Charts Second Edition Donald J. Wheeler SPC Press Knoxville, Tennessee Contents Preface to the Second Edition Preface The Shewhart
Introduction to. Hypothesis Testing CHAPTER LEARNING OBJECTIVES. 1 Identify the four steps of hypothesis testing.
 Introduction to Hypothesis Testing CHAPTER 8 LEARNING OBJECTIVES After reading this chapter, you should be able to: 1 Identify the four steps of hypothesis testing. 2 Define null hypothesis, alternative