Statistical Analyses and Summary of Analytical Round Robin #5 a Data Comparability Study Report prepared by Raymond E. Leary December 2012
|
|
|
- Ezra Daniels
- 9 years ago
- Views:
Transcription
1 Statistical Analyses and Summary of Analytical Round Robin #5 a Data Comparability Study Report prepared by Raymond E. Leary December 2012 Samples collected October 18, 2010 from the Florida State University Coastal and Marine Laboratory and Alligator Harbor, FL Preserved and split October 19, and shipped October 20, 2010 at the Florida Department of Environmental Protection s Central Laboratory, Tallahassee, FL

2 Table of Contents 1. Introduction 1 2. Determining comparability 4 3. Results and Discussion 6 A. Total Kjeldahl Nitrogen 6 B. Ammonia 12 C. Total Nitrate + Nitrite 16 D. Dissolved Nitrite 21 E. Total Phosphorus 25 F. Orthophosphate 31 G. Total Organic Carbon 36 H. Chlorophyll a 41 I. Biochemical Oxygen Demand 47 J. Carbonaceous Biochemical Oxygen Demand Conclusions References 55 Appendix 1. Results 56 Appendix 2. Summary Statistics 60 Appendix 3. Boxplots 62

3 1. Introduction Many groups routinely take measurements in ambient waters of the Gulf of Mexico. However, each group uses slightly different standard operating procedures (SOPs), equipment, and standards, which leads to an unknown amount of variability in the data collected. This lack of data comparability has been the subject of many discussions. The Gulf of Mexico Alliance (GOMA) identified the need to assess this variability and to explore ways to decrease variability in the data values based solely on changes to SOPs. The GOMA initiated its analytical round robin efforts in February 2008 to address this need. In September 2007, GOMA workshop participants established a core set of analytes (see Table 1 for the analytes analyzed in this round robin and their method of preservation) for adoption by Gulf of Mexico monitoring programs. This fifth analytical round robin addresses the variability in these analytes among participating Gulf of Mexico laboratories. This report presents information on the collection and methods used to prepare the water for analyses, the results from the laboratories, and the statistical analyses that were conducted to assess the comparability of the data. Analyte Acid preserved 0.45-µm filtered Chlorophyll a (it is unclear if results are corrected or uncorrected for phaeophytin) No No Biochemical Oxygen Demand No No Carbonaceous Biochemical Oxygen Demand No No Total Kjeldahl Nitrogen Yes No Ammonia Yes No Total Nitrate + Nitrite Yes No Total Phosphorous Yes No Total Organic Carbon Yes No Dissolved Nitrite No Yes Orthophosphate No Yes Table 1. Core analytes and preservation methods for this round robin. A total of ten laboratories, representing local, state, federal, academic, and private laboratories participated in this round robin. Samples were collected on 18 October 2010 from the Florida State University Coastal and Marine Laboratory (FSU CML) and from Alligator Harbor, FL by Linda Sedlacek and Heather Ritchie. Sites were selected in an effort to provide one sample that was high in nutrients and another low in nutrients. Water was collected from FSU CML using its seawater system which had been unused for months prior and was not flushed before collection. Dead algae were noted in the system, and may elucidate the effects of a significant phaeophytin fraction upon chlorophyll results. Field measurements are listed in Table 2. FSU CML Alligator Harbor Depth (m) ~2 ~0.3 Temperature (ºC) ph Dissolved Oxygen (mg/l) Salinity (PSU) Conductivity (ms) Table 2. Field measurements. The Florida Department of Environmental Protection s Central Laboratory in Tallahassee, FL hosted the round robin event. For each participating laboratory, samples were split to provide: 1 L of unfiltered, unpreserved sample for chlorophyll a (ChlA) 1
 identified the need to assess this variability and to explore ways to decrease variability in the data values based solely on changes to SOPs.")
4 1 L of unfiltered, unpreserved sample for biochemical oxygen demand (BOD) 1 L of unfiltered, unpreserved sample for carbonaceous biochemical oxygen demand (CBOD) 250 ml of unfiltered, acid-preserved sample for total nitrate + nitrite (NO x), ammonia (NH 3), Total Kjeldahl Nitrogen (TKN), total phosphorous (TP), and total organic carbon (TOC) 125 ml of 0.45-µm filtered, unpreserved sample for orthophosphate (OP) and dissolved nitrite (DNO 2) Samples for each bottle type were kept homogenized by constant stirring. In an effort to ensure that some values were above the laboratories detection limits, the FSU CML filtered, unpreserved sample was spiked with orthophosphate (enough to raise the value mg/l) and nitrite (enough to raise the value mg/l) before splitting; the FSU CML acidpreserved, unfiltered sample was spiked with ammonia (enough to raise the value mg/l) before splitting. Each laboratory received three replicates of each of the above sample types for sites. Samples were kept in a walk-in cooler at 4 ºC until shipment, and were shipped on ice in coolers. Laboratories were given approximately six weeks to complete their analyses and provide results. Many of the methods utilized by participating laboratories involved are considered equivalent. Table 3 lists the methods used. One of the goals of this, and future round robins, is to test the true equivalency of these methods. We measured true equivalency by statistically analyzing the variability in data reported between methods; our analyses required that each laboratory report only values above its detection limit. TKN NH 3 Total NO x EPA EPA EPA Lachat 10- Lachat 10- Lachat D C 04-1-C USGS I SM 4500 NH 3 G SM 4500 NO 3 F Dissolved NO 2 EPA Lachat C SM 4500 NO 2 B EPA EPA TP OP TOC ChlA BOD CBOD Lachat C EPA Lachat I SM 4500 P E EPA SM 5310 B SM 5310 C USGS I USGS I SM 4500 P F USGS I Table 3. Methods used by laboratories participating in the fifth analytical round robin. EPA SM 5210 B SM 5210 B SM H SM 5210 C 2

5 Laboratories participating in Analytical Round Robin #5: ADEM_Mon Alabama Department of Environmental Management, Montgomery, Field Operations Central Laboratory (AL) EPA U.S. Environmental Protection Agency, Region 4 Laboratory (GA) EPCHC Environmental Protection Commission of Hillsborough County (FL) FDEP Florida Department of Environmental Protection Central Laboratory, Tallahassee (FL) MDEQ Mississippi Department of Environmental Quality (MS) Sanders Sanders Laboratories, Inc. (FL) SERC Florida International University, Southeast Environmental Research Center (FL) SWFWMD Southwest Florida Water Management District, Data Collection Bureau, Chemistry Laboratory (FL) TCEQ Texas Commission on Environmental Quality, Houston Laboratory (TX) USGS USGS National Water Quality Laboratory (CO) 3
 SERC Florida International University, Southeast Environmental Research Center (FL) SWFWMD Southwest Florida Water Management District, Data Collection Bureau, Chemistry Laboratory (FL) TCEQ")
6 2. Determining comparability GOMA Analytical Round Robin #5 In all analyses, the actual value reported by the laboratory was used regardless of significant figures, with the exception of those requiring conversion (e.g., µg/l to mg/l). However, data in this report are typically displayed to two or three decimal places. Data values reported by the laboratories are displayed graphically. Data were analyzed using statistical methods developed by Hoaglin et al (1983) which are used in the U.S. Geological Survey s Standard Reference Samples (SRS) round robins (e.g., Woodworth and Connor 2003). Variability among laboratories was measured by calculating F- pseudosigma, which approximates the standard deviation without the assumption of normal distribution. It is considered a robust statistic because outliers have little influence resulting from a higher breakdown point than that of the mean. The %F-pseudosigma, which is equivalent to % relative standard deviation (%RSD) under normal distributions, was also calculated. In order to evaluate inter-laboratory variability, Z-values were calculated; the average of these was used to rate the laboratories performance. The absolute Z-values are rated as follows: = excellent; = good; = satisfactory; = marginal; and >2.00 = unsatisfactory. Z-values greater than 6 typically are the result of mistakes due to unit conversions, calculation errors, dilution errors, transcription errors (and other typographical errors), etc. (e.g., QUASIMEME 2012). Although this system of rating will be used, it is important to note that, as the group s precision increases, the Z-values can become inflated, making comparable values appear to be non-comparable. These three methods are used when at least seven laboratories report at least three detectable values (i.e., N 21; roughly a 60% chance of being able to detect a difference in values based on power analysis). In situations where less than 21 values are reported, summary statistics and robust estimators (based on Kaplan-Meier; e.g., Helsel 2012) are provided; no further analyses are performed. In addition, robust estimators are given for analytes with non-values (i.e., data reported or qualified as qualifier codes such as: <, <PQL, BDL, etc.). False negatives are evaluated using the U.S.G.S. SRS method. To be considered a false negative, a result must be reported as a nonvalue and the detection/quantitation limit must be more than 2 F-pseudosigma below the median. Outliers are evaluated using a variety of statistical methods, including Mahalanobis D 2, Rosner s test and Dixon s test. For post hoc comparisons (between subjects tests for interlaboratory comparisons), if only one value was reported, it was combined with the laboratory reporting multiple results whose mean and median were closest to the individual value and whose range of data contained that individual value. Whether statistical assumptions (normality, homoscedasticity, independence, balanced design, etc.) are met or not guides the selection of statistical tests employed. Note: The breakdown point of a statistic is a measure of how many values one would have to change in order to have the statistic change. For the mean, it requires only one extreme outlier to do this. To change the median, at least one-half of all values must become extreme outliers. For example, in a set of five values: 1, 2, 1, 3, and 2, the mean is 1.8 and the median is 2. If the 3 in this set is increased to 300, the mean becomes 61.2; however, the median is still 2. Note: Within-subjects tests are comparisons of three or more groups. They indicate only that there is a difference among groups, but do not identify which ones or distinguish how they differ. Examples are ANOVA and Kruskal-Wallis. Between-subjects tests are a follow-up to the within-subjects test (i.e., post hoc). They identify the group(s) that is different and how they 4

7 differ. These include Gabriel s test, Dunnett s T 3, Tukey s Honestly Significant Difference (HSD), Tukey-Kramer test, t-tests, Mann-Whitney, and many other pair-wise comparisons. In a comparison of only two groups, the within-subjects test and the between-subjects tests render the same results. Table 4 lists the analytes and the number of laboratories that carried out each. FSU CML Alligator Harbor Analyte N laboratories N values >MDL N laboratories N values >MDL TKN NH * NO x * DNO * TP * OP * TOC ChlA BOD 6 10* 6 15 CBOD 6 7* 6 11* * More results were reported as above the MDL, but no value was given (i.e., only a qualifier [<PQL, I, etc.] was listed). These were treated as non-detects. Table 4. Analytes of interest for this round robin; the number of laboratories that ran each; and the number of values above a given laboratory s detection limit. Laboratory identities were concealed by assigning letter designations so that laboratories do not feel judged by their results. Furthermore, in order to maintain anonymity, laboratories are not listed with the analyses they conducted or the number of results they reported. The GOMA round robins are critical in helping achieve data comparability, and serve as a tool for groups to speak freely about what they are and are not comfortable with in their methodology, rather than as a way to grade programs on their results. 5
. These were treated as non-detects.")
8 3. Results and Discussion GOMA Analytical Round Robin #5 A. Total Kjeldahl Nitrogen. Seventeen of the 21 values for FSU CML were within acceptable ranges. Lab E reported two values outside acceptable ranges, and Labs A and I both reported one value outside acceptable ranges. There were no statistical outliers. The %F-pseudosigma value was moderate (between 20 and 30%), indicating a lack of precision among laboratories. Of the 21 reported values, 62% were within 1 F-pseudosigma and 81% were within 2 F- pseudosigma. Method Lachat D was statistically significantly lower than the other methods. At Alligator Harbor, 16 of the 21 values were within acceptable ranges. Labs E and I reported two values outside acceptable ranges, and Lab G reported one value outside acceptable ranges. The %F-pseudosigma value was small (between 10 and 20%), indicating a high degree of precision among laboratories. Of the 21 reported values, 67% were within 1 F-pseudosigma and 76% were within 2 F-pseudosigma. At both locations, Lab E s values were highly variable, and Lab I s values were higher than most of the other values. There was no statistical difference among methods; however, Lachat D was considerably lower than the other two methods. See Figures 1 3 and Table 5-11 for scatter-plots of values obtained by individual laboratories, F-pseudosigma values, summary statistics, inter-laboratory comparisons, and method comparisons. Total Kjeldahl Nitrogen FSU CML F-pseudosigma % F-pseudosigma Median Range % Method N Mean Median Range EPA Lachat D USGS I Alligator Harbor F-pseudosigma % F-pseudosigma Median Range % Method N Mean Median Range EPA Lachat D USGS I Table 5. F-pseudosigma values for TKN. FSU CML TKN Alligator Harbor Lab ID N Lab Median Range Mean Z-value N Lab Median Range Mean Z-value A B C E G I J Table 6. Summary statistics and Z-values by laboratory for TKN. 6

9 Descriptives Total Kjeldahl Nitrogen mg/l N Mean Std. Deviation Std. Error 95% Confidence Interval for Mean Minimum Maximum Lower Bound Upper Bound A B C E G I J Total Table 7. Descriptive statistics by laboratory for TKN for FSU CML. Descriptives Total Kjeldahl Nitrogen mg/l N Mean Std. Deviation Std. Error 95% Confidence Interval for Mean Minimum Maximum Lower Bound Upper Bound A B C E G I J Total Table 8. Descriptive statistics by laboratory for TKN for Alligator Harbor. 7


10 Figure 1. Scatter-plot of TKN values obtained by seven laboratories for FSU CML. The solid line indicates the overall median, and the dashed lines indicate +/- 1 F-pseudosigma. Figure 2. Scatter-plot of TKN values obtained by seven laboratories for Alligator Harbor. The solid line indicates the overall median, and the dashed lines indicate +/- 1 F-pseudosigma. 8

11 1 Hypothesis Test Summary Null Hypothesis Test Sig. Decision The distribution of Total Kjeldahl Nitrogen mg/l is the same across categories of Lab_ID. Independent-Samples Kruskal-Wallis Test.007 Asymptotic significances are displayed. The significance level is.05. Homogeneous Subsets based on Total Kjeldahl Nitrogen mg/l Sample 1 Subset A J B G C I E Test Statistic Sig. (2-sided test) Adjusted Sig. (2-sided test) Homogeneous subsets are based on asymptotic significances. The significance level is Each cell shows the sample average rank of Total Kjeldahl Nitrogen mg/l. Reject the null hypothesis. Table 9. Kruskal-Wallis and post hoc inter-laboratory comparisons for TKN from FSU CML. 9

12 Figure 3. Results of Kruskal-Wallis test of TKN by laboratory for Alligator Harbor. Multiple Comparisons Dependent Variable: Total Kjeldahl Nitrogen mg/l (I) Method ID (J) Method ID Mean Difference (I-J) Std. Error Sig. 95% Confidence Interval Lower Bound Upper Bound EPA Lachat D * USGS I Dunnett s T 3 Lachat D USGS I EPA * USGS I * EPA Lachat D * Method ID N Subset for alpha = Lachat D USGS I EPA *. The mean difference is significant at the 0.05 level. Table 10. Post hoc comparisons for TKN values by method for all reported values for FSU CML. 10

13 Test of Homogeneity of Variances Total Kjeldahl Nitrogen mg/l Levene s Statistic df1 df2 Sig ANOVA Sum of Squares df Mean Square F Sig. Between Groups Within Groups Total TKN_ID N Subset for alpha = Lachat D Gabriel a,b EPA USGS I Sig..695 Means for groups in homogeneous subsets are displayed. a. Uses Harmonic Mean Sample Size = b. The group sizes are unequal. The harmonic mean of the group sizes is used. Type I error levels are not guaranteed. Table 11. ANOVA and post hoc comparisons for TKN values by method for all reported values for Alligator Harbor. 11

14 B. Ammonia. Fifteen of the 27 reported values for FSU CML were within acceptable ranges. Labs A, C, E, and I reported all values outside acceptable ranges. No values were determined to be statistical outliers; however, Lab I s values were quite high. There were no results that were reported as non-values. The %F-pseudosigma value was moderate (between 20 and 30%), indicating a lack of precision among laboratories. Of the 27 reported values, 56% were within 1 F-pseudosigma; no other values were within 2 F-pseudosigma. Method Lachat J was significantly lower than the other methods. At Alligator Harbor, twelve of the 27 results were reported values; the other 56% were reported as qualifiers. There were no statistical outliers. The MDLs ranged from to 0.02 mg/l; and the PQLs for Labs A, E, and G ranged from 0.02 to 0.05 mg/l. There were no values reported as less than detection/quantitation limits that were determined to be false negatives. Method EPA was the only method to report values. No other analyses were conducted for ammonia for Alligator Harbor. Values reported by Lab I were high for both sites. See Figures 4 & 5 and Tables for scatter-plots of values obtained by individual laboratories, F-pseudosigma values, summary statistics, inter-laboratory comparisons, and method comparisons. Ammonia FSU CML F-pseudosigma % F-pseudosigma Median Range % Method N Mean Median Range EPA Lachat J SM 4500 NH3 G Alligator Harbor F-pseudosigma % F-pseudosigma Median Range % Method N Mean Median Range EPA (nine non-values) Lachat J 3 All Non-detect N/A N/A SM 4500 NH3 G 3 All Non-detect N/A N/A Table 12. F-pseudosigma values for ammonia. FSU CML NH 3 Alligator Harbor Lab ID N Lab Median Range Mean Z-value N Lab Median Range Mean Z-value A * NR NR NR B N/A C N/A E * NR NR NR F * NR NR NR G * NR NR NR H N/A I N/A J * NR NR NR * One or more non-value reported. NR = all non-values reported. Table 13. Summary statistics and Z-values by laboratory for ammonia. 12

15 Ammonia Method MDL Range PQL Range ALL EPA Lachat J SM 4500 NH3 G Table 14. Methods and detection/quantitation limits for NH 3. Descriptives Ammonia mg/l N Mean Std. Deviation Std. Error 95% Confidence Interval for Mean Minimum Maximum Lower Bound Upper Bound A B C E F G H I J Total Table 15. Descriptive statistics by laboratory for ammonia for FSU CML. Descriptives Ammonia mg/l N Mean Std. Deviation Std. Error 95% Confidence Interval for Mean Minimum Maximum Lower Bound Upper Bound B C H I Total Table 16. Descriptive statistics by laboratory for ammonia for Alligator Harbor. 13

16 Figure 4. Scatter-plot of ammonia values obtained by nine laboratories for FSU CML. The solid line indicates the overall median, and the dashed lines indicate +/- 1 F-pseudosigma. Figure 5. Scatter-plot of ammonia values and detection/quantitation limits obtained by nine laboratories for Alligator Harbor. 14

17 1 Hypothesis Test Summary Null Hypothesis Test Sig. Decision The distribution of Ammonia mg/l is the same across categories of Lab_ID. Independent-Samples Kruskal-Wallis Test Asymptotic significances are displayed. The significance level is.05. Sample Homogeneous Subsets based on Ammonia mg/l E A Reject the null hypothesis. Subset F G B H J C I Test Statistic Sig. (2-sided test) Adjusted Sig. (2-sided test) Homogeneous subsets are based on asymptotic significances. The significance level is Each cell shows the sample average rank of Ammonia mg/l. 2 Unable to compute because the subset contains only one sample. Table 17. Kruskal-Wallis and post hoc inter-laboratory comparisons for ammonia from FSU CML. Multiple Comparisons Dependent Variable: Ammonia mg/l (I) Method ID (J) Method ID Mean Difference (I-J) Std. Error Sig. 95% Confidence Interval Lower Bound Upper Bound EPA Lachat J * SM 4500 NH3 G Dunnett s Lachat EPA * T 3 J SM 4500 NH3 G * SM 4500 NH3 G EPA Lachat J * Method ID N Subset for alpha = Lachat J SM 4500 NH3 G EPA *. The mean difference is significant at the 0.05 level. Table 18. Post hoc comparisons for ammonia values by method for all reported values for FSU CML. 15
...111.053.061. Adjusted Sig. (2-sided test)...325.127.189. Homogeneous subsets are based on asymptotic significances. The significance level is.05. 1 Each cell shows the sample average rank of Ammonia mg/l.")
18 C. Total Nitrite + Nitrate. Twenty-one of the 24 reported values for FSU CML were within acceptable ranges. Lab E reported all three values outside acceptable ranges, two of which were statistical outliers (0.46 mg/l for both). The %F-pseudosigma value was large (greater than 30%), indicating a lack of precision among laboratories. Of the 24 reported values, 75% were within 1 F-pseudosigma and 88% were within 2 F-pseudosigma. There was no statistical difference among the four methods. At Alligator Harbor, seven of the 24 results were reported values; the other 71% were reported as qualifiers. There were no statistical outliers. The MDLs ranged from to 0.02 mg/l; and the PQLs for Labs A and G ranged from 0.02 to 0.04 mg/l. There were no values reported as less than detection/quantitation limits that were determined to be false negatives. No other analyses were conducted for NO x for Alligator Harbor, due to the paucity of reported values. See Figures 6-8 and Tables for scatter-plots of values obtained by individual laboratories, F-pseudosigma values, summary statistics, inter-laboratory comparisons, and method comparisons. NO x FSU CML F-pseudosigma % F-pseudosigma Median Range % Method N Mean Median Range EPA Lachat C SM 4500 N03 F USGS I Alligator Harbor F-pseudosigma % F-pseudosigma Median Range % Method N Mean Median Range EPA (eleven non-values) Lachat C SM 4500 N03 F 3 All Non-detect N/A N/A USGS I All Non-detect N/A N/A Table 19. F-pseudosigma values for NO x. FSU CML NO x Alligator Harbor Lab ID N Lab Median Range Mean Z-value N Lab Median Range Mean Z-value A N/A B * NR NR NR C * NR NR NR E N/A F * NR NR NR G * NR NR NR I * N/A N/A J * NR NR NR Table 20. Summary statistics and Z-values by Laboratory for NO x. 16

19 NO x Method MDL Range PQL Range All EPA Lachat C SM 4500 N03 F USGS I Not Reported Table 21. Methods and detection/quantitation limits for NO x. Descriptives Total NO 3 + NO 2 mg/l N Mean Std. Deviation Std. Error 95% Confidence Interval for Mean Minimum Maximum Lower Bound Upper Bound A B C E F G I J Total Table 22. Descriptive statistics by laboratory for NO x for FSU CML. Descriptives Total NO3 + NO2 mg/l N Mean Std. Deviation Std. Error 95% Confidence Interval for Mean Minimum Maximum Lower Bound Upper Bound A E I N/A N/A N/A N/A Total Table 23. Descriptive statistics by laboratory for NO x for Alligator Harbor. 17

20 Figure 6. Scatter-plot of NO x values obtained by eight laboratories for FSU CML. The solid line indicates the overall median, and the dashed lines indicate +/- 1 F-pseudosigma. Figure 7. Scatter-plot of NO x values and detection/quantitation limits obtained by eight laboratories for Alligator Harbor. 18

21 1 Hypothesis Test Summary Null Hypothesis Test Sig. Decision The distribution of Total NO 3 + NO 2 mg/l is the same across categories of Lab_ID. Independent-Samples Kruskal-Wallis Test Asymptotic significances are displayed. The significance level is.05. Sample Homogeneous Subsets based on Total NO3 + NO2 mg/l F J I E Subset Reject the null hypothesis C B A G Test Statistic Sig. (2-sided test) Adjusted Sig. (2-sided test) Homogeneous subsets are based on asymptotic significances. The significance level is Each cell shows the sample average rank of Total NO 3 + NO 2 mg/l. 2 Unable to compute because the subset contains only one sample. Table 24. Kruskal-Wallis and post hoc inter-laboratory comparisons for NO x from FSU CML. 19
22 Figure 8. Results of Kruskal-Wallis method comparisons for NO x from FSU CML. 20
23 D. Dissolved Nitrite. Twenty-four of the 27 reported values for FSU CML were within acceptable ranges. Lab G reported two values outside acceptable ranges, and Lab I reported one. There were no statistical outliers. The %F-pseudosigma value was very small (less than 10%), indicating a high degree of precision among laboratories. Of the 27 reported values, 67% were within 1 F-pseudosigma and 89% were within 2 F-pseudosigma. Results derived from Method SM 4500 NO2 B were statistically lower than results from all other methods; Lachat C results were significantly lower than those from USGS I , and EPA results were equivalent to both Lachat C and USGS I At Alligator Harbor, six of the 27 results were reported values; the other 78% were reported as qualifiers. There were no statistical outliers. The MDLs ranged from to mg/l; and the PQLs for Labs A and G ranged from to 0.02 mg/l. There were no values reported as less than detection/quantitation limits that were determined to be false negatives. Method EPA was the only method to report values. No other analyses were conducted for DNO 2 for Alligator Harbor. See Figures 9 & 10 and Tables for scatter-plots of values obtained by individual laboratories, F-pseudosigma values, summary statistics, inter-laboratory comparisons, and method comparisons. DNO 2 FSU CML F-pseudosigma % F-pseudosigma Median Range % Method N Mean Median Range EPA Lachat C SM 4500 N02 B USGS I Alligator Harbor F-pseudosigma % F-pseudosigma Median Range % Method N Mean Median Range EPA (twelve non-values) Lachat C 3 All Non-detect N/A N/A SM 4500 N02 B 3 All Non-detect N/A N/A USGS I All Non-detect N/A N/A Table 25. F-pseudosigma values for DNO 2. DNO 2 FSU CML Alligator Harbor Lab ID N Lab Median Range Mean Z-value N Lab Median Range Mean Z-value A * NR NR NR B * NR NR NR C * NR NR NR E N/A F * NR NR NR G * NR NR NR H N/A I * NR NR NR J * NR NR NR * One or more non-values reported. NR = all non-values reported. Table 26. Summary statistics and Z-values by Laboratory for DNO 2. 21
24 DNO 2 Method MDL Range PQL Range All EPA Lachat C SM 4500 N02 B USGS I Not Reported Table 27. Methods and detection/quantitation limits for DNO 2. Descriptives Dissolved Nitrite mg/l N Mean Std. Deviation Std. Error 95% Confidence Interval for Mean Minimum Maximum Lower Bound Upper Bound A B C E F G H I J Total Table 28. Descriptive statistics by laboratory for DNO 2 for FSU CML. Descriptives Dissolved Nitrite mg/l N Mean Std. Deviation Std. Error 95% Confidence Interval for Mean Minimum Maximum Lower Bound Upper Bound E H Total Table 29. Descriptive statistics by laboratory for DNO 2 for Alligator Harbor. 22
25 Figure 9. Scatter-plot of DNO 2 values and detection limits obtained by nine laboratories for FSU CML. The solid line indicates the overall median, and the dashed lines indicate +/- 1 F-pseudosigma. Figure 10. Scatter-plot of NO 2 values and detection limits obtained by nine laboratories for Alligator Harbor. 23
26 Dissolved Nitrite mg/l Lab_ID N Subset for alpha = B J H F Gabriel a E A C I G Sig Means for groups in homogeneous subsets are displayed. a. Uses Harmonic Mean Sample Size = Table 30. Post hoc inter-laboratory comparisons for DNO 2 from FSU CML. Multiple Comparisons Dependent Variable: Dissolved Nitrite mg/l (I) Method ID (J) Method ID Mean Difference (I-J) Std. Error Sig. 95% Confidence Interval Lower Bound Upper Bound Lachat C EPA SM 4500 N02 B * USGS I EPA Lachat C SM 4500 N02 B * Dunnett s T 3 USGS I * EPA * SM 4500 N02 B Lachat C * USGS I * EPA USGS I Lachat C * SM 4500 N02 B * Method ID N Subset for alpha = SM 4500 N02 B Lachat C EPA USGS I *. The mean difference is significant at the 0.05 level. Table 31. Post hoc comparisons for DNO 2 values by method for FSU CML. 24
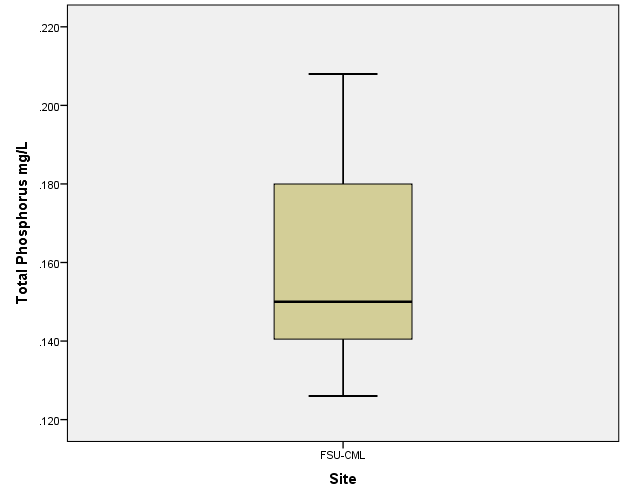
27 E. Total Phosphorus. All of the 27 reported values for FSU CML were within acceptable ranges. There were no outliers or non-values reported. The %F-pseudosigma value was moderate (between 10 and 20%), indicating a high degree of precision among laboratories. Of the 27 reported values, 78% were within 1 F-pseudosigma and 100% were within 2 F- pseudosigma. Method EPA was significantly higher than the other two methods. At Alligator Harbor, 22 of the 26 values were within acceptable ranges. Labs B and I reported two values outside acceptable ranges. Lab G reported the only non-value; however, this was not a false-negative. The %F-pseudosigma value was high (greater than 30%), indicating a lack of precision among laboratories. Of the 26 reported values, 69% were within 1 F-pseudosigma and 85% were within 2 F-pseudosigma. Results derived from Method EPA were statistically lower than those from the other two methods. See Figures 11 & 12 and Tables for scatter-plots of values obtained by individual laboratories, F-pseudosigma values, summary statistics, inter-laboratory comparisons, and method comparisons. TP FSU CML F-pseudosigma % F-pseudosigma Median Range % Method N Mean Median Range EPA EPA Lachat C Alligator Harbor F-pseudosigma % F-pseudosigma Median Range % Method N Mean Median Range EPA EPA (one non-value) Lachat C Table 31. F-pseudosigma values for TP. TP FSU CML Alligator Harbor Lab ID N Lab Median Range Mean Z-value N Lab Median Range Mean Z-value A B C E F G * H I J * One non-value reported. Table 32. Summary statistics and Z-values by Laboratory for TP. 25
28 Descriptives Total Phosphorus mg/l N Mean Std. Deviation Std. Error 95% Confidence Interval for Mean Minimum Maximum Lower Bound Upper Bound A B C E F G H I J Total Table 33. Descriptive statistics by laboratory for TP for FSU CML. Descriptives Total Phosphorus mg/l N Mean Std. Deviation Std. Error 95% Confidence Interval for Mean Minimum Maximum Lower Bound Upper Bound A B C E F G H I J Total Table 34. Descriptive statistics by laboratory for TP for Alligator Harbor. 26

29 Figure 11. Scatter-plot of TP values obtained by nine laboratories for FSU CML. The solid line indicates the overall median, and the dashed lines indicate +/- 1 F-pseudosigma. Figure 12. Scatter-plot of TP values and one detection limit obtained by nine laboratories for Alligator Harbor. The solid line indicates the overall median, and the dashed lines indicate +/- 1 F-pseudosigma. 27
30 1 Hypothesis Test Summary Null Hypothesis Test Sig. Decision The distribution of Total Phosphorus mg/l is the same across categories of Lab_ID. Independent-Samples Kruskal-Wallis Test Asymptotic significances are displayed. The significance level is.05. Sample Homogeneous Subsets based on Total Phosphorus mg/l J H F Subset Reject the null hypothesis E A C I G B Test Statistic Sig. (2-sided test) Adjusted Sig. (2-sided test) Homogeneous subsets are based on asymptotic significances. The significance level is Each cell shows the sample average rank of Total Phosphorus mg/l. 2 Unable to compute because the subset contains only one sample. Table 35. Kruskal-Wallis and nonparametric post hoc inter-laboratory comparisons for TP for FSU CML. 28
31 1 Hypothesis Test Summary Null Hypothesis Test Sig. Decision The distribution of Total Phosphorus mg/l is the same across categories of Lab_ID. Independent-Samples Kruskal-Wallis Test Asymptotic significances are displayed. The significance level is.05. Sample Homogeneous Subsets based on Total Phosphorus mg/l E F C Subset Reject the null hypothesis J H A G I B Test Statistic Sig. (2-sided test) Adjusted Sig. (2-sided test) Homogeneous subsets are based on asymptotic significances. The significance level is Each cell shows the sample average rank of Total Phosphorus mg/l. Table 36. Kruskal-Wallis test and results of nonparametric inter-laboratory comparisons of TP for Alligator Harbor. Total Phosphorus mg/l Tukey-Kramer a,b Method ID N Subset for alpha = EPA Lachat C EPA Sig Means for groups in homogeneous subsets are displayed. a. Uses Harmonic Mean Sample Size = b. The group sizes are unequal. The harmonic mean of the group sizes is used. Type I error levels are not guaranteed. Table 37. Post hoc comparisons for TP values by method for FSU CML. 29
32 Multiple Comparisons Dependent Variable: Total Phosphorus mg/l (I) Method ID (J) Method ID Mean Difference (I-J) Std. Error Sig. 95% Confidence Interval Lower Bound Upper Bound EPA EPA * Lachat C * Dunnett s T 3 EPA EPA * Lachat C Lachat C EPA * EPA Method ID N Subset for alpha = EPA Lachat C EPA *. The mean difference is significant at the 0.05 level. Table 38. Post hoc comparisons for TP values by method for all reported values for Alligator Harbor. 30
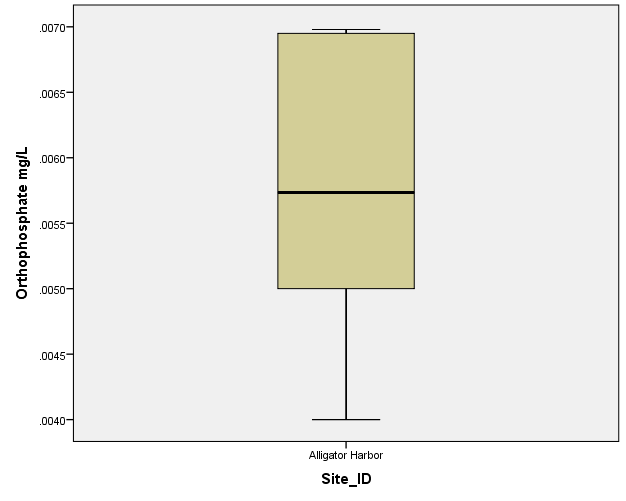
33 F. Orthophosphate. Twenty-six of the 27 reported values for FSU CML were within acceptable ranges. Lab A reported the only value outside acceptable ranges; this was a statistical outlier (0.111 mg/l). The %F-pseudosigma value was very low (less than 10%), indicating a high degree of precision among laboratories. Of the 27 reported values, 74% were within 1 F- pseudosigma and 96% were within 2 F-pseudosigma. There was no statistically significant difference between use of methods EPA 365.1, SM 4500 P E and SM 4500 P F, whereas results from USGS I were significantly greater than those using the three previous methods; results obtained from Lachat I were significantly higher than all other methods. At Alligator Harbor, six of the 27 results were reported values; the other 78% were reported as qualifiers. The MDLs ranged from to mg/l; and the PQLs for Labs A and G ranged from to 0.04 mg/l. There were no values reported as less than detection/quantitation limits that were determined to be false negatives. Methods EPA and USGS I were the only methods to report values. No other analyses were conducted for OP for Alligator Harbor. See Figures 13 & 14 and Tables for scatter-plots of values obtained by individual laboratories, F-pseudosigma values, summary statistics, inter-laboratory comparisons, and method comparisons. OP FSU CML F-pseudosigma % F-pseudosigma Median Range % Method N Mean Median Range EPA Lachat I SM 4500 P E SM 4500 P F USGS I Alligator Harbor F-pseudosigma % F-pseudosigma Median Range % Method N Mean Median Range EPA (nine non-values) Lachat I 3 All Non-detect N/A N/A SM 4500 P E 3 All Non-detect N/A N/A SM 4500 P F 6 All Non-detect N/A N/A USGS I Table 39. F-pseudosigma values for OP. OP FSU CML Alligator Harbor Lab ID N Lab Median Range Mean Z-value N Lab Median Range Mean Z-value A * NR NR NR B * NR NR NR C N/A E N/A F * NR NR NR G * NR NR NR H * NR NR NR I * NR NR NR J * NR NR NR * One or more non-values reported. NR = all non-values reported. Table 40. Summary statistics and Z-values by Laboratory for OP. 31
34 OP Method MDL Range PQL Range All EPA Lachat I SM 4500 P E SM 4500 P F USGS I Not Reported Table 41. Methods and detection/quantitation limits for OP. Descriptives Orthophosphate mg/l N Mean Std. Deviation Std. Error 95% Confidence Interval for Mean Minimum Maximum Lower Bound Upper Bound A B C E F G H I J Total Table 42. Descriptive statistics by laboratory for OP for FSU CML. Descriptives Orthophosphate mg/l N Mean Std. Deviation Std. Error 95% Confidence Interval for Mean Minimum Maximum Lower Bound Upper Bound C E Total Table 43. Descriptive statistics by laboratory for OP for Alligator Harbor. 32
35 Figure 13. Scatter-plot of OP values obtained by nine laboratories for FSU CML. The solid line indicates the overall median, and the dashed lines indicate +/- 1 F-pseudosigma. Figure 14. Scatter-plot of OP values and detection/quantitation limits obtained by nine laboratories for Alligator Harbor. 33
36 1 Hypothesis Test Summary Null Hypothesis Test Sig. Decision The distribution of Orthophosphate mg/l is the same across categories of Lab_ID. Independent-Samples Kruskal-Wallis Test Asymptotic significances are displayed. The significance level is.05. Sample Homogeneous Subsets based on Orthophosphate mg/l H I E G F B Subset Reject the null hypothesis J C A Test Statistic Sig. (2-sided test) Adjusted Sig. (2-sided test) Homogeneous subsets are based on asymptotic significances. The significance level is Each cell shows the sample average rank of Orthophosphate mg/l. 2 Unable to compute because the subset contains only one sample. Table 44. Kruskal-Wallis test and results of nonparametric pair-wise comparisons of OP for FSU CML. 34
37 1 2 Hypothesis Test Summary Null Hypothesis Test Sig. Decision The medians of Orthophosphate mg/l are the same across categories of OP_ID. The distribution of Orthophosphate mg/l is the same across categories of OP_ID. Independent- Samples Median Test Independent- Samples Kruskal-Wallis Test Asymptotic significances are displayed. The significance level is.05. Sample 1 Homogeneous Subsets based on Orthophosphate mg/l SM 4500 P E EPA SM 4500 P F Subset USGS I Lachat I Test Statistic Sig. (2-sided test) Adjusted Sig. (2-sided test) Homogeneous subsets are based on asymptotic significances. The significance level is Each cell shows the sample average rank of Orthophosphate mg/l. 2 Unable to compute because the subset contains only one sample. Reject the null hypothesis. Reject the null hypothesis. Table 45. Kruskal-Wallis test and results of nonparametric pair-wise comparisons of OP by method for FSU CML. 35
38 G. Total Organic Carbon. Although there were only eighteen reported values for TOC at both locations (vs. the 21 needed) analyses were run; however, caution should be exercised in interpreting the results due to the lack of statistical power. Fifteen of the eighteen reported values for FSU CML were within acceptable ranges. Lab A reported all three values outside acceptable ranges. No results were reported as below detection limits. The %F-pseudosigma value was moderate (>20% and <30%), indicating a lack of precision among laboratories. Of the eighteen reported values, 78% were within 1 F-pseudosigma and 83% were within 2 F- pseudosigma. There was no statistical difference between the three methods used. At Alligator Harbor, fourteen of the eighteen values were within acceptable ranges. Lab A reported all values outside acceptable ranges, Lab G reported one. The %F-pseudosigma value was very low (less than 10%), indicating a high degree of precision among the laboratories. Of the eighteen reported values, 50% were within 1 F-pseudosigma and 78% were within 2 F- pseudosigma. There was no statistical difference between the three methods used. At both sites, Lab A reported values that were times greater than all the other laboratories results, and may be due to a faulty SO 3 scrubber. See Figures 14 & 17 and Tables for scatter-plots of values obtained by individual laboratories, F-pseudosigma values, summary statistics, inter-laboratory comparisons, and method comparisons. TOC FSU CML F-pseudosigma % F-pseudosigma Median Range % Method N Mean Median Range EPA SM 5310 B SM 5310 C Alligator Harbor F-pseudosigma % F-pseudosigma Median Range % Method N Mean Median Range EPA SM 5310 B SM 5310 C Table 46. F-pseudosigma values for TOC. TOC FSU CML Alligator Harbor Lab ID N Lab Median Range Mean Z-value N Lab Median Range Mean Z-value A B F G H J * One non-value reported. NR = All non-values reported. Table 47. Summary statistics and Z-values by Laboratory for TOC. 36
39 Descriptives Total Organic Carbon mg/l N Mean Std. Deviation Std. Error 95% Confidence Interval for Mean Minimum Maximum Lower Bound Upper Bound A B F G H J Total Table 48. Descriptive statistics by laboratory for TOC from FSU CML. Descriptives Total Organic Carbon mg/l N Mean Std. Deviation Std. Error 95% Confidence Interval for Mean Minimum Maximum Lower Bound Upper Bound A B F G H J Total Table 49. Descriptive statistics by laboratory for TOC from Alligator Harbor. 37

40 Figure 14. Scatter-plot of TOC values obtained by six laboratories for FSU CML. The solid line indicates the overall median, and the dashed lines indicate +/- 1 F-pseudosigma. Figure 15. Scatter-plot of TOC values obtained by six laboratories for Alligator Harbor. The solid line indicates the overall median, and the dashed lines indicate +/- 1 F-pseudosigma. 38
41 1 Hypothesis Test Summary Null Hypothesis Test Sig. Decision The distribution of Total Organic Carbon mg/l is the same across categories of Lab_ID. Independent-Samples Kruskal-Wallis Test.006 Asymptotic significances are displayed. The significance level is.05. Sample 1 Homogeneous Subsets based on Total Organic Carbon mg/l G H F J Subset Reject the null hypothesis B A Test Statistic Sig. (2-sided test) Adjusted Sig. (2-sided test) Homogeneous subsets are based on asymptotic significances. The significance level is Each cell shows the sample average rank of Total Organic Carbon mg/l. 2 Unable to compute because the subset contains only one sample. Table 50. Kruskal-Wallis test and results of nonparametric pair-wise comparisons of TOC by laboratory for all reported values for FSU CML. Total Organic Carbon mg/l Lab_ID N Subset for alpha = G H F Gabriel a J B A Sig Means for groups in homogeneous subsets are displayed. a. Uses Harmonic Mean Sample Size = Table 51. Post hoc inter-laboratory comparisons for TOC from Alligator Harbor. 39
42 Figure 16. Results of Kruskal-Wallis test of TOC by method for FSU CML. Figure 17. Results of Kruskal-Wallis test of TOC by method for Alligator Harbor. 40
43 H. Chlorophyll a. Twenty-five of the 27 reported values for FSU CML were within acceptable ranges. Labs E and I each reported one value outside acceptable ranges. Lab I reported one statistical outlier (12 µg/l). Lab I s results were also highly variable. The %F-pseudosigma value was large (greater than 30%), indicating a lack of precision among laboratories. Of the 27 reported values, 81% were within 1 F-pseudosigma and 93% were within 2 F-pseudosigma. There was no statistical difference in ChlA methods at this site. At Alligator Harbor, all 27 values were within acceptable ranges. There were no outliers or non-values reported. The %F-pseudosigma value was moderate (between 20 and 30%), indicating a lack of precision among the laboratories. Of the 27 reported values, 78% were within 1 F-pseudosigma and 100% were within 2 F-pseudosigma. Results reported for method SM H were significantly greater than those reported for EPA See Figures and Tables for scatter-plots of values obtained by individual laboratories, F- pseudosigma values, summary statistics, inter-laboratory comparisons, and method comparisons. Chlorophyll a FSU CML F-pseudosigma % F-pseudosigma Median Range % Method N Mean Median Range EPA SM H Alligator Harbor F-pseudosigma % F-pseudosigma Median Range % Method N Mean Median Range EPA SM H Table 52. F-pseudosigma values for ChlA. ChlA FSU CML Alligator Harbor Lab ID N Lab Median Range Mean Z-value N Lab Median Range Mean Z-value A B D E F G H I J Table 53. Summary statistics by Laboratory for ChlA. 41
44 Descriptives Chlorophyll a µg/l N Mean Std. Deviation Std. Error 95% Confidence Interval for Mean Minimum Maximum Lower Bound Upper Bound A B D E F G H I J Total Table 54. Descriptive statistics by laboratory for ChlA for FSU CML. Descriptives Chlorophyll a µg/l N Mean Std. Deviation Std. Error 95% Confidence Interval for Mean Minimum Maximum Lower Bound Upper Bound A B D E F G H I J Total Table 55. Descriptive statistics by laboratory for ChlA for Alligator Harbor. 42
45 Figure 18. Scatter-plot of ChlA values obtained by nine laboratories for FSU CML. The solid line indicates the overall median, and the dashed lines indicate +/- 1 F-pseudosigma. Figure 19. Scatter-plot of ChlA values obtained by nine laboratories for Alligator Harbor. The solid line indicates the overall median, and the dashed lines indicate +/- 1 F-pseudosigma. 43
46 1 Hypothesis Test Summary Null Hypothesis Test Sig. Decision The distribution of Chlorophyll a µg/l is the same across categories of Lab_ID. Independent-Samples Kruskal-Wallis Test Asymptotic significances are displayed. The significance level is.05. Sample Homogeneous Subsets based on Chlorophyll a µg/l J E F H Subset Reject the null hypothesis D A B G I Test Statistic Sig. (2-sided test) Adjusted Sig. (2-sided test) Homogeneous subsets are based on asymptotic significances. The significance level is Each cell shows the sample average rank of Chlorophyll a µg/l. Table 56. Kruskal-Wallis test and results of nonparametric inter-laboratory comparisons of ChlA from FSU CML. 44
47 1 Hypothesis Test Summary Null Hypothesis Test Sig. Decision The distribution of Chlorophyll a µg/l is the same across categories of Lab_ID. Independent-Samples Kruskal-Wallis Test Asymptotic significances are displayed. The significance level is.05. Sample Homogeneous Subsets based on Chlorophyll a µg/l A G H Subset D I J F E B Test Statistic Sig. (2-sided test) Adjusted Sig. (2-sided test) Homogeneous subsets are based on asymptotic significances. The significance level is Each cell shows the sample average rank of Chlorophyll a µg/l. Reject the null hypothesis. Table 57. Kruskal-Wallis test and results of nonparametric inter-laboratory comparisons of ChlA for Alligator Harbor. 45
48 Figure 20. Results of Mann-Whitney test of ChlA by method for FSU CML. Group Statistics Method ID N Mean Std. Deviation Std. Error Mean Chlorophyll a µg/l SM H EPA Independent Samples Test Levene's Test for Equality of Variances t-test for Equality of Means Sig. (2- Mean Std. Error 95% Confidence Interval of the Difference F Sig. t df tailed) Difference Difference Lower Upper Chlorophyll a µg/l Equal variances assumed Equal variances not assumed Table 58. Results of t-test comparisons of ChlA by method for Alligator Harbor. 46
49 I. Biochemical Oxygen Demand. Ten of the eighteen results for FSU CML were reported as values; the other 44% were reported as qualifiers. The MDLs for all participating laboratories ranged from 0.1 to 2 mg/l; the PQLs for Labs A, E and G ranged from 2 to 3 mg/l. No other analyses were conducted for BOD for FSU CML. At Alligator Harbor, Fifteen of the eighteen results were reported values; the other 17% were reported as qualifiers. The MDLs for all participating laboratories ranged from 0.1 to 2 mg/l; the PQLs for Labs A, E and G ranged from 2 to 3 mg/l. There were no values reported as less than detection/quantitation limits that were determined to be false negatives for either site. No other analyses were conducted for BOD for Alligator Harbor. See Figures and Tables for scatter-plots of values obtained by individual laboratories, F-pseudosigma values, summary statistics, inter-laboratory comparisons, and method comparisons. Biochemical Oxygen Demand F-pseudosigma % F-pseudosigma Mean Median Range FSU CML % Alligator Harbor % Table 59. F-pseudosigma values for BOD. BOD FSU CML Alligator Harbor Lab ID N Lab Median Range Mean Z-value N Lab Median Range Mean Z-value A 3 NR NR NR N/A B N/A N/A E 3* 2.10 N/A N/A N/A G 3 NR NR NR 3 NR NR NR I N/A N/A J N/A N/A * One non-value reported. NR = All non-values reported. Table 60. Summary statistics and Z-values by Laboratory for BOD. BOD Method MDL Range PQL Range SM 5210 B Table 61. Method and detection/quantitation limits for BOD. Descriptives Biochemical Oxygen Demand mg/l N Mean Std. Deviation Std. Error 95% Confidence Interval for Mean Minimum Maximum Lower Bound Upper Bound B E N/A N/A N/A N/A I J Total Table 62. Descriptive statistics by laboratory for BOD for FSU CML. Descriptives 47
50 Biochemical Oxygen Demand mg/l N Mean Std. Deviation Std. Error 95% Confidence Interval for Mean Minimum Maximum Lower Bound Upper Bound A B E I J Total Table 63. Descriptive statistics by laboratory for BOD for Alligator Harbor. Figure 21. Scatter-plot of BOD values and detection/quantitation limits obtained by six laboratories for FSU CML. The solid line indicates the overall median, and the dashed lines indicate +/- 1 F-pseudosigma. 48

51 Figure 22. Scatter-plot of BOD values and detection/quantitation limits obtained by six laboratories for Alligator Harbor. The solid line indicates the overall median, and the dashed lines indicate +/- 1 F-pseudosigma. Figure 23. Results of Kruskal-Wallis test of BOD by laboratory for FSU CML. 49
52 J. Carbonaceous Biochemical Oxygen Demand. Seven of the eighteen results for FSU CML were reported as values; the other 61% were reported as qualifiers. The MDLs for all participating laboratories ranged from 0.2 to 2 mg/l; the PQLs for Labs A, E and G ranged from 2 to 3 mg/l. No other analyses were conducted for CBOD for FSU CML. At Alligator Harbor, eleven of the eighteen results were reported values; the other 39% were reported as qualifiers. The MDLs for all participating laboratories ranged from 0.2 to 2 mg/l; the PQLs for Labs A, E and G ranged from 2 to 3 mg/l. There were no values reported as less than detection/quantitation limits that were determined to be false negatives from either location. No other analyses were conducted for CBOD for Alligator Harbor. See Figures and Tables for scatter-plots of values obtained by individual laboratories, F- pseudosigma values, summary statistics, inter-laboratory comparisons, and method comparisons. Carbonaceous Biochemical Oxygen Demand FSU CML F-pseudosigma % F-pseudosigma Median Range % Method N Mean Median Range SM 5210 B SM 5210 C 3 All Non-detect N/A N/A Alligator Harbor F-pseudosigma % F-pseudosigma Median Range % Method N Mean Median Range SM 5210 B SM 5210 C 3 All Non-detect N/A N/A Table 64. F-pseudosigma values for CBOD. CBOD FSU CML Alligator Harbor Lab ID N Lab Median Range Mean Z-value N Lab Median Range Mean Z-value A 3 NR NR NR 3 NR NR NR B N/A N/A E 3* 2.20 N/A N/A N/A G 3 NR NR NR 3 NR NR NR I 3 NR NR NR N/A J N/A N/A * One non-value reported. NR = All non-values reported. Table 65. Summary statistics and Z-values by Laboratory for CBOD. CBOD Method MDL Range PQL Range SM 5210 B SM 5210 C 2 2 Table 66. Methods and detection/quantitation limits for CBOD. 50
53 Descriptives Carbonaceous Biochemical Oxygen Demand mg/l N Mean Std. Deviation Std. Error 95% Confidence Interval for Mean Minimum Maximum Lower Bound Upper Bound B E N/A N/A N/A N/A J Total Table 67. Descriptive statistics by laboratory for CBOD from FSU CML. Descriptives Carbonaceous Biochemical Oxygen Demand mg/l N Mean Std. Deviation Std. Error 95% Confidence Interval for Mean Minimum Maximum Lower Bound Upper Bound B E I J Total Table 68. Descriptive statistics by laboratory for CBOD from Alligator Harbor. Figure 24. Scatter-plot of CBOD values and detection/quantitation limits obtained by six laboratories for FSU CML. The solid line indicates the overall median, and the dashed lines indicate +/- 1 F-pseudosigma. 51
54 Figure 25. Scatter-plot of CBOD values and detection/quantitation limits obtained by six laboratories for Alligator Harbor. 52
55 4. Conclusions and Recommendations Total Kjeldahl Nitrogen: There was little variability among laboratories for total Kjeldahl nitrogen from the unspiked aliquot, but was quite variable in the spiked aliquot. However, values from Lab E were highly variable from both sites, and values from Lab I were typically higher than all other laboratories values. Detection and quantitation limits were not an issue for this analyte. The three methods used were statistically the same for the Alligator Harbor site; however, results for Lachat D were significantly lower at the FSU CML site. Ammonia: Ammonia was extremely variable at lower concentrations. At higher concentrations, the variability among results was reduced but remained quite variable. Results reported from Lab I were very high for both locations and may be due to the method of digestion. Detection and quantitation limits need to be addressed, as more than one-half of the results from Alligator Harbor (the unspiked site) were non-values. Results from the FSU CML aliquot showed method Lachat J to be significantly lower than methods EPA and SM 4500 NH3 G (the two of which were statistically the same). Analyses of methods were not run for Alligator Harbor due to the large number of non-values reported; however, EPA was the only method to report values. Total Nitrite + Nitrate: There was little variability among most results for NO x for FSU CML. Lab G reported two statistical outliers for FSU CML; results for Lab G at this site were highly variable. Results reported by Lab A from Alligator Harbor were approximately an order of magnitude higher than the other laboratories values, and may represent typographical errors. Detection and quantitation limits were issues for this analyte in the unspiked sample from Alligator Harbor, as more than half of the results were non-values. Dissolved Nitrite: There was very little variability in results for DNO 2 from the spiked aliquot. Labs G and I reported values outside acceptable ranges at this site. Method SM 4500 NO2 B was statistically lower than all other methods at FSU CML; EPA was equivalent to both Lachat C and USGS I At the low concentration site, the variability was very high, due mostly to the large number of non-values reported. Method EPA was the only method to report values. Detection and quantitation limits need to be addressed, as nearly 80% of the results from Alligator Harbor were non-values. Total Phosphorus: Results from the FSU CML site were all within acceptable ranges for TP. In addition, there were no outliers or non-values reported. Results obtained using Method EPA were significantly higher than those obtained using the other methods at this site. Results from the Alligator Harbor site were more variable than those of the FSU CML site. Labs B and I reported values outside acceptable ranges, and Lab G reported a non-detect. At Alligator Harbor, results from method EPA were statistically lower than those obtained from the other two methods. Other than the one non-detect, detection and quantitation limits were not an issue for this analyte during this round robin. Orthophosphate: With the exception of one outlier reported by Lab A, results from the FSU CML site varied little. Results from three of the five methods employed at this site were statistically equivalent (EPA 365.1, SM 4500 P E and SM 4500 P F), whereas those from USGS I were significantly greater than the prior three methods; results obtained using Lachat I were significantly higher than all other methods. At Alligator Harbor, nearly 80% of the results were reported as non-values. Methods EPA and USGS I were the only methods to report values from this site. Detection and quantitation limits need to be addressed for OP. 53
56 Total Organic Carbon: There was little variability among laboratories, or within laboratories, for TOC; however, Lab A reported all values outside of acceptable ranges and on the high end for both sites; this may be due to an improperly functioning SO 3 scrubber. No values were reported as below detection or quantitation limits for either site. Chlorophyll a: Variability among laboratories was moderate for chlorophyll a for both sites. This is most likely due to the fact that results were reported as chlorophyll a and not either chlorophyll a, corrected for phaeophytin or chlorophyll a, uncorrected for phaeophytin. This is evidenced by the fact that scatter-plots from both sites appear to be centered around two values (one high and one low) at each site. Lab E was highly variable at both sites. Lab I reported the only outlier from both sites. At FSU CML, there was no statistical difference in ChlA methods; however, at Alligator Harbor, results from method SM H were significantly greater than those reported for EPA Biochemical Oxygen Demand and Carbonaceous Biochemical Oxygen Demand: Very few values were reported for BOD and CBOD. In addition, few laboratories participated in analyzing the particular analyte. Therefore, detection and quantitation limits need to be addressed, as well as laboratory participation. Overall: Although the data were quite similar among most laboratories, modifying or standardizing the practices of participating labs could further minimize variability. For example, variability in results could be reduced by laboratories adopting the following practices: improve the accuracy in calculating and reporting their detection and quantitation limits; revise methods to better quantify their techniques to reduce the amount of variability within the methods employed; minimize gross errors due to unit conversions, calculation errors, dilution errors, transcription errors (and other typographical errors), etc. through automation, improved quality control and quality assurance plans; report the results for a round robin as the output of the analyses, not as a reporting limit for a database (e.g., report the values out to 2 to 3 decimal places rather than rounding to whole numbers). The greatest challenge to the round robin project and to achieving data comparability in the Gulf is addressing the high number of nutrient, ChlA, BOD, and CBOD results reported as below detection and quantitation limits. In order to adequately monitor water quality in and around the Gulf of Mexico, the detection problem must be resolved. As technology advances, allowing equipment to gain greater accuracy and precision, the detection limits should come down; in addition, calculations for quantitation limits need to better quantify noise. We recommend that laboratories that have the capabilities to detect and quantify nutrients within these waters coordinate with laboratories that do not have this ability in order to help them achieve detectable and quantifiable results. It is recommended that future round robins include a greater number of laboratories that conduct analyses around the Gulf and increase the number of analytes of interest in order to better assess comparability around the Gulf and increase the power of statistical analyses. Finally, we recommend that GOMA and its partners obtain funding to facilitate laboratory education and information exchange to address the challenges listed above. 54
57 5. References Helsel, D.R Statistics for Censored Environmental Data Using Minitab and R. 2 nd Edition. John Wiley, Inc. New York, NY. Hoaglin, D.C, F. Mosteller, and J.W. Tukey Eds Understanding Robust and Exploratory Data Analysis. John Wiley, Inc. New York, NY. Quality Assurance of Information in Marine Environmental Monitoring (QUASIMEME) QUASIMEME Laboratory Performance Studies. WEPAL. Netherlands. Woodworth, M.T and B.F. Connor Results of the U.S. Geological Survey s Analytical Evaluation Program for Standard Reference Samples Distributed in March U.S. Geological Survey, U.S. Department of Interior. OFR Lakewood, CO. 55
58 GOMA Analytical Round Robin #5 Results - October 20, 2010 Samples collected from the Florida State University Coastal and Marine Laboratory, Florida Where an actual number was given for results listed below the MDL or PQL, the reported number is given. However, when the result was simply listed as less than the MDL or PQL, a U qualifier is listed for below MDL and an I qualifier is listed for below PQL. Only the laboratories that ran analyses for a particular analyte are listed with that analyte. Calculations include all reported values. * = Less than PQL Total Kjeldahl Nitrogen mg/l A B C D E F G H I J Average: Std. Dev Ammonia mg/l A B C D E F G H I J Average: Std. Dev Total Nitrite + Nitrate mg/l A B C D E F G H I J Average: Std. Dev Dissolved Nitrite mg/l A B C D E F G H I J Average: Std. Dev Total Phosphorus mg/l A B C D E F G H I J Average: Std. Dev
59 Orthophosphate mg/l A B C* D E F G H I J Average: Std. Dev Total Organic Carbon mg/l A B C D E F G H I J* Average: Std. Dev Notes Lab A's high values may be due to positive interference due to SO3 detection caused by H2SO4 preservation. May require an SO3 scrubber. Chlorophyll a µg/l A B* C D E F G H I J* Average: Std. Dev Biochemical Oxygen Demand mg/l A B C D E F G H I J I U U I U U I U Average: Std. Dev Carbonaceous Biochemical Oxygen Demand mg/l A B C D E F G H I J* I U U U I U U U I U U Average: Std. Dev
60 GOMA Analytical Round Robin #5 Results - October 20, 2010 Samples collected from Alligator Harbor, Florida Total Kjeldahl Nitrogen mg/l A B C D E F G H I J Average: Std. Dev Ammonia mg/l A B C D E F G H I J I I U I U I I U I U I I U I U Average: Std. Dev Total Nitrite + Nitrate mg/l A B C D E* F G H I* J U U U I U U U U I U U U U U I U U Average: Std. Dev Dissolved Nitrite mg/l A B C D E* F G H* I J I U U U I U U I U U U I U U I U U U I U U Average: Std. Dev Total Phosphorus mg/l A B C D E F G H I J I Average: Std. Dev
61 Orthophosphate mg/l A B C D E* F G H I J I U U I U U U I U U I U U U I U U I U U U Average: Std. Dev Total Organic Carbon mg/l A B C D E F G H I J Average: Std. Dev Notes Lab A's high values may be due to positive interference due to SO3 detection caused by H2SO4 preservation. May require an SO3 scrubber. Chlorophyll a µg/l A B C* D E F G H I J Average: Std. Dev Biochemical Oxygen Demand mg/l A B C D E F G H I J U U U Average: Std. Dev Carbonaceous Biochemical Oxygen Demand mg/l A B C D E F G H I J I U I U U I U Average: Std. Dev
62 FSU CML TKN NH3 NOx D_NO2 TP OP TOC ChlA BOD CBOD Stat. Std. Err. Stat. Std. Err. Stat. Std. Err. Stat. Std. Err. Stat. Std. Err. Stat. Std. Err. Stat. Std. Err. Stat. Std. Err. Stat. Std. Err. Stat. Std. Err. Descriptives N (Total) N (Greater than PQL) N Analyzed Mean % CI (LB) % CI (UB) % Trimmed Median Variance Std. Dev Min Max Range IQR Skew Kurtosis Huber's ψ Kaplan-Meier (KM) Method Minimum Non-Detect N/A N/A N/A N/A N/A N/A N/A N/A Maximum Non-Detect N/A N/A N/A N/A N/A N/A N/A N/A Mean N/A N/A N/A N/A N/A N/A N/A N/A N/A N/A N/A N/A N/A N/A N/A N/A SD N/A N/A N/A N/A N/A N/A N/A N/A % KM UCL Normality Test of Skew N/A Test of Kurtosis Jarque & Bera N/A Outliers F Crit. (Mahalanobis D2) Mahalanobis D2 Max Std. Dev Std. Dev # Outside 2 Std. Dev F-Pseudosigma F-Pseudosigma # Outside 2 F-Pseudosigma # from Boxplots Homoscedasticity (between laboratories) Levene's Detection Limits < MDL % < MDL 0% 0% 0% 0% 0% 0% 0% 0% 28% 44% < PQL % < PQL 0% 0% 0% 0% 0% 0% 17% 15% 44% 72% Precision %F-Pseudosigma 20.42% 21.31% 37.87% 6.01% 19.77% 8.24% 27.85% 36.79% 5.56% 33.36% %RSD 28.16% 60.37% 45.80% 5.82% 15.98% 7.76% 41.33% 34.75% 21.12% 24.85% Bold values are significant p-values at the 0.05 level. 60
63 Alligator Harbor TKN NH3 NOx D_NO2 TP OP TOC ChlA BOD CBOD Stat. Std. Err. Stat. Std. Err. Stat. Std. Err. Stat. Std. Err. Stat. Std. Err. Stat. Std. Err. Stat. Std. Err. Stat. Std. Err. Stat. Std. Err. Stat. Std. Err. Descriptives N (Total) N (Greater than PQL) N Analyzed Mean % CI (LB) % CI (UB) % Trimmed Median Variance Std. Dev Min Max Range IQR Skew Kurtosis Huber's ψ Kaplan-Meier (KM) Method Minimum Non-Detect N/A N/A N/A Maximum Non-Detect N/A N/A N/A Mean N/A N/A N/A N/A N/A N/A SD N/A N/A N/A % KM UCL Normality Test of Skew N/A N/A N/A Test of Kurtosis Jarque & Bera N/A N/A N/A Outliers F Crit. (Mahalanobis D2) Mahalanobis D2 Max Std. Dev Std. Dev # Outside 2 Std. Dev F-Pseudosigma F-Pseudosigma # Outside 2 F-Pseudosigma # from Boxplots Homoscedasticity (between laboratories) Levene's Detection Limits < MDL % < MDL 0% 22% 58% 63% 0% 56% 0% 0% 17% 22% < PQL % < PQL 0% 56% 88% 100% 4% 89% 17% 0% 17% 39% Precision %F-Pseudosigma 15.36% % % 87.86% 54.33% 28.54% 19.34% 28.30% 28.34% 24.71% %RSD 24.10% 93.55% % % 40.93% 16.67% 39.24% 24.20% 21.53% 17.95% Bold values are significant p-values at the 0.05 level. 61
64 62
65 63
66 64

67 65
68 66
69 67
70 68
71 69
72 70
73 71
INTERPRETING THE ONE-WAY ANALYSIS OF VARIANCE (ANOVA)
") INTERPRETING THE ONE-WAY ANALYSIS OF VARIANCE (ANOVA) As with other parametric statistics, we begin the one-way ANOVA with a test of the underlying assumptions. Our first assumption is the assumption of
INTERPRETING THE ONE-WAY ANALYSIS OF VARIANCE (ANOVA) As with other parametric statistics, we begin the one-way ANOVA with a test of the underlying assumptions. Our first assumption is the assumption of
13: Additional ANOVA Topics. Post hoc Comparisons
 13: Additional ANOVA Topics Post hoc Comparisons ANOVA Assumptions Assessing Group Variances When Distributional Assumptions are Severely Violated Kruskal-Wallis Test Post hoc Comparisons In the prior
SPSS Tests for Versions 9 to 13
 SPSS Tests for Versions 9 to 13 Chapter 2 Descriptive Statistic (including median) Choose Analyze Descriptive statistics Frequencies... Click on variable(s) then press to move to into Variable(s): list
Independent t- Test (Comparing Two Means)
") Independent t- Test (Comparing Two Means) The objectives of this lesson are to learn: the definition/purpose of independent t-test when to use the independent t-test the use of SPSS to complete an independent
Independent t- Test (Comparing Two Means) The objectives of this lesson are to learn: the definition/purpose of independent t-test when to use the independent t-test the use of SPSS to complete an independent
THE KRUSKAL WALLLIS TEST
 THE KRUSKAL WALLLIS TEST TEODORA H. MEHOTCHEVA Wednesday, 23 rd April 08 THE KRUSKAL-WALLIS TEST: The non-parametric alternative to ANOVA: testing for difference between several independent groups 2 NON
Comparing Means in Two Populations
 Comparing Means in Two Populations Overview The previous section discussed hypothesis testing when sampling from a single population (either a single mean or two means from the same population). Now we
Chapter 5 Analysis of variance SPSS Analysis of variance
 Chapter 5 Analysis of variance SPSS Analysis of variance Data file used: gss.sav How to get there: Analyze Compare Means One-way ANOVA To test the null hypothesis that several population means are equal,
1 Quality Assurance and Quality Control Project Plan
 1 Quality Assurance and Quality Control Project Plan The purpose of this section is to describe the quality assurance/quality control program that will be used during the system specific field testing
Research Methods & Experimental Design
 Research Methods & Experimental Design 16.422 Human Supervisory Control April 2004 Research Methods Qualitative vs. quantitative Understanding the relationship between objectives (research question) and
ANOVA ANOVA. Two-Way ANOVA. One-Way ANOVA. When to use ANOVA ANOVA. Analysis of Variance. Chapter 16. A procedure for comparing more than two groups
 ANOVA ANOVA Analysis of Variance Chapter 6 A procedure for comparing more than two groups independent variable: smoking status non-smoking one pack a day > two packs a day dependent variable: number of
2 Sample t-test (unequal sample sizes and unequal variances)
") Variations of the t-test: Sample tail Sample t-test (unequal sample sizes and unequal variances) Like the last example, below we have ceramic sherd thickness measurements (in cm) of two samples representing
Variations of the t-test: Sample tail Sample t-test (unequal sample sizes and unequal variances) Like the last example, below we have ceramic sherd thickness measurements (in cm) of two samples representing
Introduction to Analysis of Variance (ANOVA) Limitations of the t-test
 Limitations of the t-test") Introduction to Analysis of Variance (ANOVA) The Structural Model, The Summary Table, and the One- Way ANOVA Limitations of the t-test Although the t-test is commonly used, it has limitations Can only
Introduction to Analysis of Variance (ANOVA) The Structural Model, The Summary Table, and the One- Way ANOVA Limitations of the t-test Although the t-test is commonly used, it has limitations Can only
One-Way ANOVA using SPSS 11.0. SPSS ANOVA procedures found in the Compare Means analyses. Specifically, we demonstrate
 1 One-Way ANOVA using SPSS 11.0 This section covers steps for testing the difference between three or more group means using the SPSS ANOVA procedures found in the Compare Means analyses. Specifically,
Texas Commission on Environmental Quality
 Matrix: Drinking Water Method EPA 1603 (modified mtec) AB ID Method ID Escherichia coli (enumeration) TX 2525 10236201 Method EPA 200.5 AB ID Method ID Arsenic TX 1010 10213975 Beryllium TX 1020 10213975
Analysis of Data. Organizing Data Files in SPSS. Descriptive Statistics
 Analysis of Data Claudia J. Stanny PSY 67 Research Design Organizing Data Files in SPSS All data for one subject entered on the same line Identification data Between-subjects manipulations: variable to
Analysis of Variance ANOVA
 Analysis of Variance ANOVA Overview We ve used the t -test to compare the means from two independent groups. Now we ve come to the final topic of the course: how to compare means from more than two populations.
Rank-Based Non-Parametric Tests
 Rank-Based Non-Parametric Tests Reminder: Student Instructional Rating Surveys You have until May 8 th to fill out the student instructional rating surveys at https://sakai.rutgers.edu/portal/site/sirs
Section 13, Part 1 ANOVA. Analysis Of Variance
 Section 13, Part 1 ANOVA Analysis Of Variance Course Overview So far in this course we ve covered: Descriptive statistics Summary statistics Tables and Graphs Probability Probability Rules Probability
1 Nonparametric Statistics
 1 Nonparametric Statistics When finding confidence intervals or conducting tests so far, we always described the population with a model, which includes a set of parameters. Then we could make decisions
Appendix D lists the Field Services Standard Operating Procedures. Appendix E lists the Biological Monitoring Standard Operating Procedures.
 Page 16 of 87 3.3 Sample Collection, Storage and Preservation Figure 3 details required containers, sample volumes, preservation techniques, and holding times for proper sample collection. A discussion
Descriptive Statistics
 Descriptive Statistics Primer Descriptive statistics Central tendency Variation Relative position Relationships Calculating descriptive statistics Descriptive Statistics Purpose to describe or summarize
SCHOOL OF HEALTH AND HUMAN SCIENCES DON T FORGET TO RECODE YOUR MISSING VALUES
 SCHOOL OF HEALTH AND HUMAN SCIENCES Using SPSS Topics addressed today: 1. Differences between groups 2. Graphing Use the s4data.sav file for the first part of this session. DON T FORGET TO RECODE YOUR
NCSS Statistical Software
 Chapter 06 Introduction This procedure provides several reports for the comparison of two distributions, including confidence intervals for the difference in means, two-sample t-tests, the z-test, the
HYPOTHESIS TESTING WITH SPSS:
 HYPOTHESIS TESTING WITH SPSS: A NON-STATISTICIAN S GUIDE & TUTORIAL by Dr. Jim Mirabella SPSS 14.0 screenshots reprinted with permission from SPSS Inc. Published June 2006 Copyright Dr. Jim Mirabella CHAPTER
Simple linear regression
 Simple linear regression Introduction Simple linear regression is a statistical method for obtaining a formula to predict values of one variable from another where there is a causal relationship between
SPSS Explore procedure
 SPSS Explore procedure One useful function in SPSS is the Explore procedure, which will produce histograms, boxplots, stem-and-leaf plots and extensive descriptive statistics. To run the Explore procedure,
Two-Sample T-Tests Assuming Equal Variance (Enter Means)
") Chapter 4 Two-Sample T-Tests Assuming Equal Variance (Enter Means) Introduction This procedure provides sample size and power calculations for one- or two-sided two-sample t-tests when the variances of
Chapter 4 Two-Sample T-Tests Assuming Equal Variance (Enter Means) Introduction This procedure provides sample size and power calculations for one- or two-sided two-sample t-tests when the variances of
ABSORBENCY OF PAPER TOWELS
 ABSORBENCY OF PAPER TOWELS 15. Brief Version of the Case Study 15.1 Problem Formulation 15.2 Selection of Factors 15.3 Obtaining Random Samples of Paper Towels 15.4 How will the Absorbency be measured?
Introduction. The following definitions may help you better understand the components of the data report.
 Introduction This document is designed to help our clients understand the quality control requirements and limitations of data reporting. There are three sections to this document. The first section will
Statistics Review PSY379
 Statistics Review PSY379 Basic concepts Measurement scales Populations vs. samples Continuous vs. discrete variable Independent vs. dependent variable Descriptive vs. inferential stats Common analyses
The Dummy s Guide to Data Analysis Using SPSS
 The Dummy s Guide to Data Analysis Using SPSS Mathematics 57 Scripps College Amy Gamble April, 2001 Amy Gamble 4/30/01 All Rights Rerserved TABLE OF CONTENTS PAGE Helpful Hints for All Tests...1 Tests
How Far is too Far? Statistical Outlier Detection
 How Far is too Far? Statistical Outlier Detection Steven Walfish President, Statistical Outsourcing Services [email protected] 30-325-329 Outline What is an Outlier, and Why are
1.5 Oneway Analysis of Variance
 Statistics: Rosie Cornish. 200. 1.5 Oneway Analysis of Variance 1 Introduction Oneway analysis of variance (ANOVA) is used to compare several means. This method is often used in scientific or medical experiments
Study Guide for the Final Exam
 Study Guide for the Final Exam When studying, remember that the computational portion of the exam will only involve new material (covered after the second midterm), that material from Exam 1 will make
Outline. Definitions Descriptive vs. Inferential Statistics The t-test - One-sample t-test
 The t-test Outline Definitions Descriptive vs. Inferential Statistics The t-test - One-sample t-test - Dependent (related) groups t-test - Independent (unrelated) groups t-test Comparing means Correlation
Two-Sample T-Tests Allowing Unequal Variance (Enter Difference)
") Chapter 45 Two-Sample T-Tests Allowing Unequal Variance (Enter Difference) Introduction This procedure provides sample size and power calculations for one- or two-sided two-sample t-tests when no assumption
Chapter 45 Two-Sample T-Tests Allowing Unequal Variance (Enter Difference) Introduction This procedure provides sample size and power calculations for one- or two-sided two-sample t-tests when no assumption
Chapter 2 Probability Topics SPSS T tests
 Chapter 2 Probability Topics SPSS T tests Data file used: gss.sav In the lecture about chapter 2, only the One-Sample T test has been explained. In this handout, we also give the SPSS methods to perform
Chapter 7. One-way ANOVA
 Chapter 7 One-way ANOVA One-way ANOVA examines equality of population means for a quantitative outcome and a single categorical explanatory variable with any number of levels. The t-test of Chapter 6 looks
LIMNOLOGY, WATER QUALITY
 LIMNOLOGY, WATER QUALITY PA RANI ET E R S, AN D c 0 IV D IT I 0 N S AND ECOREGIONS Water Quality Parameters Nutrients are important parameters because phosphorous and nitrogen are major nutrients required
Water and Wastewater. Sample Collection and Analysis
 Water and Wastewater Sample Collection and Analysis December 2011 Introduction Accurate testing of drinking water is crucial to maintaining the health and safety of Islanders who rely on this resource.
p ˆ (sample mean and sample
 Chapter 6: Confidence Intervals and Hypothesis Testing When analyzing data, we can t just accept the sample mean or sample proportion as the official mean or proportion. When we estimate the statistics
Final Exam Practice Problem Answers
 Final Exam Practice Problem Answers The following data set consists of data gathered from 77 popular breakfast cereals. The variables in the data set are as follows: Brand: The brand name of the cereal
UNDERSTANDING THE INDEPENDENT-SAMPLES t TEST
 UNDERSTANDING The independent-samples t test evaluates the difference between the means of two independent or unrelated groups. That is, we evaluate whether the means for two independent groups are significantly
Variables Control Charts
 MINITAB ASSISTANT WHITE PAPER This paper explains the research conducted by Minitab statisticians to develop the methods and data checks used in the Assistant in Minitab 17 Statistical Software. Variables
American Association for Laboratory Accreditation
 Page 1 of 12 The examples provided are intended to demonstrate ways to implement the A2LA policies for the estimation of measurement uncertainty for methods that use counting for determining the number
An analysis method for a quantitative outcome and two categorical explanatory variables.
 Chapter 11 Two-Way ANOVA An analysis method for a quantitative outcome and two categorical explanatory variables. If an experiment has a quantitative outcome and two categorical explanatory variables that
How To Check For Differences In The One Way Anova
 MINITAB ASSISTANT WHITE PAPER This paper explains the research conducted by Minitab statisticians to develop the methods and data checks used in the Assistant in Minitab 17 Statistical Software. One-Way
Testing Group Differences using T-tests, ANOVA, and Nonparametric Measures
 Testing Group Differences using T-tests, ANOVA, and Nonparametric Measures Jamie DeCoster Department of Psychology University of Alabama 348 Gordon Palmer Hall Box 870348 Tuscaloosa, AL 35487-0348 Phone:
Multivariate Analysis of Variance. The general purpose of multivariate analysis of variance (MANOVA) is to determine
 is to determine") 2 - Manova 4.3.05 25 Multivariate Analysis of Variance What Multivariate Analysis of Variance is The general purpose of multivariate analysis of variance (MANOVA) is to determine whether multiple levels
2 - Manova 4.3.05 25 Multivariate Analysis of Variance What Multivariate Analysis of Variance is The general purpose of multivariate analysis of variance (MANOVA) is to determine whether multiple levels
Analysis of Variance. MINITAB User s Guide 2 3-1
 3 Analysis of Variance Analysis of Variance Overview, 3-2 One-Way Analysis of Variance, 3-5 Two-Way Analysis of Variance, 3-11 Analysis of Means, 3-13 Overview of Balanced ANOVA and GLM, 3-18 Balanced
Phosphorus, Reactive (Orthophosphate)
") Phosphorus, Reactive (Orthophosphate) DOC316.53.01113 Amino Acid Method 1 Method 8178 0.23 to 30.00 mg/l PO 4 Reagent Solution Scope and application: For water, wastewater and seawater. 1 Adapted from
Phosphorus, Reactive (Orthophosphate) DOC316.53.01113 Amino Acid Method 1 Method 8178 0.23 to 30.00 mg/l PO 4 Reagent Solution Scope and application: For water, wastewater and seawater. 1 Adapted from
Report prepared by: Kelly Hagan and Mark Anderson Grand River Conservation Authority 400 Clyde Road Cambridge ON N1R 5W6
 2013 Watershed Overview of Wastewater Treatment Plant Performance Report prepared by: Kelly Hagan and Mark Anderson Grand River Conservation Authority 400 Clyde Road Cambridge ON N1R 5W6 Table of Contents
One-Way Analysis of Variance
 One-Way Analysis of Variance Note: Much of the math here is tedious but straightforward. We ll skim over it in class but you should be sure to ask questions if you don t understand it. I. Overview A. We
SPSS 3: COMPARING MEANS
 SPSS 3: COMPARING MEANS UNIVERSITY OF GUELPH LUCIA COSTANZO [email protected] REVISED SEPTEMBER 2012 CONTENTS SPSS availability... 2 Goals of the workshop... 2 Data for SPSS Sessions... 3 Statistical
KSTAT MINI-MANUAL. Decision Sciences 434 Kellogg Graduate School of Management
 KSTAT MINI-MANUAL Decision Sciences 434 Kellogg Graduate School of Management Kstat is a set of macros added to Excel and it will enable you to do the statistics required for this course very easily. To
Good luck! BUSINESS STATISTICS FINAL EXAM INSTRUCTIONS. Name:
 Glo bal Leadership M BA BUSINESS STATISTICS FINAL EXAM Name: INSTRUCTIONS 1. Do not open this exam until instructed to do so. 2. Be sure to fill in your name before starting the exam. 3. You have two hours
CALCULATIONS & STATISTICS
 CALCULATIONS & STATISTICS CALCULATION OF SCORES Conversion of 1-5 scale to 0-100 scores When you look at your report, you will notice that the scores are reported on a 0-100 scale, even though respondents
Using Excel for inferential statistics
 FACT SHEET Using Excel for inferential statistics Introduction When you collect data, you expect a certain amount of variation, just caused by chance. A wide variety of statistical tests can be applied
Research Methodology: Tools
 MSc Business Administration Research Methodology: Tools Applied Data Analysis (with SPSS) Lecture 11: Nonparametric Methods May 2014 Prof. Dr. Jürg Schwarz Lic. phil. Heidi Bruderer Enzler Contents Slide
Testing for differences I exercises with SPSS
 Testing for differences I exercises with SPSS Introduction The exercises presented here are all about the t-test and its non-parametric equivalents in their various forms. In SPSS, all these tests can
EPS 625 INTERMEDIATE STATISTICS FRIEDMAN TEST
 EPS 625 INTERMEDIATE STATISTICS The Friedman test is an extension of the Wilcoxon test. The Wilcoxon test can be applied to repeated-measures data if participants are assessed on two occasions or conditions
Sample Management SOP 2v8 Page 1 STANDARD OPERATING PROCEDURE NO. 2 SAMPLE MANAGEMENT REVISION LOG. Revision Number Description Date
 Sample Management SOP 2v8 Page 1 STANDARD OPERATING PROCEDURE NO. 2 SAMPLE MANAGEMENT REVISION LOG Revision Number Description Date 2.0 Original SOP 2.1 Revisions by McLemore after field testing 1/3/04
1. What is the critical value for this 95% confidence interval? CV = z.025 = invnorm(0.025) = 1.96
 = 1.96") 1 Final Review 2 Review 2.1 CI 1-propZint Scenario 1 A TV manufacturer claims in its warranty brochure that in the past not more than 10 percent of its TV sets needed any repair during the first two years
1 Final Review 2 Review 2.1 CI 1-propZint Scenario 1 A TV manufacturer claims in its warranty brochure that in the past not more than 10 percent of its TV sets needed any repair during the first two years
Statistiek II. John Nerbonne. October 1, 2010. Dept of Information Science [email protected]
 Dept of Information Science [email protected] October 1, 2010 Course outline 1 One-way ANOVA. 2 Factorial ANOVA. 3 Repeated measures ANOVA. 4 Correlation and regression. 5 Multiple regression. 6 Logistic
Evaluating Laboratory Data. Tom Frick Environmental Assessment Section Bureau of Laboratories
 Evaluating Laboratory Data Tom Frick Environmental Assessment Section Bureau of Laboratories Overview of Presentation Lab operations review QA requirements MDLs/ PQLs Why do we sample? Protect physical,
Normality Testing in Excel
 Normality Testing in Excel By Mark Harmon Copyright 2011 Mark Harmon No part of this publication may be reproduced or distributed without the express permission of the author. [email protected]
Cadmium Reduction Method Method 8039 0.3 to 30.0 mg/l NO 3 N (HR) Powder Pillows or AccuVac Ampuls
 Powder Pillows or AccuVac Ampuls") Nitrate DOC316.53.01066 Cadmium Reduction Method Method 8039 0.3 to 30.0 mg/l NO 3 N (HR) Powder Pillows or AccuVac Ampuls Scope and application: For water, wastewater and seawater. Test preparation Instrument-specific
Nitrate DOC316.53.01066 Cadmium Reduction Method Method 8039 0.3 to 30.0 mg/l NO 3 N (HR) Powder Pillows or AccuVac Ampuls Scope and application: For water, wastewater and seawater. Test preparation Instrument-specific
Presented by Paul Krauth Utah DEQ. Salt Lake Countywide Watershed Symposium October 28-29, 2008
 Basic Nutrient Removal from Water Beta Edition Presented by Paul Krauth Utah DEQ Salt Lake Countywide Watershed Symposium October 28-29, 2008 Presentation Outline Salt Lake County waters / 303(d) listings
Point and Interval Estimates
 Point and Interval Estimates Suppose we want to estimate a parameter, such as p or µ, based on a finite sample of data. There are two main methods: 1. Point estimate: Summarize the sample by a single number
Introduction to Minitab and basic commands. Manipulating data in Minitab Describing data; calculating statistics; transformation.
 Computer Workshop 1 Part I Introduction to Minitab and basic commands. Manipulating data in Minitab Describing data; calculating statistics; transformation. Outlier testing Problem: 1. Five months of nickel
SPSS Guide How-to, Tips, Tricks & Statistical Techniques
 SPSS Guide How-to, Tips, Tricks & Statistical Techniques Support for the course Research Methodology for IB Also useful for your BSc or MSc thesis March 2014 Dr. Marijke Leliveld Jacob Wiebenga, MSc CONTENT
HYPOTHESIS TESTING: CONFIDENCE INTERVALS, T-TESTS, ANOVAS, AND REGRESSION
 HYPOTHESIS TESTING: CONFIDENCE INTERVALS, T-TESTS, ANOVAS, AND REGRESSION HOD 2990 10 November 2010 Lecture Background This is a lightning speed summary of introductory statistical methods for senior undergraduate
Suspended Solids: Unequal Results from Equal Methods
 Suspended Solids: Unequal Results from Equal Methods By John Stone As of November 2003, 40 CFR, Part 136 lists five approved methods for determining Total Suspended Solids (Residue). Major differences
Permutation Tests for Comparing Two Populations
 Permutation Tests for Comparing Two Populations Ferry Butar Butar, Ph.D. Jae-Wan Park Abstract Permutation tests for comparing two populations could be widely used in practice because of flexibility of
NONPARAMETRIC STATISTICS 1. depend on assumptions about the underlying distribution of the data (or on the Central Limit Theorem)
") NONPARAMETRIC STATISTICS 1 PREVIOUSLY parametric statistics in estimation and hypothesis testing... construction of confidence intervals computing of p-values classical significance testing depend on assumptions
NONPARAMETRIC STATISTICS 1 PREVIOUSLY parametric statistics in estimation and hypothesis testing... construction of confidence intervals computing of p-values classical significance testing depend on assumptions
Data Quality. Tips for getting it, keeping it, proving it! Central Coast Ambient Monitoring Program
 Data Quality Tips for getting it, keeping it, proving it! Central Coast Ambient Monitoring Program Why do we care? Program goals are key what do you want to do with the data? Data utility increases directly
Confidence Intervals for the Difference Between Two Means
 Chapter 47 Confidence Intervals for the Difference Between Two Means Introduction This procedure calculates the sample size necessary to achieve a specified distance from the difference in sample means
II. DISTRIBUTIONS distribution normal distribution. standard scores
 Appendix D Basic Measurement And Statistics The following information was developed by Steven Rothke, PhD, Department of Psychology, Rehabilitation Institute of Chicago (RIC) and expanded by Mary F. Schmidt,
UNDERSTANDING THE TWO-WAY ANOVA
 UNDERSTANDING THE e have seen how the one-way ANOVA can be used to compare two or more sample means in studies involving a single independent variable. This can be extended to two independent variables
Chapter 9. Two-Sample Tests. Effect Sizes and Power Paired t Test Calculation
 Chapter 9 Two-Sample Tests Paired t Test (Correlated Groups t Test) Effect Sizes and Power Paired t Test Calculation Summary Independent t Test Chapter 9 Homework Power and Two-Sample Tests: Paired Versus
CHAPTER 14 NONPARAMETRIC TESTS
 CHAPTER 14 NONPARAMETRIC TESTS Everything that we have done up until now in statistics has relied heavily on one major fact: that our data is normally distributed. We have been able to make inferences
LAB 4 INSTRUCTIONS CONFIDENCE INTERVALS AND HYPOTHESIS TESTING
 LAB 4 INSTRUCTIONS CONFIDENCE INTERVALS AND HYPOTHESIS TESTING In this lab you will explore the concept of a confidence interval and hypothesis testing through a simulation problem in engineering setting.
Assumptions. Assumptions of linear models. Boxplot. Data exploration. Apply to response variable. Apply to error terms from linear model
 Assumptions Assumptions of linear models Apply to response variable within each group if predictor categorical Apply to error terms from linear model check by analysing residuals Normality Homogeneity
This example of a completed sampling plan worksheet has been included to illustrate the information
 APPENDIX B EXAMPLE OF A COMPLETED SAMPLING PLAN WORKSHEET This example of a completed sampling plan worksheet has been included to illustrate the information necessary to document a sampling program for
Friedman's Two-way Analysis of Variance by Ranks -- Analysis of k-within-group Data with a Quantitative Response Variable
 Friedman's Two-way Analysis of Variance by Ranks -- Analysis of k-within-group Data with a Quantitative Response Variable Application: This statistic has two applications that can appear very different,
Lecture Notes Module 1
 Lecture Notes Module 1 Study Populations A study population is a clearly defined collection of people, animals, plants, or objects. In psychological research, a study population usually consists of a specific
t Tests in Excel The Excel Statistical Master By Mark Harmon Copyright 2011 Mark Harmon
 t-tests in Excel By Mark Harmon Copyright 2011 Mark Harmon No part of this publication may be reproduced or distributed without the express permission of the author. [email protected] www.excelmasterseries.com
Mixed 2 x 3 ANOVA. Notes
 Mixed 2 x 3 ANOVA This section explains how to perform an ANOVA when one of the variables takes the form of repeated measures and the other variable is between-subjects that is, independent groups of participants
COMPARISONS OF CUSTOMER LOYALTY: PUBLIC & PRIVATE INSURANCE COMPANIES.
 277 CHAPTER VI COMPARISONS OF CUSTOMER LOYALTY: PUBLIC & PRIVATE INSURANCE COMPANIES. This chapter contains a full discussion of customer loyalty comparisons between private and public insurance companies
Building Credibility: Quality Assurance & Quality Control for Volunteer Monitoring Programs
 Building Credibility: Quality Assurance & Quality Control for Volunteer Monitoring Programs Elizabeth Herron URI Watershed Watch/ National Facilitation of CSREES Volunteer Monitoring Ingrid Harrald Cook
Applying Statistics Recommended by Regulatory Documents
 Applying Statistics Recommended by Regulatory Documents Steven Walfish President, Statistical Outsourcing Services [email protected] 301-325 325-31293129 About the Speaker Mr. Steven
APPENDIX N. Data Validation Using Data Descriptors
 APPENDIX N Data Validation Using Data Descriptors Data validation is often defined by six data descriptors: 1) reports to decision maker 2) documentation 3) data sources 4) analytical method and detection
Multiple-Comparison Procedures
 Multiple-Comparison Procedures References A good review of many methods for both parametric and nonparametric multiple comparisons, planned and unplanned, and with some discussion of the philosophical
Non Parametric Inference
 Maura Department of Economics and Finance Università Tor Vergata Outline 1 2 3 Inverse distribution function Theorem: Let U be a uniform random variable on (0, 1). Let X be a continuous random variable
12: Analysis of Variance. Introduction
 1: Analysis of Variance Introduction EDA Hypothesis Test Introduction In Chapter 8 and again in Chapter 11 we compared means from two independent groups. In this chapter we extend the procedure to consider
Biostatistics: DESCRIPTIVE STATISTICS: 2, VARIABILITY
 Biostatistics: DESCRIPTIVE STATISTICS: 2, VARIABILITY 1. Introduction Besides arriving at an appropriate expression of an average or consensus value for observations of a population, it is important to
QUALITY ASSURANCE / QUALITY CONTROL POLICY BREG SOIL AND WATER QUALITY LABORATORY UNIVERSITY OF DELAWARE
 QUALITY ASSURANCE / QUALITY CONTROL POLICY BREG SOIL AND WATER QUALITY LABORATORY UNIVERSITY OF DELAWARE Department of Bioresources Engineering Rm 111 Worrilow Hall 531 S. College Ave. Newark, DE 19716-2140
Unit 26 Estimation with Confidence Intervals
 Unit 26 Estimation with Confidence Intervals Objectives: To see how confidence intervals are used to estimate a population proportion, a population mean, a difference in population proportions, or a difference