NONPARAMETRIC STATISTICS 1. depend on assumptions about the underlying distribution of the data (or on the Central Limit Theorem)
|
|
|
- Egbert Rodgers
- 9 years ago
- Views:
Transcription
1 NONPARAMETRIC STATISTICS 1 PREVIOUSLY parametric statistics in estimation and hypothesis testing... construction of confidence intervals computing of p-values classical significance testing depend on assumptions about the underlying distribution of the data (or on the Central Limit Theorem)

2 NONPARAMETRIC STATISTICS 2 nonparametric statistics no assumptions about underlying distribution of data used when... assumptions about underlying distributions are not met (data not normally distributed) sample sizes are small (n#30, cannot rely on Central Limit Theorem)
 sample sizes are small (n#30, cannot rely on")
3 NONPARAMETRIC STATISTICS 3 advantages can be used with non-normally distributed data can be used with discrete data (nominal, ordinal) simpler computations (questionable since it is rare to have to do any calculations without a program that is designed for statistical methods, e.g. Statcrunch, Statdisk, SAS) effect of outlier(s) less than when using a parametric method since actual data values are not used in computation

4 NONPARAMETRIC STATISTICS 4 disadvantages 'waste' information (e.g. if evaluating change in some quantity within subjects over time, the sign test would only classify change as -/0/+ while a paired t-test would use the actual measured change) not as 'efficient' (most texts use not as 'powerful') - there is more of a chance of not rejecting a false null hypothesis
 not")
5 NONPARAMETRIC STATISTICS 5 THREE TESTS sign test Wilcoxon Signed-Ranks Test for Matched Pairs (equivalent to a paired t-test) Wilcoxon Rank-Sum Test or Two Independent Samples (equivalent to two-sample t-test) there are MANY more nonparametric tests
 there are MANY more")
6 NONPARAMETRIC STATISTICS 6 SIGN TEST used to test claims involving matched pairs of data claims involving nominal data claims about the median of a single population requirements same issues as to sampling as before (random, representative) Note: No assumptions about the underlying distribution of the data. n (total of +/- results) # 25 table, n > 25 normal approximation

7 NONPARAMETRIC STATISTICS 7 Example from Rosner people are participants in a study to test whether two treatments differ in their ability to prevent redness resulting from exposure to sunlight... each person has a different treatment applied to their right and left arms... results... nominal data (and matched pairs) treatment A arm not as red as treatment B arm (-) 18 treatment B arm not as red as treatment A arm (+) 5 no difference as with McNemar's Test, the only data used are from the discordant results (the 5 with no difference are not used in computation of the test statistic)
 18 treatment B arm not as red as treatment A arm (+) 5 no difference as with McNemar's Test,")
8 NONPARAMETRIC STATISTICS 8 claim... there is no difference between treatments null hypothesis... H0: p = 05. H1: p 05. test statistic... z = ( x ) ( n/ 2) n / 2 = ( ) ( 40 / 2) 40 / 2 = 15. = where... x=number of times lest frequent sign occurs, and n=total + and - signs or... z = ( n+ ) ( n ) = n 40 3 = = critical value... with "=0.05, two-tail test, z=1.96

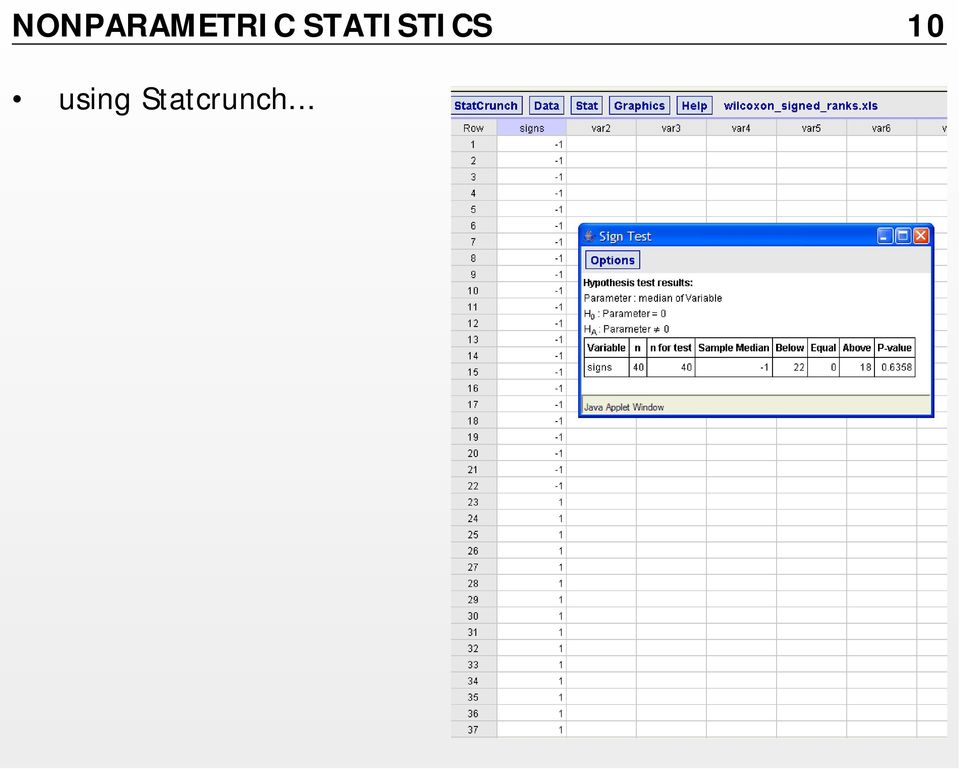
9 NONPARAMETRIC STATISTICS 9 P-value... from Statcrunch, p=0.3176, P-value= conclusion... fail to reject the null hypothesis no evidence that the two treatments differ alternative... fixed number of trials trials are independent each trial has only two possible outcomes probabilities remain constant for each trials binomial... n=40,k=18,p(k#18)=0.3179,p-value= n=40,k=22,p(k$22)=0.3179,p-value= when n#25... use values from table A-2, values are 'n' and 'k' from binomial tables with p=0.50
=0.3179,p-value=0.6358 n=40,k=22,p(k$22)=0.3179,p-value=0.6358 when n#25.")
10 NONPARAMETRIC STATISTICS 10 using Statcrunch...
11 NONPARAMETRIC STATISTICS 11 Example from Triola measurements of body temperature... test to see if the body temperatures come from a population with a median body temperature of (-) 97.5(-) (-) 98.0(-) 99.0(+) 98.5(-) 98.1(-) 98.4(-) 97.9(-) 97.9(-) 97.7(-) what is normal body temperature...
 97.7(-) what is normal body temperature... http://www.health.harvard.")
12 NONPARAMETRIC STATISTICS 12 claim... median temperature of population is 98.6 null hypothesis... H : median = H : median test statistic... z = ( n+ ) ( n ) = n 11 8 = = however... cannot use test statistic with n=11 P-value... from binomial distribution with n=11, p=0.50, probability of k#1 = , P-value=0.021 conclusion... reject the null hypothesis median not equal to 1.96

13 NONPARAMETRIC STATISTICS 13 WILCOXON SIGNED-RANKS TEST used to test claims involving matched pairs of data (do differences come from a population with a median value of zero) claims about the median of a single population requirements same issues as to sampling as before (random, representative) Note: No assumptions about the underlying distribution of the data. n (total of +/- results) # 30 table, n > 30 normal approximation

14 NONPARAMETRIC STATISTICS 14 Example from Rosner people are participants in a study to test whether two treatments differ in their ability to prevent redness resulting from exposure to sunlight... each person has a different treatment applied to their right and left arms... previously... results... nominal data (and matched pairs) treatment A arm not as red as treatment B arm (-) 18 treatment B arm not as red as treatment A arm (+) 5 no difference
.")
15 NONPARAMETRIC STATISTICS 15 new results measured in difference in degree of redness treatment A arm not as red as treatment B arm (n=22) + treatment B arm not as red as treatment A arm (n=18) 0 treatment A and B not different (n=5, not shown in table) as with the Sign Test, the only data used are from the discordant results (the 5 with no difference are not used in computation of the test statistic)
 as with the Sign Test, the only data used are from the discordant results (the 5 with no difference are not")
16 NONPARAMETRIC STATISTICS 16 distribution of actual differences shows much more information than merely comparing the number of positive and negative values...

17 NONPARAMETRIC STATISTICS 17 arrange results in a table... rank differences from lowest to highest without regard to the sign of the difference... 1(-) 1(-) 1(-) 1(-) (-) 2(-) 2(-) 2(-) (-) 3(-) 3(-) 3(-) 3(-) 3 3 4(-) 5(-) 5(-) 6(-) 6(-) 7(-) 7(-) 7(-) 8(-) assign ranks to each value... ties are assigned average rank (-) 7.5(-) 7.5(-) 7.5(-) (-) 19.5(-) 19.5(-) 19.5(-) (-) 28(-) 28(-) 28(-) 28(-) (-) 33.5(-) 33.5(-) 35.5(-) 35.5(-) 38(-) 38(-) 38(-) 40(-)
 19.5(-) 19.5(-) 19.5(-) 19.5 19.5 19.5 19.5 19.5 19.5 28(-) 28(-) 28(-) 28(-) 28(-) 28 28 32(-) 33.5(-) 33.5(-) 35.")
18 NONPARAMETRIC STATISTICS 18 sum the ranks assigned to the positive and negative values... positive (10) (6) + 28(2) = 248 negative (4) (4) + 28(5) + 32(1) (2) (2) + 38(3) + 40(1) = 572 (ranks should sum to n(n+1)/2 = 40(41)/2 = 820, if no difference, the positive and negative ranks should each sum to 410 and the test is trying to find if the sums of 248 and 572 are different enough from 410 to be a rare event) T = smaller of +/- ranks = 248 test statistic... z = T nn ( + 1) 4 nn ( + 1)( 2n+ 1) 24 = 40( 41) = 162 = ( 41)( 81)
 T = smaller of +/- ranks = 248 test")
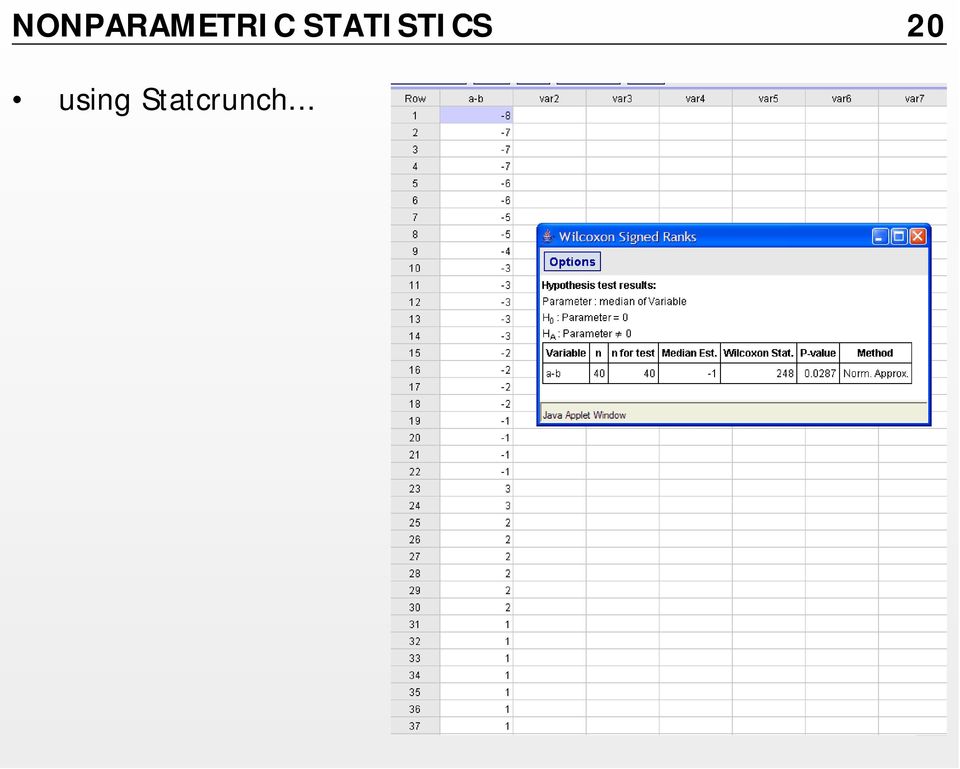
19 NONPARAMETRIC STATISTICS 19 critical value... from normal table, "=0.5, two-tail, 1.96 P-value... from normal table, p=0.0146, P-value=0.29 conclusion... reject the null hypothesis there is a difference in the effect of treatments A and B (a different conclusion than was found with the sign test - sign test is less powerful so one is more likely to accept an incorrect null hypothesis)

20 NONPARAMETRIC STATISTICS 20 using Statcrunch...
21 NONPARAMETRIC STATISTICS 21 alternative... imagine n (number of +/-) = 5 think of five chips numbered 1 through 5 on one side, 0 on the other (0 represents a negative value, 1 through 5 is a positive rank)... toss the five chips in the air possible ways that the five chips can land (2 5 ) sample space (sum of positive ranks)... sum=0 0,0,0,0,0 p=1/32 sum=1 1,0,0,0,0 p=1/32 sum=2 0,2,0,0,0 p=1/32 sum=3 0,0,3,0,0 1,2,0,0,0 p=2/32 sum=4 0,0,0,4,0 1,0,3,0,0 p=2/32 sum=5 0,0,0,0,5 p=1/32 only 'rare event' is sum=1 (p=2/32=.0625, 1-tail) same logic applies to any n (entries in table A-8)
22 NONPARAMETRIC STATISTICS 22 Example from Triola measurements of body temperature... test to see if the body temperatures come from a population with a median body temperature of rather than use just signs (below/above median), use the actual differences from the median value of 98.6 and follow the same procedure as just used with the Rosner data (-1.0) 97.5(-1.1) 98.6 (0) 98.2(-0.4) 98.0(-0.6) 99.0(+0.4) 98.5(-0.1) 98.1(-0.5) 98.4(-0.2) 97.9(-0.7) 97.9(-0.7) 97.7(-0.9) 0.1 (-) 0.2 (-) 0.4 (-) 0.4 (+) 0.5 (-) 0.6 (-) 0.7 (-) 0.7 (-) 0.9 (-) 1.0 (-) 1.1 (-) 1(-) 2(-) 3.5(-) 3.5 5(-) 6(-) 7.5(-) 7.5(-) 9(-) 10(-) 11(-)
23 NONPARAMETRIC STATISTICS 23 sum the ranks assigned to the positive and negative values... positive negative... 1(1) + 2(1) + 3.5(1) + 5(1) + 6(1) + 7.5(2) + 9(1) + 10(1) + 11(1) = 62.5 (ranks should sum to n(n+1)/2 = 11(12)/2 = 66, if no difference, the positive and negative ranks should each sum to 33 and the test is trying to find if the sums of 3.5 and 62.5 are different enough from 33 to be a rare event) T = smaller of +/- ranks = 3.5 test statistic... T since n#30 critical value... from table A-8 with n=11,"=0.5, two-tail, 11 conclusion... no reason to reject the null hypothesis that the median body temperature is 98.6
24 NONPARAMETRIC STATISTICS 24 WILCOXON RANK-SUM TEST used to test claims involving independent samples (do samples come from two populations with equal medians), sometimes referred to as the Mann-Whitney U Test requirements same issues as to sampling as before (random, representative) Note: No assumptions about the underlying distribution of the data. n>10 in both samples, use normal approximation, otherwise must use table values (no table in Triola)
25 NONPARAMETRIC STATISTICS 25 from...
26 NONPARAMETRIC STATISTICS 26 Example from Rosner... A protocol of meditation therapy is administered once a day to 20 patients with anxiety. The patients are given a psychiatric exam at baseline and at a follow-up exam 2 months later. The degree of improvement is rated on a 10-point scale, with 1 indicating the most improvement and 10 the least improvement. Similarly, 26 comparably affected patients with anxiety are given standard psychotherapy and are asked to come back 2 months later for a follow-up exam.
27 NONPARAMETRIC STATISTICS 27 study group control group
28 NONPARAMETRIC STATISTICS 28 combined groups... study group values are shaded assign ranks
29 NONPARAMETRIC STATISTICS 29 sum the ranks assigned to study group... 2(3) + 6.5(4) (7) (3) (2) +40(1) = 319 = R control ranks sum = 762 (ranks should sum to n(n+1)/2 = 46(47)/2 = 1081, if no difference, the positive and negative ranks should each sum to and the test is trying to find if the sums of 319 and 762 are different enough from to be a rare event) test statistic... z = ( R µ R)/ σ R n n + n + µ R = 1( 1 2 1) 20( ) = 2 2 = 10( 47) = 470 nn n + n + σ R = 12( 1 2 1) 20( 26)( ) = =
30 NONPARAMETRIC STATISTICS 30 test statistic... z R R R = ( µ )/ σ = ( )/ = 335. critical value... from normal table, "=0.05, two tail, 1.96 P-value... from normal table, p=0.0004, P-value= conclusion... reject the null hypothesis study group improved more than the control group
31 NONPARAMETRIC STATISTICS 31 same problem using Statdisk (on Triola CD)...
32 NONPARAMETRIC STATISTICS 32 same problem using Statcrunch (notice that Statcrunch uses the Mann-Whitney test, see problem in Triola)...
StatCrunch and Nonparametric Statistics
 StatCrunch and Nonparametric Statistics You can use StatCrunch to calculate the values of nonparametric statistics. It may not be obvious how to enter the data in StatCrunch for various data sets that
Difference tests (2): nonparametric
: nonparametric") NST 1B Experimental Psychology Statistics practical 3 Difference tests (): nonparametric Rudolf Cardinal & Mike Aitken 10 / 11 February 005; Department of Experimental Psychology University of Cambridge
NST 1B Experimental Psychology Statistics practical 3 Difference tests (): nonparametric Rudolf Cardinal & Mike Aitken 10 / 11 February 005; Department of Experimental Psychology University of Cambridge
Nonparametric tests these test hypotheses that are not statements about population parameters (e.g.,
 CHAPTER 13 Nonparametric and Distribution-Free Statistics Nonparametric tests these test hypotheses that are not statements about population parameters (e.g., 2 tests for goodness of fit and independence).
QUANTITATIVE METHODS BIOLOGY FINAL HONOUR SCHOOL NON-PARAMETRIC TESTS
 QUANTITATIVE METHODS BIOLOGY FINAL HONOUR SCHOOL NON-PARAMETRIC TESTS This booklet contains lecture notes for the nonparametric work in the QM course. This booklet may be online at http://users.ox.ac.uk/~grafen/qmnotes/index.html.
Non-Parametric Tests (I)
") Lecture 5: Non-Parametric Tests (I) KimHuat LIM [email protected] http://www.stats.ox.ac.uk/~lim/teaching.html Slide 1 5.1 Outline (i) Overview of Distribution-Free Tests (ii) Median Test for Two Independent
Lecture 5: Non-Parametric Tests (I) KimHuat LIM [email protected] http://www.stats.ox.ac.uk/~lim/teaching.html Slide 1 5.1 Outline (i) Overview of Distribution-Free Tests (ii) Median Test for Two Independent
Tutorial 5: Hypothesis Testing
 Tutorial 5: Hypothesis Testing Rob Nicholls [email protected] MRC LMB Statistics Course 2014 Contents 1 Introduction................................ 1 2 Testing distributional assumptions....................
Rank-Based Non-Parametric Tests
 Rank-Based Non-Parametric Tests Reminder: Student Instructional Rating Surveys You have until May 8 th to fill out the student instructional rating surveys at https://sakai.rutgers.edu/portal/site/sirs
THE FIRST SET OF EXAMPLES USE SUMMARY DATA... EXAMPLE 7.2, PAGE 227 DESCRIBES A PROBLEM AND A HYPOTHESIS TEST IS PERFORMED IN EXAMPLE 7.
 THERE ARE TWO WAYS TO DO HYPOTHESIS TESTING WITH STATCRUNCH: WITH SUMMARY DATA (AS IN EXAMPLE 7.17, PAGE 236, IN ROSNER); WITH THE ORIGINAL DATA (AS IN EXAMPLE 8.5, PAGE 301 IN ROSNER THAT USES DATA FROM
Permutation & Non-Parametric Tests
 Permutation & Non-Parametric Tests Statistical tests Gather data to assess some hypothesis (e.g., does this treatment have an effect on this outcome?) Form a test statistic for which large values indicate
The Wilcoxon Rank-Sum Test
 1 The Wilcoxon Rank-Sum Test The Wilcoxon rank-sum test is a nonparametric alternative to the twosample t-test which is based solely on the order in which the observations from the two samples fall. We
Nonparametric Statistics
 Nonparametric Statistics J. Lozano University of Goettingen Department of Genetic Epidemiology Interdisciplinary PhD Program in Applied Statistics & Empirical Methods Graduate Seminar in Applied Statistics
HYPOTHESIS TESTING (ONE SAMPLE) - CHAPTER 7 1. used confidence intervals to answer questions such as...
 - CHAPTER 7 1. used confidence intervals to answer questions such as...") HYPOTHESIS TESTING (ONE SAMPLE) - CHAPTER 7 1 PREVIOUSLY used confidence intervals to answer questions such as... You know that 0.25% of women have red/green color blindness. You conduct a study of men
HYPOTHESIS TESTING (ONE SAMPLE) - CHAPTER 7 1 PREVIOUSLY used confidence intervals to answer questions such as... You know that 0.25% of women have red/green color blindness. You conduct a study of men
Nonparametric Two-Sample Tests. Nonparametric Tests. Sign Test
 Nonparametric Two-Sample Tests Sign test Mann-Whitney U-test (a.k.a. Wilcoxon two-sample test) Kolmogorov-Smirnov Test Wilcoxon Signed-Rank Test Tukey-Duckworth Test 1 Nonparametric Tests Recall, nonparametric
Parametric and non-parametric statistical methods for the life sciences - Session I
 Why nonparametric methods What test to use? Rank Tests Parametric and non-parametric statistical methods for the life sciences - Session I Liesbeth Bruckers Geert Molenberghs Interuniversity Institute
HYPOTHESIS TESTING (ONE SAMPLE) - CHAPTER 7 1. used confidence intervals to answer questions such as...
 - CHAPTER 7 1. used confidence intervals to answer questions such as...") HYPOTHESIS TESTING (ONE SAMPLE) - CHAPTER 7 1 PREVIOUSLY used confidence intervals to answer questions such as... You know that 0.25% of women have red/green color blindness. You conduct a study of men
HYPOTHESIS TESTING (ONE SAMPLE) - CHAPTER 7 1 PREVIOUSLY used confidence intervals to answer questions such as... You know that 0.25% of women have red/green color blindness. You conduct a study of men
Statistics. One-two sided test, Parametric and non-parametric test statistics: one group, two groups, and more than two groups samples
 Statistics One-two sided test, Parametric and non-parametric test statistics: one group, two groups, and more than two groups samples February 3, 00 Jobayer Hossain, Ph.D. & Tim Bunnell, Ph.D. Nemours
Comparing Means in Two Populations
 Comparing Means in Two Populations Overview The previous section discussed hypothesis testing when sampling from a single population (either a single mean or two means from the same population). Now we
1 Nonparametric Statistics
 1 Nonparametric Statistics When finding confidence intervals or conducting tests so far, we always described the population with a model, which includes a set of parameters. Then we could make decisions
Statistics for Sports Medicine
 Statistics for Sports Medicine Suzanne Hecht, MD University of Minnesota ([email protected]) Fellow s Research Conference July 2012: Philadelphia GOALS Try not to bore you to death!! Try to teach
t Tests in Excel The Excel Statistical Master By Mark Harmon Copyright 2011 Mark Harmon
 t-tests in Excel By Mark Harmon Copyright 2011 Mark Harmon No part of this publication may be reproduced or distributed without the express permission of the author. [email protected] www.excelmasterseries.com
Two-Sample T-Tests Assuming Equal Variance (Enter Means)
") Chapter 4 Two-Sample T-Tests Assuming Equal Variance (Enter Means) Introduction This procedure provides sample size and power calculations for one- or two-sided two-sample t-tests when the variances of
Chapter 4 Two-Sample T-Tests Assuming Equal Variance (Enter Means) Introduction This procedure provides sample size and power calculations for one- or two-sided two-sample t-tests when the variances of
NCSS Statistical Software
 Chapter 06 Introduction This procedure provides several reports for the comparison of two distributions, including confidence intervals for the difference in means, two-sample t-tests, the z-test, the
Permutation Tests for Comparing Two Populations
 Permutation Tests for Comparing Two Populations Ferry Butar Butar, Ph.D. Jae-Wan Park Abstract Permutation tests for comparing two populations could be widely used in practice because of flexibility of
II. DISTRIBUTIONS distribution normal distribution. standard scores
 Appendix D Basic Measurement And Statistics The following information was developed by Steven Rothke, PhD, Department of Psychology, Rehabilitation Institute of Chicago (RIC) and expanded by Mary F. Schmidt,
Testing Group Differences using T-tests, ANOVA, and Nonparametric Measures
 Testing Group Differences using T-tests, ANOVA, and Nonparametric Measures Jamie DeCoster Department of Psychology University of Alabama 348 Gordon Palmer Hall Box 870348 Tuscaloosa, AL 35487-0348 Phone:
Parametric and Nonparametric: Demystifying the Terms
 Parametric and Nonparametric: Demystifying the Terms By Tanya Hoskin, a statistician in the Mayo Clinic Department of Health Sciences Research who provides consultations through the Mayo Clinic CTSA BERD
Two-Sample T-Tests Allowing Unequal Variance (Enter Difference)
") Chapter 45 Two-Sample T-Tests Allowing Unequal Variance (Enter Difference) Introduction This procedure provides sample size and power calculations for one- or two-sided two-sample t-tests when no assumption
Chapter 45 Two-Sample T-Tests Allowing Unequal Variance (Enter Difference) Introduction This procedure provides sample size and power calculations for one- or two-sided two-sample t-tests when no assumption
NCSS Statistical Software. One-Sample T-Test
 Chapter 205 Introduction This procedure provides several reports for making inference about a population mean based on a single sample. These reports include confidence intervals of the mean or median,
CHAPTER 14 NONPARAMETRIC TESTS
 CHAPTER 14 NONPARAMETRIC TESTS Everything that we have done up until now in statistics has relied heavily on one major fact: that our data is normally distributed. We have been able to make inferences
Research Methodology: Tools
 MSc Business Administration Research Methodology: Tools Applied Data Analysis (with SPSS) Lecture 11: Nonparametric Methods May 2014 Prof. Dr. Jürg Schwarz Lic. phil. Heidi Bruderer Enzler Contents Slide
Part 3. Comparing Groups. Chapter 7 Comparing Paired Groups 189. Chapter 8 Comparing Two Independent Groups 217
 Part 3 Comparing Groups Chapter 7 Comparing Paired Groups 189 Chapter 8 Comparing Two Independent Groups 217 Chapter 9 Comparing More Than Two Groups 257 188 Elementary Statistics Using SAS Chapter 7 Comparing
Skewed Data and Non-parametric Methods
 0 2 4 6 8 10 12 14 Skewed Data and Non-parametric Methods Comparing two groups: t-test assumes data are: 1. Normally distributed, and 2. both samples have the same SD (i.e. one sample is simply shifted
An Introduction to Statistics Course (ECOE 1302) Spring Semester 2011 Chapter 10- TWO-SAMPLE TESTS
 Spring Semester 2011 Chapter 10- TWO-SAMPLE TESTS") The Islamic University of Gaza Faculty of Commerce Department of Economics and Political Sciences An Introduction to Statistics Course (ECOE 130) Spring Semester 011 Chapter 10- TWO-SAMPLE TESTS Practice
The Islamic University of Gaza Faculty of Commerce Department of Economics and Political Sciences An Introduction to Statistics Course (ECOE 130) Spring Semester 011 Chapter 10- TWO-SAMPLE TESTS Practice
Chapter 8. Comparing Two Groups
 Chapter 8 Comparing Two Groups 1 Tests comparing two groups Two independent samples Two-sample t-test(normal populations) Wilcoxon rank-sum test (non-parametric) Two related samples Paired t-test (normal
Using Excel for inferential statistics
 FACT SHEET Using Excel for inferential statistics Introduction When you collect data, you expect a certain amount of variation, just caused by chance. A wide variety of statistical tests can be applied
Non-Inferiority Tests for Two Means using Differences
 Chapter 450 on-inferiority Tests for Two Means using Differences Introduction This procedure computes power and sample size for non-inferiority tests in two-sample designs in which the outcome is a continuous
UNIVERSITY OF NAIROBI
 UNIVERSITY OF NAIROBI MASTERS IN PROJECT PLANNING AND MANAGEMENT NAME: SARU CAROLYNN ELIZABETH REGISTRATION NO: L50/61646/2013 COURSE CODE: LDP 603 COURSE TITLE: RESEARCH METHODS LECTURER: GAKUU CHRISTOPHER
SCHOOL OF HEALTH AND HUMAN SCIENCES DON T FORGET TO RECODE YOUR MISSING VALUES
 SCHOOL OF HEALTH AND HUMAN SCIENCES Using SPSS Topics addressed today: 1. Differences between groups 2. Graphing Use the s4data.sav file for the first part of this session. DON T FORGET TO RECODE YOUR
General Method: Difference of Means. 3. Calculate df: either Welch-Satterthwaite formula or simpler df = min(n 1, n 2 ) 1.
 1.") General Method: Difference of Means 1. Calculate x 1, x 2, SE 1, SE 2. 2. Combined SE = SE1 2 + SE2 2. ASSUMES INDEPENDENT SAMPLES. 3. Calculate df: either Welch-Satterthwaite formula or simpler df = min(n
General Method: Difference of Means 1. Calculate x 1, x 2, SE 1, SE 2. 2. Combined SE = SE1 2 + SE2 2. ASSUMES INDEPENDENT SAMPLES. 3. Calculate df: either Welch-Satterthwaite formula or simpler df = min(n
HYPOTHESIS TESTING: POWER OF THE TEST
 HYPOTHESIS TESTING: POWER OF THE TEST The first 6 steps of the 9-step test of hypothesis are called "the test". These steps are not dependent on the observed data values. When planning a research project,
Introduction to Hypothesis Testing. Hypothesis Testing. Step 1: State the Hypotheses
 Introduction to Hypothesis Testing 1 Hypothesis Testing A hypothesis test is a statistical procedure that uses sample data to evaluate a hypothesis about a population Hypothesis is stated in terms of the
Study Guide for the Final Exam
 Study Guide for the Final Exam When studying, remember that the computational portion of the exam will only involve new material (covered after the second midterm), that material from Exam 1 will make
Solutions: Problems for Chapter 3. Solutions: Problems for Chapter 3
 Problem A: You are dealt five cards from a standard deck. Are you more likely to be dealt two pairs or three of a kind? experiment: choose 5 cards at random from a standard deck Ω = {5-combinations of
Nonparametric Statistics
 Nonparametric Statistics References Some good references for the topics in this course are 1. Higgins, James (2004), Introduction to Nonparametric Statistics 2. Hollander and Wolfe, (1999), Nonparametric
NCSS Statistical Software
 Chapter 06 Introduction This procedure provides several reports for the comparison of two distributions, including confidence intervals for the difference in means, two-sample t-tests, the z-test, the
Chapter 8 Hypothesis Testing Chapter 8 Hypothesis Testing 8-1 Overview 8-2 Basics of Hypothesis Testing
 Chapter 8 Hypothesis Testing 1 Chapter 8 Hypothesis Testing 8-1 Overview 8-2 Basics of Hypothesis Testing 8-3 Testing a Claim About a Proportion 8-5 Testing a Claim About a Mean: s Not Known 8-6 Testing
Paired T-Test. Chapter 208. Introduction. Technical Details. Research Questions
 Chapter 208 Introduction This procedure provides several reports for making inference about the difference between two population means based on a paired sample. These reports include confidence intervals
How To Test For Significance On A Data Set
 Non-Parametric Univariate Tests: 1 Sample Sign Test 1 1 SAMPLE SIGN TEST A non-parametric equivalent of the 1 SAMPLE T-TEST. ASSUMPTIONS: Data is non-normally distributed, even after log transforming.
EPS 625 INTERMEDIATE STATISTICS FRIEDMAN TEST
 EPS 625 INTERMEDIATE STATISTICS The Friedman test is an extension of the Wilcoxon test. The Wilcoxon test can be applied to repeated-measures data if participants are assessed on two occasions or conditions
MEASURES OF LOCATION AND SPREAD
 Paper TU04 An Overview of Non-parametric Tests in SAS : When, Why, and How Paul A. Pappas and Venita DePuy Durham, North Carolina, USA ABSTRACT Most commonly used statistical procedures are based on the
THE KRUSKAL WALLLIS TEST
 THE KRUSKAL WALLLIS TEST TEODORA H. MEHOTCHEVA Wednesday, 23 rd April 08 THE KRUSKAL-WALLIS TEST: The non-parametric alternative to ANOVA: testing for difference between several independent groups 2 NON
Introduction to Hypothesis Testing OPRE 6301
 Introduction to Hypothesis Testing OPRE 6301 Motivation... The purpose of hypothesis testing is to determine whether there is enough statistical evidence in favor of a certain belief, or hypothesis, about
Descriptive Statistics
 Descriptive Statistics Primer Descriptive statistics Central tendency Variation Relative position Relationships Calculating descriptive statistics Descriptive Statistics Purpose to describe or summarize
BA 275 Review Problems - Week 6 (10/30/06-11/3/06) CD Lessons: 53, 54, 55, 56 Textbook: pp. 394-398, 404-408, 410-420
 CD Lessons: 53, 54, 55, 56 Textbook: pp. 394-398, 404-408, 410-420") BA 275 Review Problems - Week 6 (10/30/06-11/3/06) CD Lessons: 53, 54, 55, 56 Textbook: pp. 394-398, 404-408, 410-420 1. Which of the following will increase the value of the power in a statistical test
BA 275 Review Problems - Week 6 (10/30/06-11/3/06) CD Lessons: 53, 54, 55, 56 Textbook: pp. 394-398, 404-408, 410-420 1. Which of the following will increase the value of the power in a statistical test
Stat 5102 Notes: Nonparametric Tests and. confidence interval
 Stat 510 Notes: Nonparametric Tests and Confidence Intervals Charles J. Geyer April 13, 003 This handout gives a brief introduction to nonparametrics, which is what you do when you don t believe the assumptions
Dongfeng Li. Autumn 2010
 Autumn 2010 Chapter Contents Some statistics background; ; Comparing means and proportions; variance. Students should master the basic concepts, descriptive statistics measures and graphs, basic hypothesis
Nonparametric statistics and model selection
 Chapter 5 Nonparametric statistics and model selection In Chapter, we learned about the t-test and its variations. These were designed to compare sample means, and relied heavily on assumptions of normality.
Once saved, if the file was zipped you will need to unzip it. For the files that I will be posting you need to change the preferences.
 1 Commands in JMP and Statcrunch Below are a set of commands in JMP and Statcrunch which facilitate a basic statistical analysis. The first part concerns commands in JMP, the second part is for analysis
Projects Involving Statistics (& SPSS)
") Projects Involving Statistics (& SPSS) Academic Skills Advice Starting a project which involves using statistics can feel confusing as there seems to be many different things you can do (charts, graphs,
Projects Involving Statistics (& SPSS) Academic Skills Advice Starting a project which involves using statistics can feel confusing as there seems to be many different things you can do (charts, graphs,
Introduction. Statistics Toolbox
 Introduction A hypothesis test is a procedure for determining if an assertion about a characteristic of a population is reasonable. For example, suppose that someone says that the average price of a gallon
ISyE 2028 Basic Statistical Methods - Fall 2015 Bonus Project: Big Data Analytics Final Report: Time spent on social media
 ISyE 2028 Basic Statistical Methods - Fall 2015 Bonus Project: Big Data Analytics Final Report: Time spent on social media Abstract: The growth of social media is astounding and part of that success was
Comparison of frequentist and Bayesian inference. Class 20, 18.05, Spring 2014 Jeremy Orloff and Jonathan Bloom
 Comparison of frequentist and Bayesian inference. Class 20, 18.05, Spring 2014 Jeremy Orloff and Jonathan Bloom 1 Learning Goals 1. Be able to explain the difference between the p-value and a posterior
C. The null hypothesis is not rejected when the alternative hypothesis is true. A. population parameters.
 Sample Multiple Choice Questions for the material since Midterm 2. Sample questions from Midterms and 2 are also representative of questions that may appear on the final exam.. A randomly selected sample
Statistical tests for SPSS
 Statistical tests for SPSS Paolo Coletti A.Y. 2010/11 Free University of Bolzano Bozen Premise This book is a very quick, rough and fast description of statistical tests and their usage. It is explicitly
MONT 107N Understanding Randomness Solutions For Final Examination May 11, 2010
 MONT 07N Understanding Randomness Solutions For Final Examination May, 00 Short Answer (a) (0) How are the EV and SE for the sum of n draws with replacement from a box computed? Solution: The EV is n times
CHAPTER 12 TESTING DIFFERENCES WITH ORDINAL DATA: MANN WHITNEY U
 CHAPTER 12 TESTING DIFFERENCES WITH ORDINAL DATA: MANN WHITNEY U Previous chapters of this text have explained the procedures used to test hypotheses using interval data (t-tests and ANOVA s) and nominal
Comparing Two Groups. Standard Error of ȳ 1 ȳ 2. Setting. Two Independent Samples
 Comparing Two Groups Chapter 7 describes two ways to compare two populations on the basis of independent samples: a confidence interval for the difference in population means and a hypothesis test. The
LAB 4 INSTRUCTIONS CONFIDENCE INTERVALS AND HYPOTHESIS TESTING
 LAB 4 INSTRUCTIONS CONFIDENCE INTERVALS AND HYPOTHESIS TESTING In this lab you will explore the concept of a confidence interval and hypothesis testing through a simulation problem in engineering setting.
Statistiek I. Proportions aka Sign Tests. John Nerbonne. CLCG, Rijksuniversiteit Groningen. http://www.let.rug.nl/nerbonne/teach/statistiek-i/
 Statistiek I Proportions aka Sign Tests John Nerbonne CLCG, Rijksuniversiteit Groningen http://www.let.rug.nl/nerbonne/teach/statistiek-i/ John Nerbonne 1/34 Proportions aka Sign Test The relative frequency
HYPOTHESIS TESTING WITH SPSS:
 HYPOTHESIS TESTING WITH SPSS: A NON-STATISTICIAN S GUIDE & TUTORIAL by Dr. Jim Mirabella SPSS 14.0 screenshots reprinted with permission from SPSS Inc. Published June 2006 Copyright Dr. Jim Mirabella CHAPTER
Overview of Non-Parametric Statistics PRESENTER: ELAINE EISENBEISZ OWNER AND PRINCIPAL, OMEGA STATISTICS
 Overview of Non-Parametric Statistics PRESENTER: ELAINE EISENBEISZ OWNER AND PRINCIPAL, OMEGA STATISTICS About Omega Statistics Private practice consultancy based in Southern California, Medical and Clinical
Sample Size and Power in Clinical Trials
 Sample Size and Power in Clinical Trials Version 1.0 May 011 1. Power of a Test. Factors affecting Power 3. Required Sample Size RELATED ISSUES 1. Effect Size. Test Statistics 3. Variation 4. Significance
Introduction to Statistics and Quantitative Research Methods
 Introduction to Statistics and Quantitative Research Methods Purpose of Presentation To aid in the understanding of basic statistics, including terminology, common terms, and common statistical methods.
We are often interested in the relationship between two variables. Do people with more years of full-time education earn higher salaries?
 Statistics: Correlation Richard Buxton. 2008. 1 Introduction We are often interested in the relationship between two variables. Do people with more years of full-time education earn higher salaries? Do
Outline. Definitions Descriptive vs. Inferential Statistics The t-test - One-sample t-test
 The t-test Outline Definitions Descriptive vs. Inferential Statistics The t-test - One-sample t-test - Dependent (related) groups t-test - Independent (unrelated) groups t-test Comparing means Correlation
Hypothesis Testing for Beginners
 Hypothesis Testing for Beginners Michele Piffer LSE August, 2011 Michele Piffer (LSE) Hypothesis Testing for Beginners August, 2011 1 / 53 One year ago a friend asked me to put down some easy-to-read notes
Name: Date: Use the following to answer questions 3-4:
 Name: Date: 1. Determine whether each of the following statements is true or false. A) The margin of error for a 95% confidence interval for the mean increases as the sample size increases. B) The margin
Good luck! BUSINESS STATISTICS FINAL EXAM INSTRUCTIONS. Name:
 Glo bal Leadership M BA BUSINESS STATISTICS FINAL EXAM Name: INSTRUCTIONS 1. Do not open this exam until instructed to do so. 2. Be sure to fill in your name before starting the exam. 3. You have two hours
Biostatistics: DESCRIPTIVE STATISTICS: 2, VARIABILITY
 Biostatistics: DESCRIPTIVE STATISTICS: 2, VARIABILITY 1. Introduction Besides arriving at an appropriate expression of an average or consensus value for observations of a population, it is important to
Non-Inferiority Tests for One Mean
 Chapter 45 Non-Inferiority ests for One Mean Introduction his module computes power and sample size for non-inferiority tests in one-sample designs in which the outcome is distributed as a normal random
Recall this chart that showed how most of our course would be organized:
 Chapter 4 One-Way ANOVA Recall this chart that showed how most of our course would be organized: Explanatory Variable(s) Response Variable Methods Categorical Categorical Contingency Tables Categorical
DATA INTERPRETATION AND STATISTICS
 PholC60 September 001 DATA INTERPRETATION AND STATISTICS Books A easy and systematic introductory text is Essentials of Medical Statistics by Betty Kirkwood, published by Blackwell at about 14. DESCRIPTIVE
Two Related Samples t Test
 Two Related Samples t Test In this example 1 students saw five pictures of attractive people and five pictures of unattractive people. For each picture, the students rated the friendliness of the person
Lesson 1: Comparison of Population Means Part c: Comparison of Two- Means
 Lesson : Comparison of Population Means Part c: Comparison of Two- Means Welcome to lesson c. This third lesson of lesson will discuss hypothesis testing for two independent means. Steps in Hypothesis
Analysis of Questionnaires and Qualitative Data Non-parametric Tests
 Analysis of Questionnaires and Qualitative Data Non-parametric Tests JERZY STEFANOWSKI Instytut Informatyki Politechnika Poznańska Lecture SE 2013, Poznań Recalling Basics Measurment Scales Four scales
Research Methods & Experimental Design
 Research Methods & Experimental Design 16.422 Human Supervisory Control April 2004 Research Methods Qualitative vs. quantitative Understanding the relationship between objectives (research question) and
SPSS Explore procedure
 SPSS Explore procedure One useful function in SPSS is the Explore procedure, which will produce histograms, boxplots, stem-and-leaf plots and extensive descriptive statistics. To run the Explore procedure,
Chapter G08 Nonparametric Statistics
 G08 Nonparametric Statistics Chapter G08 Nonparametric Statistics Contents 1 Scope of the Chapter 2 2 Background to the Problems 2 2.1 Parametric and Nonparametric Hypothesis Testing......................
Hypothesis Testing: Two Means, Paired Data, Two Proportions
 Chapter 10 Hypothesis Testing: Two Means, Paired Data, Two Proportions 10.1 Hypothesis Testing: Two Population Means and Two Population Proportions 1 10.1.1 Student Learning Objectives By the end of this
UNDERSTANDING THE DEPENDENT-SAMPLES t TEST
 UNDERSTANDING THE DEPENDENT-SAMPLES t TEST A dependent-samples t test (a.k.a. matched or paired-samples, matched-pairs, samples, or subjects, simple repeated-measures or within-groups, or correlated groups)
Biostatistics: Types of Data Analysis
 Biostatistics: Types of Data Analysis Theresa A Scott, MS Vanderbilt University Department of Biostatistics [email protected] http://biostat.mc.vanderbilt.edu/theresascott Theresa A Scott, MS
Study Design and Statistical Analysis
 Study Design and Statistical Analysis Anny H Xiang, PhD Department of Preventive Medicine University of Southern California Outline Designing Clinical Research Studies Statistical Data Analysis Designing
Section 7.1. Introduction to Hypothesis Testing. Schrodinger s cat quantum mechanics thought experiment (1935)
") Section 7.1 Introduction to Hypothesis Testing Schrodinger s cat quantum mechanics thought experiment (1935) Statistical Hypotheses A statistical hypothesis is a claim about a population. Null hypothesis
Section 7.1 Introduction to Hypothesis Testing Schrodinger s cat quantum mechanics thought experiment (1935) Statistical Hypotheses A statistical hypothesis is a claim about a population. Null hypothesis
Chapter 12 Nonparametric Tests. Chapter Table of Contents
 Chapter 12 Nonparametric Tests Chapter Table of Contents OVERVIEW...171 Testing for Normality...... 171 Comparing Distributions....171 ONE-SAMPLE TESTS...172 TWO-SAMPLE TESTS...172 ComparingTwoIndependentSamples...172
Difference of Means and ANOVA Problems
 Difference of Means and Problems Dr. Tom Ilvento FREC 408 Accounting Firm Study An accounting firm specializes in auditing the financial records of large firm It is interested in evaluating its fee structure,particularly
Testing for differences I exercises with SPSS
 Testing for differences I exercises with SPSS Introduction The exercises presented here are all about the t-test and its non-parametric equivalents in their various forms. In SPSS, all these tests can
Independent t- Test (Comparing Two Means)
") Independent t- Test (Comparing Two Means) The objectives of this lesson are to learn: the definition/purpose of independent t-test when to use the independent t-test the use of SPSS to complete an independent
Independent t- Test (Comparing Two Means) The objectives of this lesson are to learn: the definition/purpose of independent t-test when to use the independent t-test the use of SPSS to complete an independent
Analysis of Data. Organizing Data Files in SPSS. Descriptive Statistics
 Analysis of Data Claudia J. Stanny PSY 67 Research Design Organizing Data Files in SPSS All data for one subject entered on the same line Identification data Between-subjects manipulations: variable to