MET 3502 Synoptic Meteorology. Lecture 4: Surface Weather Elements
|
|
|
- Oliver Taylor
- 7 years ago
- Views:
Transcription
1 MET 3502 Synoptic Meteorology Lecture 4: Surface Weather Elements
 at the surface Example: ASOS (Automated Surface Observing System),")
2 Surface Weather Elements Not observations of the surface, but Observations made by an observer (or instrument) at the surface Example: ASOS (Automated Surface Observing System), below

3
4 Office of the Federal Coordinator for Meteorology Mission: To ensure the effective use of federal meteorological resources by leading the systematic coordination of operational weather requirements and services, and supporting research, among the federal agencies.
5 Federal Meteorological Handbook No. 1 --describes the surface weather observing program of the U.S. National Weather Service.
6 On July 1, 1996 the National Weather Service changed from the SAO (Surface Airways Observations) to the METAR/SPECI code for reporting hourly observations of surface weather data.
7 METAR, message d observation météorologique régulière pour l aviation, which is the French expression for Aviation Routine Meteorological Report. SPECI is derived from the French expression for Aviation Selected Special Meteorological Report.
8 The METAR Code METAR or SPECI CCCC YYGGggZ AUTO or COR dddff(f)gf m f m (f m )KT d n d n d n Vd x d x d x VVVVVSM [RD R D R /V R V R V R V R or RD R D R V N V N V N V N VV X V X V X V X FT] w w [N s N s N s h s h s h s or VVh s h s h s or SKC/CLR] T T /T d T d AP H P H P H P H RMK (Automated, Plain Language) (Additive Data and Automated Maintenance Indicators)
9 The Surface Station Model Surface data contained in METAR reports are plotted in a specific organized pattern known as the surface station model. The consistent organization of the station model makes it easier for the meteorologist analyzing a surface weather map to locate and to identify important information.
10 Sample Station Plot
11 Wind Speed and Direction Wind speed and wind direction are plotted using a wind arrow. The wind direction is plotted with the wind arrow indicating the direction of the wind blowing into the station circle.
12 Wind Speed Wind Speed is indicated by the number of half barbs, whole barbs, and flags. The wind speed is indicated by the sum of the wind speeds represent by the half barbs, whole barbs and flags.
13 Wind Direction The top of the arrow is not usually plotted any more to save space. indicates a wind from the south (i.e 180 degrees)
14 National Weather Service (NWS) uses the compass coordinate system to express wind direction
15 Wind Speed A half barb indicates 5 knots.
16 Wind Speed (cont.) A whole barb indicates 10 kts.
17 Wind Speed (cont.) A flag indicates 50 knots.
18 Wind Speed (cont.) Indicates a wind speed of = 65 knots.
19
20 PRESSURE Sea-level pressure is plotted in tenths of millibars (mb), with the leading 10 or 9 omitted. Below are some sample conversions between plotted and complete sea-level pressure values: Add either a 10 or 9 in front based on which would bring the value closer to Sea-level pressure<950mb is rare (only in tropical cyclones) and METAR code is unable to distinguish 1049 mb & 949 mb. You ll need to decide according to conditions. However, over continental US, the lowest sea-level pressure recorded is >950mb. 410: mb 103: mb 987: mb 872: mb
21 PRESSURE TREND The pressure trend has two components, a number and symbol, to indicate how the sea-level pressure has changed during the past three hours. The number provides the 3-hour change in tenths of millibars, while the symbol provides a graphic illustration of how this change occurred. Below are the meanings of the pressure trend symbols:
22 Cartoons are intuitive, for example Barometric Tendency
23 WEATHER A weather symbol is plotted if at the time of observation, there is either precipitation occurring or a condition causing reduced visibility. Below is a list of the most common weather symbols:
24 Current Weather That Affects Visibility
25 Precipitation
26 Most common symbols

27 SKY COVER The amount that the circle at the center of the station plot is filled in reflects the approximate amount that the sky is covered with clouds.
28 Surface Station Model Wind Speed Sky Cover Obscured Clear Wind Speed Calm 5 kt TEMP DEW Wind Direction SKY COVER PRES TT & TD are in o F (US) PP is in mb and tenths 1/8 Clouds ¼ Clouds 3/8 Clouds ½ Clouds 5/8 Clouds ¾ Clouds 7/8 Clouds Overcast 10 kt 15 kt 20 kt 25 kt 50 kt 55 kt 100 kt
29 Complete Surface Station Model LAND Grey elements are generally not used in automatic plotting
30
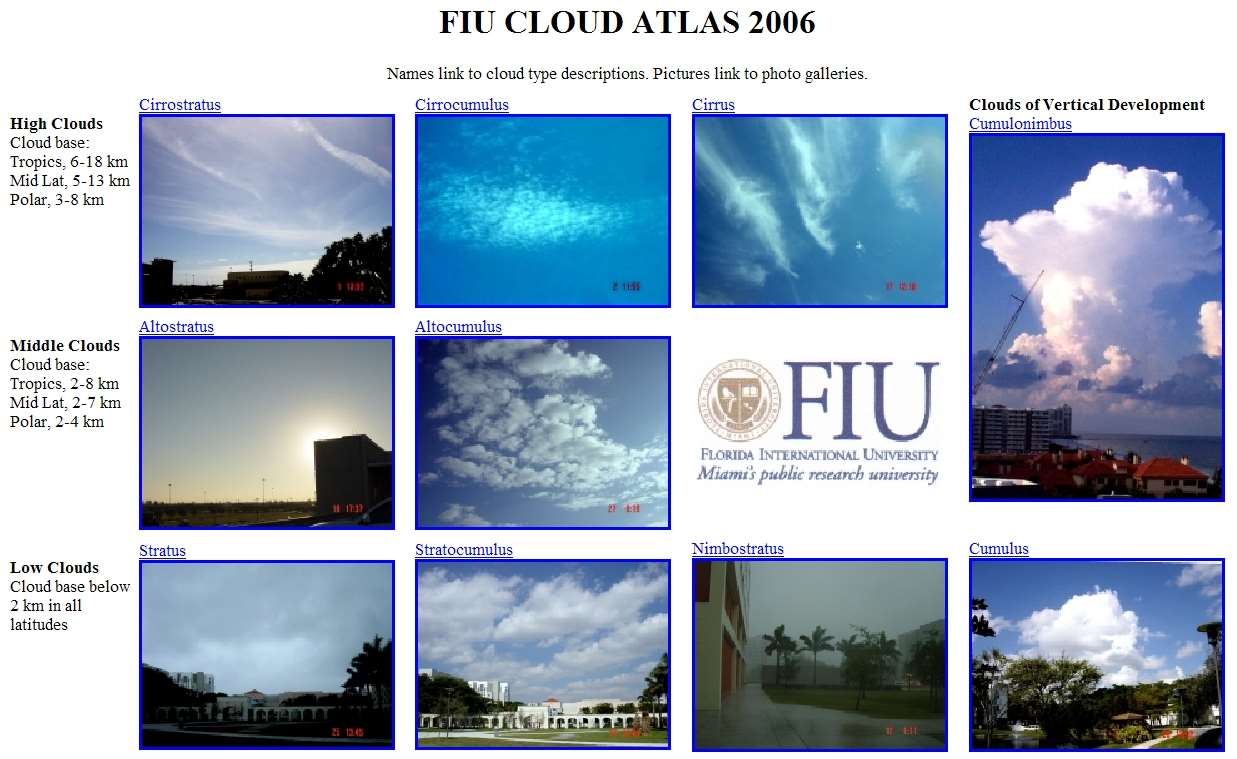
31 Low Clouds Bases below 2 km
32 Middle Clouds Bases 2-7 km

33 High Clouds Bases 5-13 km

34 A surface station interpreted Sky 7/8 Cloudy T & TD: 77 and 71 o F Pressure: mb Visibility 5 mi Present weather: RAIN Showers Barometer steady then falling by 0.3 mb Low Clouds: Towering Cumulus Middle Clouds: Thin Altocumulus High Clouds: Cirrus Past Weather: Showers Low cloud base: 2000 ft
35 A Sequence of Observations at a Station in the Heartland (central US)
36
37
38
39
40
41
42
43
44 Weather Summary
45 Surface Fronts and Boundaries Cold Front - a zone separating two air masses, of which the cooler, denser mass is advancing and replacing the warmer.
46 Warm Front - a transition zone between a mass of warm air and the cold air it is replacing.
47 Stationary Front - a front between warm and cold air masses that is moving very slowly or not at all.
48 Occluded Front - a composite of two fronts, formed as a cold front overtakes a warm or quasi-stationary front. Two types of occlusions can form depending on the relative coldness of the air behind the cold front to the air ahead of the warm or stationary front. A cold occlusion results when the coldest air is behind the cold front and a warm occlusion results when the coldest air is ahead of the warm front.
49 Trough - an elongated area of relatively low atmospheric pressure; the opposite of a ridge. On HPC's surface analyses, this feature is also used to depict outflow boundaries.
50 Squall Line - a line of active thunderstorms, either continuous or with breaks, including contiguous precipitation areas resulting from the existence of the thunderstorms.
51 Dry Line - a boundary separating moist and dry air masses. It typically lies north-south across the central and southern high Plains states during the spring and early summer, where it separates moist air from the Gulf of Mexico (to the east) and dry desert air from the southwestern states (to the west).
52 Tropical Wave - a trough or cyclonic curvature maximum in the trade wind easterlies.
53 Hash marks: A hash mark denotes a change in frontal type, as in the example below. The hash mark will always be drawn perpendicular to the boundaries. They are not drawn at "triple points" (the intersection of an occluded, cold and warm or stationary front) and where a low pressure center separates the different frontal types.
54 Depiction of frontogenesis and frontolysis Frontogenesis refers to the initial formation of a surface front or frontal zone, while frontolysis is the dissipation or weakening of a front. Frontogenesis is depicted on HPC's surface analysis and forecast charts as a dashed line with the graphical representation of the developing frontal type (the blue triangle for cold fronts, the red semicircle for warm fronts, etc...) drawn on each segment. For example, the image below shows a forming cold front.

55 Frontolysis is depicted as a dashed line with the graphical representation of the weakening frontal type drawn on every other segment. Below is an example of a dissipating warm front.
56
57
58 Online Symbols A good source of information about the symbols used in the surface station model is xmaps.htm _plot_symbols.htm#c A practice website: Knox/chap1/decoding_surface.html
Basics of weather interpretation
 Basics of weather interpretation Safety at Sea Seminar, April 2 nd 2016 Dr. Gina Henderson Oceanography Dept., USNA ghenders@usna.edu Image source: http://earthobservatory.nasa.gov/naturalhazards/view.php?id=80399,
Air Masses and Fronts
 Air Masses and Fronts Air Masses The weather of the United States east of the Rocky Mountains is dominated by large masses of air that travel south from the wide expanses of land in Canada, and north from
Name: OBJECTIVES Correctly define: WEATHER BASICS: STATION MODELS: MOISTURE: PRESSURE AND WIND: Weather
 Name: OBJECTIVES Correctly define: air mass, air pressure, anemometer, barometer, cyclone, dew point, front, isobar, isotherm, meteorology, precipitation, psychrometer, relative humidity, saturated, transpiration
How to analyze synoptic-scale weather patterns Table of Contents
 How to analyze synoptic-scale weather patterns Table of Contents Before You Begin... 2 1. Identify H and L pressure systems... 3 2. Locate fronts and determine frontal activity... 5 3. Determine surface
SIXTH GRADE WEATHER 1 WEEK LESSON PLANS AND ACTIVITIES
 SIXTH GRADE WEATHER 1 WEEK LESSON PLANS AND ACTIVITIES WATER CYCLE OVERVIEW OF SIXTH GRADE WATER WEEK 1. PRE: Evaluating components of the water cycle. LAB: Experimenting with porosity and permeability.
Weather Map Symbols, Abbreviations, and Features
 Weather Map Symbols, Abbreviations, and Features Table of Contents 1. Symbols... 2 Pressure Systems/Fronts... 2 Precipitation... 3 Wind Speed... 4 Center pressures (on Surface Maps)... 4 2. Abbreviations...
Winds. Winds on a weather map are represented by wind barbs; e.g., Notes:
 Winds Winds on a weather map are represented by wind barbs; e.g., flag half flag pennant wind direction The wind is blowing from the side with the flags and pennants (think an arrow with feathers) Speeds
WEATHER THEORY Temperature, Pressure And Moisture
 WEATHER THEORY Temperature, Pressure And Moisture Air Masses And Fronts Weather Theory- Page 77 Every physical process of weather is a result of a heat exchange. The standard sea level temperature is 59
WEATHER AND CLIMATE practice test
 WEATHER AND CLIMATE practice test Multiple Choice Identify the choice that best completes the statement or answers the question. 1. What role does runoff play in the water cycle? a. It is the process in
Name Period 4 th Six Weeks Notes 2015 Weather
 Name Period 4 th Six Weeks Notes 2015 Weather Radiation Convection Currents Winds Jet Streams Energy from the Sun reaches Earth as electromagnetic waves This energy fuels all life on Earth including the
2. The map below shows high-pressure and low-pressure weather systems in the United States.
 1. Which weather instrument has most improved the accuracy of weather forecasts over the past 40 years? 1) thermometer 3) weather satellite 2) sling psychrometer 4) weather balloon 6. Wind velocity is
Activity 8 Drawing Isobars Level 2 http://www.uni.edu/storm/activities/level2/index.shtml
 Activity 8 Drawing Isobars Level 2 http://www.uni.edu/storm/activities/level2/index.shtml Objectives: 1. Students will be able to define and draw isobars to analyze air pressure variations. 2. Students
Chapter 3: Weather Map. Weather Maps. The Station Model. Weather Map on 7/7/2005 4/29/2011
 Chapter 3: Weather Map Weather Maps Many variables are needed to described weather conditions. Local weathers are affected by weather pattern. We need to see all the numbers describing weathers at many
Mid latitude Cyclonic Storm System. 08 _15 ab. jpg
 Mid latitude Cyclonic Storm System 08 _15 ab. jpg Mid Latitude Cyclone Storm System (MLCSS) It has several names. Cyclone, Cyclonic Storm, Cyclonic System, Depression. Cyclonic Storms are the weather maker
Chapter 3: Weather Map. Station Model and Weather Maps Pressure as a Vertical Coordinate Constant Pressure Maps Cross Sections
 Chapter 3: Weather Map Station Model and Weather Maps Pressure as a Vertical Coordinate Constant Pressure Maps Cross Sections Weather Maps Many variables are needed to described dweather conditions. Local
FOURTH GRADE WEATHER
 FOURTH GRADE WEATHER 1 WEEK LESSON PLANS AND ACTIVITIES WATER CYCLE OVERVIEW OF FOURTH GRADE WATER WEEK 1. PRE: Comparing different reservoirs of water. LAB: Experimenting with surface tension and capillary
For further information, and additional background on the American Meteorological Society s Education Program, please contact:
 Project ATMOSPHERE This guide is one of a series produced by Project ATMOSPHERE, an initiative of the American Meteorological Society. Project ATMOSPHERE has created and trained a network of resource agents
Weather Forecasting. DELTA SCIENCE READER Overview... 103 Before Reading... 104 Guide the Reading... 105 After Reading... 114
 Weather Forecasting T ABLE OF CONTENTS ABOUT DELTA SCIENCE MODULES Program Introduction................... iii Teacher s Guide..................... iv Delta Science Readers................ vi Equipment
Synoptic Meteorology I: Meteorological Data and an Introduction to Synoptic Analysis. 2, 4 September 2014
 Synoptic Meteorology I: Meteorological Data and an Introduction to Synoptic Analysis Types of Meteorological Observations 2, 4 September 2014 There exist three primary types of meteorological observations:
WeatherBug Vocabulary Bingo
 Type of Activity: Game: Interactive activity that is competitive, and allows students to learn at the same time. Activity Overview: WeatherBug Bingo is a fun and engaging game for you to play with students!
Training Guide in Surface Weather Observations
 Training Guide in Surface Weather Observations MAY 1998 METAR KWSH 031558Z 11014KT 7SM SHRA BKN040 28/21 A3005 U.S. DEPARTMENT OF COMMERCE NATIONAL OCEANIC AND ATMOSPHERIC ADMINISTRATION National Weather
Weather Help - NEXRAD Radar Maps. Base Reflectivity
 Weather Help - NEXRAD Radar Maps Base Reflectivity Base Reflectivity Severe Thunderstorm/Torna do Watch Areas 16 levels depicted with colors from dark green (very light) to red (extreme) that indicate
Read and study the following information. After reading complete the review questions. Clouds
 Name: Pd: Read and study the following information. After reading complete the review questions. Clouds What are clouds? A cloud is a large collection of very tiny droplets of water or ice crystals. The
Aviation Weather Formats: METAR/TAF March 1999
 Aviation Weather Formats: METAR/TAF March 1999 U.S. Department of Transportation Federal Aviation Administration Introduction On July 1, 1996, the United States converted airport surface observations (SA's
Requirements for Meteorological Observations at Aerodromes
 Safety and Airspace Regulation Group Requirements for Meteorological Observations at Aerodromes CAP 746 Civil Aviation Authority 2014 All rights reserved. Copies of this publication may be reproduced for
7613-1 - Page 1. Weather Unit Exam Pre-Test Questions
 Weather Unit Exam Pre-Test Questions 7613-1 - Page 1 Name: 1) Equal quantities of water are placed in four uncovered containers with different shapes and left on a table at room temperature. From which
1. a. Surface Forecast Charts (USA and Ontario and Quebec) http://www.rap.ucar.edu/weather/
 http://www.rap.ucar.edu/weather/") COMPUTER ASSISTED METEOROLOGY Frank Pennauer This contribution gives the available computer data sources, how to access them and use this data for predicting Soaring weather conditions will be discussed
COMPUTER ASSISTED METEOROLOGY Frank Pennauer This contribution gives the available computer data sources, how to access them and use this data for predicting Soaring weather conditions will be discussed
Analyze Weather in Cold Regions and Mountainous Terrain
 Analyze Weather in Cold Regions and Mountainous Terrain Terminal Learning Objective Action: Analyze weather of cold regions and mountainous terrain Condition: Given a training mission that involves a specified
FOR SUBSCRIBERS ONLY! - TRIAL PASSWORD USERS MAY NOT REPRODUCE AND DISTRIBUTE PRINTABLE MATERIALS OFF THE SOLPASS WEBSITE!
 FOR SUBSCRIBERS ONLY! - TRIAL PASSWORD USERS MAY NOT REPRODUCE AND DISTRIBUTE PRINTABLE MATERIALS OFF THE SOLPASS WEBSITE! 1 NAME DATE GRADE 5 SCIENCE SOL REVIEW WEATHER LABEL the 3 stages of the water
New Aviation Weather Formats: METAR/TAF
 New Aviation Weather Formats: METAR/TAF June 1995 U.S. Department of Transportation Federal Aviation Administration NOTICE: The following METAR/TAF code formats are undergoing final changes. The proposed
This publication is available digitally on the AFDPO WWW site at: http://afpubs.hq.af.mil.
 BY ORDER OF THE SECRETARY OF THE AIR FORCE AIR FORCE MANUAL 15-111 18 SEPTEMBER 2001 Weather SURFACE WEATHER OBSERVATIONS NOTICE: This publication is available digitally on the AFDPO WWW site at: http://afpubs.hq.af.mil.
-ma, we see that the acceleration of a falling object (g) is g=g*m
 is g=g*m") Forces of Motion And Sir Isaac Newton Sir Isaac Newton, the father of mechanics, is one of the most important scientists who ever lived, changing the standards by which scientists think. His genius in
Forces of Motion And Sir Isaac Newton Sir Isaac Newton, the father of mechanics, is one of the most important scientists who ever lived, changing the standards by which scientists think. His genius in
Meteorology: Weather and Climate
 Meteorology: Weather and Climate Large Scale Weather Systems Lecture 1 Tropical Cyclones: Location and Structure Prof. Roy Thompson Crew building Large-scale Weather Systems Tropical cyclones (1-2) Location,
Convective Clouds. Convective clouds 1
 Convective clouds 1 Convective Clouds Introduction Convective clouds are formed in vertical motions that result from the instability of the atmosphere. This instability can be caused by: a. heating at
How do Scientists Forecast Thunderstorms?
 How do Scientists Forecast Thunderstorms? Objective In the summer, over the Great Plains, weather predictions often call for afternoon thunderstorms. While most of us use weather forecasts to help pick
6 th Grade Science Assessment: Weather & Water Select the best answer on the answer sheet. Please do not make any marks on this test.
 Select the be answer on the answer sheet. Please do not make any marks on this te. 1. Weather is be defined as the A. changes that occur in cloud formations from day to day. B. amount of rain or snow that
What Causes Climate? Use Target Reading Skills
 Climate and Climate Change Name Date Class Climate and Climate Change Guided Reading and Study What Causes Climate? This section describes factors that determine climate, or the average weather conditions
ASOS GUIDE FOR PILOTS
 ASOS GUIDE FOR PILOTS INTRODUCTION... 1 NOTICES TO AIRMEN... 1 SYSTEM DESCRIPTION... 2 WEATHER OBSERVATION ELEMENTS... 3 DATA NOT AUTOMATICALLY PROVIDED BY ASOS... 7 MISSING DATA AND NON EVENT DATA...
Description: This competition will test the student's knowledge of meteorological terms, techniques, and events.
 Weather or Not Description: This competition will test the student's knowledge of meteorological terms, techniques, and events. Number of Participants: 2 Approximate Time: 45 minutes The Competition: 1.
National Meteorological Library and Archive
 National Meteorological Library and Archive Fact sheet No. 11 Interpreting weather charts Weather systems On a weather chart, lines joining places with equal sea-level pressures are called isobars. Charts
How Do Oceans Affect Weather and Climate?
 How Do Oceans Affect Weather and Climate? In Learning Set 2, you explored how water heats up more slowly than land and also cools off more slowly than land. Weather is caused by events in the atmosphere.
How To Understand The Weather Patterns In Tallahassee, Florida
 PATTERN RECOGNITION OF SIGNIFICANT SNOWFALL EVENTS IN TALLAHASSEE, FLORIDA Jeffery D. Fournier and Andrew I. Watson NOAA/National Weather Service Weather Forecast Office Tallahassee, Florida Abstract Skew-T
AERODROME METEOROLOGICAL OBSERVATION AND FORECAST STUDY GROUP (AMOFSG)
") 23/12/09 AERODROME METEOROLOGICAL OBSERVATION AND FORECAST STUDY GROUP (AMOFSG) EIGHTH MEETING Melbourne, Australia, 15 to 18 February 2010 Agenda Item 5: Observing and forecasting at the aerodrome and
23/12/09 AERODROME METEOROLOGICAL OBSERVATION AND FORECAST STUDY GROUP (AMOFSG) EIGHTH MEETING Melbourne, Australia, 15 to 18 February 2010 Agenda Item 5: Observing and forecasting at the aerodrome and
Storms Short Study Guide
 Name: Class: Date: Storms Short Study Guide Multiple Choice Identify the letter of the choice that best completes the statement or answers the question. 1. A(n) thunderstorm forms because of unequal heating
Gold Seal Online Ground School www.onlinegroundschool.com
 Weather Charts and Reports Relating to weather reports: Ceiling Lowest layer of broken or overcast clouds IFR Ceilings less than 1,000 feet or visibilities less than three statute miles MVFR Ceilings between
Humidity, Condensation, Clouds, and Fog. Water in the Atmosphere
 Humidity, Condensation, Clouds, and Fog or Water in the Atmosphere The Hydrologic Cycle Where the Water Exists on Earth Evaporation From the Oceans and Land The Source of Water Vapor for the Atmosphere
CGC1D1: Interactions in the Physical Environment Factors that Affect Climate
 Name: Date: Day/Period: CGC1D1: Interactions in the Physical Environment Factors that Affect Climate Chapter 12 in the Making Connections textbook deals with Climate Connections. Use pages 127-144 to fill
Temperature and Humidity
 Temperature and Humidity Overview Water vapor is a very important gas in the atmosphere and can influence many things like condensation and the formation of clouds and rain, as well as how hot or cold
Chapter 7 CLOUDS IDENTIFICATION
 Chapter 7 CLOUDS Clouds, to almost everyone, have some meaning. But to you as a pilot, clouds are your weather "signposts in the sky." They give you an indication of air motion, stability, and moisture.
Anticyclones, depressions, hot & drought, cold & snow
 AS/A2-Level Geography Anticyclones, depressions, hot & drought, cold & snow Learning Objectives: To describe and explain the weather associated with high and low pressure systems and their links to extreme
YEAR 1: Seasons and Weather
 YEAR 1: Seasons and Weather Contents Include: The four seasons Tools to record the weather Making graphs Clouds Weather forecasts Weather around the world Please Note: The activities included in this pack
Texas Department of Public Safety Texas Division of Emergency Management. Texas State Operations Center
 Texas Department of Public Safety Texas Division of Emergency Management Texas State Operations Center Situation Awareness Brief Saturday, July 20 th 2013 As of 0900 CDT Tropical Weather Outlook For the
How do I measure the amount of water vapor in the air?
 How do I measure the amount of water vapor in the air? Materials 2 Centigrade Thermometers Gauze Fan Rubber Band Tape Overview Water vapor is a very important gas in the atmosphere and can influence many
Introduction to the forecasting world Jukka Julkunen FMI, Aviation and military WS
 Boundary layer challenges for aviation forecaster Introduction to the forecasting world Jukka Julkunen FMI, Aviation and military WS 3.12.2012 Forecast for general public We can live with it - BUT Not
How To Find Out If The Winds From The Oak Ridge Site Are Calm
 EVALUATING THE WIND DATA FROM THE AUTOMATED SURFACE OBSERVING SYSTEM IN OAK RIDGE, TENNESSEE - IS KOQT THE CALMEST SITE IN THE US? Thomas E. Bellinger, CCM Y-12 National Security Complex Oak Ridge, Tennessee
Clouds/WX Codes. B.1 Introduction
 Clouds/WX Codes B.1 Introduction This appendix provides the necessary tables and specific instructions to enter Clouds/Wx at the Surface Data screen. This guidance assumes no previous knowledge of synoptic
Formation & Classification
 CLOUDS Formation & Classification DR. K. K. CHANDRA Department of forestry, Wildlife & Environmental Sciences, GGV, Bilaspur What is Cloud It is mass of tiny water droplets or ice crystals or both of size
Early Season Northwest Flow Snowfall Event 28 October 2008
 Early Season Northwest Flow Snowfall Event 28 October 2008 Scott Krentz NOAA/National Weather Service Greer, SC 1. Introduction A post frontal northwest flow snowfall event affected the mountains of North
Hurricanes. Characteristics of a Hurricane
 Hurricanes Readings: A&B Ch. 12 Topics 1. Characteristics 2. Location 3. Structure 4. Development a. Tropical Disturbance b. Tropical Depression c. Tropical Storm d. Hurricane e. Influences f. Path g.
Temperature affects water in the air.
 KEY CONCEPT Most clouds form as air rises and cools. BEFORE, you learned Water vapor circulates from Earth to the atmosphere Warm air is less dense than cool air and tends to rise NOW, you will learn How
Comparative Evaluation of High Resolution Numerical Weather Prediction Models COSMO-WRF
 3 Working Group on Verification and Case Studies 56 Comparative Evaluation of High Resolution Numerical Weather Prediction Models COSMO-WRF Bogdan Alexandru MACO, Mihaela BOGDAN, Amalia IRIZA, Cosmin Dănuţ
Tephigrams: What you need to know
 Tephigrams: What you need to know Contents An Introduction to Tephigrams...3 Can be as complicated as you like!...4 What pilots need to know...5 Some fundamentals...6 Air...6 Why does the air cool as it
ENVIRONMENTAL STRUCTURE AND FUNCTION: CLIMATE SYSTEM Vol. II - Low-Latitude Climate Zones and Climate Types - E.I. Khlebnikova
 LOW-LATITUDE CLIMATE ZONES AND CLIMATE TYPES E.I. Khlebnikova Main Geophysical Observatory, St. Petersburg, Russia Keywords: equatorial continental climate, ITCZ, subequatorial continental (equatorial
Monsoon Variability and Extreme Weather Events
 Monsoon Variability and Extreme Weather Events M Rajeevan National Climate Centre India Meteorological Department Pune 411 005 rajeevan@imdpune.gov.in Outline of the presentation Monsoon rainfall Variability
Chapter 7 Stability and Cloud Development. Atmospheric Stability
 Chapter 7 Stability and Cloud Development Atmospheric Stability 1 Cloud Development - stable environment Stable air (parcel) - vertical motion is inhibited if clouds form, they will be shallow, layered
Heat Transfer and the Movement of Air
 LESSON 4 Heat Transfer and the Movement of Air INTRODUCTION How can a hang glider stay up in the air for hours without a motor? How can a bird soar over an open field without flapping its wings? They can
This chapter discusses: 1. Definitions and causes of stable and unstable atmospheric air. 2. Processes that cause instability and cloud development
 Stability & Cloud Development This chapter discusses: 1. Definitions and causes of stable and unstable atmospheric air 2. Processes that cause instability and cloud development Stability & Movement A rock,
Chapter Overview. Seasons. Earth s Seasons. Distribution of Solar Energy. Solar Energy on Earth. CHAPTER 6 Air-Sea Interaction
 Chapter Overview CHAPTER 6 Air-Sea Interaction The atmosphere and the ocean are one independent system. Earth has seasons because of the tilt on its axis. There are three major wind belts in each hemisphere.
8.5 Comparing Canadian Climates (Lab)
") These 3 climate graphs and tables of data show average temperatures and precipitation for each month in Victoria, Winnipeg and Whitehorse: Figure 1.1 Month J F M A M J J A S O N D Year Precipitation 139
These 3 climate graphs and tables of data show average temperatures and precipitation for each month in Victoria, Winnipeg and Whitehorse: Figure 1.1 Month J F M A M J J A S O N D Year Precipitation 139
Seasonal Temperature Variations
 Seasonal and Daily Temperatures Fig. 3-CO, p. 54 Seasonal Temperature Variations What causes the seasons What governs the seasons is the amount of solar radiation reaching the ground What two primary factors
Partnerships Implementing Engineering Education Worcester Polytechnic Institute Worcester Public Schools
 Partnerships Implementing Engineering Education Worcester Polytechnic Institute Worcester Public Schools Supported by: National Science Foundation Weather: 4.H.3 Weather and Classical Instruments Grade
SKEW-T, LOG-P DIAGRAM ANALYSIS PROCEDURES
 SKEW-T, LOG-P DIAGRAM ANALYSIS PROCEDURES I. THE SKEW-T, LOG-P DIAGRAM The primary source for information contained in this appendix was taken from the Air Weather Service Technical Report TR-79/006. 1
WEATHER AND CLIMATE WHY DOES IT MATTER?
 WEATHER AND CLIMATE Rising global average temperature is associated with widespread changes in weather patterns. Scientific studies indicate that extreme weather events such as heat waves and large storms
Southern AER Atmospheric Education Resource
 Southern AER Atmospheric Education Resource Vol. 9 No. 5 Spring 2003 Editor: Lauren Bell In this issue: g Climate Creations exploring mother nature s remote control for weather and Climate. g Crazy Climate
The Anatomy of a Forecast
 The Anatomy of a Forecast The Met Service issues forecasts for sky condition, precipitation probability, wind, seas state and temperature on a routine basis. Because the weather is always changing, the
EXPLANATION OF WEATHER ELEMENTS AND VARIABLES FOR THE DAVIS VANTAGE PRO 2 MIDSTREAM WEATHER STATION
 EXPLANATION OF WEATHER ELEMENTS AND VARIABLES FOR THE DAVIS VANTAGE PRO 2 MIDSTREAM WEATHER STATION The Weather Envoy consists of two parts: the Davis Vantage Pro 2 Integrated Sensor Suite (ISS) and the
MIAMI-SOUTH FLORIDA National Weather Service Forecast Office http://www.weather.gov/miami
 MIAMI-SOUTH FLORIDA National Weather Service Forecast Office http://www.weather.gov/miami January Summary: Warm and Dry Winter Rolls On February 1, 2013: South Florida s warm and dry winter pattern of
Climate of Illinois Narrative Jim Angel, state climatologist. Introduction. Climatic controls
 Climate of Illinois Narrative Jim Angel, state climatologist Introduction Illinois lies midway between the Continental Divide and the Atlantic Ocean, and the state's southern tip is 500 miles north of
1 In this report, "tropical cyclone (TC)" is used as a generic term that includes "low pressure area (LPA)", "tropical depression
 is used as a generic term that includes low pressure area (LPA), tropical depression") Comparative Study on Organized Convective Cloud Systems detected through Early Stage Dvorak Analysis and Tropical Cyclones in Early Developing Stage in the Western North Pacific and the South China Sea
Comparative Study on Organized Convective Cloud Systems detected through Early Stage Dvorak Analysis and Tropical Cyclones in Early Developing Stage in the Western North Pacific and the South China Sea
Empirical study of the temporal variation of a tropical surface temperature on hourly time integration
 Global Advanced Research Journal of Physical and Applied Sciences Vol. 4 (1) pp. 051-056, September, 2015 Available online http://www.garj.org/garjpas/index.htm Copyright 2015 Global Advanced Research
Weather Merit Badge Workbook
 Merit Badge Workbook This workbook can help you but you still need to read the merit badge pamphlet. The work space provided for each requirement should be used by the Scout to make notes for discussing
CENTRAL TEXAS COLLEGE SYLLABUS FOR AIRP 1307 AVIATION METEOROLOGY Semester Hours Credit: 3
 CENTRAL TEXAS COLLEGE SYLLABUS FOR AIRP 1307 AVIATION METEOROLOGY Semester Hours Credit: 3 INSTRUCTOR: OFFICE HOURS: I. INTRODUCTION A. The purpose of this course is to study Meteorology as it applies
UNIT IV--TEMPERATURE-MOISTURE RELATIONSHIP
 UNIT IV--TEMPERATURE-MOISTURE RELATIONSHIP Weather is the most variable and often the most critical determinant of fire behavior. This is the first of several units that will deal with weather and its
Scholar: Elaina R. Barta. NOAA Mission Goal: Climate Adaptation and Mitigation
 Development of Data Visualization Tools in Support of Quality Control of Temperature Variability in the Equatorial Pacific Observed by the Tropical Atmosphere Ocean Data Buoy Array Abstract Scholar: Elaina
COMMON CORE Lessons & Activities
 T E AC H I T SA M PL E COMMON CORE Lessons & Activities DAY! O T Common Core Lessons & Activities: Weather By Carole Marsh Published by Gallopade International, Inc. Carole Marsh/Gallopade Printed in the
Tropical Cyclone Report Hurricane Fausto (EP072008) 16-22 July 2008. John L. Beven II National Hurricane Center 19 November 2008
 16-22 July 2008. John L. Beven II National Hurricane Center 19 November 2008") Tropical Cyclone Report Hurricane Fausto (EP072008) 16-22 July 2008 John L. Beven II National Hurricane Center 19 November 2008 Fausto was a category 1 hurricane on the Saffir-Simpson Hurricane Scale that
Tropical Cyclone Report Hurricane Fausto (EP072008) 16-22 July 2008 John L. Beven II National Hurricane Center 19 November 2008 Fausto was a category 1 hurricane on the Saffir-Simpson Hurricane Scale that
Air Temperature With Flow Over a Mountain
 Air Temperature With Flow Over a Mountain WHAT YOU SHOULD LEARN IN THIS EXERCISE: Identify how air temperature changes when wind flow encounters topography. BACKGROUND INFORMATION Program In the program
Activity 4 Clouds Over Your Head Level 1
 Activity 4 Clouds Over Your Head Level 1 1 Objectives: Students will become familiar with the four main types of clouds: stratus, cirrus, cumulus, and cumulonimbus and their characteristics. Students will
The Pennsylvania Observer
 The Pennsylvania Observer August 3, 2009 July 2009 - Pennsylvania Weather Recap Written by: Dan DePodwin After a cool month of June, some hoped July would bring usual summertime warmth to the state of
Clouds, Fog, & Precipitation
 firecatching.blogspot.com Kids.brittanica.com Clouds and fog are physically the same just location is different Fog is considered a stratus cloud at or near the surface What does one see when looking at
List 10 different words to describe the weather in the box, below.
 Weather and Climate Lesson 1 Web Quest: What is the Weather? List 10 different words to describe the weather in the box, below. How do we measure the weather? Use this web link to help you: http://www.bbc.co.uk/weather/weatherwise/activities/weatherstation/
AIRCRAFT PERFORMANCE Pressure Altitude And Density Altitude
 Performance- Page 67 AIRCRAFT PERFORMANCE Pressure Altitude And Density Altitude Pressure altitude is indicated altitude corrected for nonstandard pressure. It is determined by setting 29.92 in the altimeter
CLIMATE, WATER & LIVING PATTERNS THINGS
 CLIMATE, WATER & LIVING PATTERNS NAME THE SIX MAJOR CLIMATE REGIONS DESCRIBE EACH CLIMATE REGION TELL THE FIVE FACTORS THAT AFFECT CLIMATE EXPLAIN HOW THOSE FACTORS AFFECT CLIMATE DESCRIBE HOW CLIMATES
Technical Attachment. The National Weather Service Estimated Actual Velocity Radar Tool. Ken Falk WFO Shreveport, Louisiana
 SRH STSD 2007-03 October 2007 Technical Attachment The National Weather Service Estimated Actual Velocity Radar Tool 1. Introduction Ken Falk WFO Shreveport, Louisiana A radar analysis tool has been introduced
IMPACT OF SAINT LOUIS UNIVERSITY-AMERENUE QUANTUM WEATHER PROJECT MESONET DATA ON WRF-ARW FORECASTS
 IMPACT OF SAINT LOUIS UNIVERSITY-AMERENUE QUANTUM WEATHER PROJECT MESONET DATA ON WRF-ARW FORECASTS M. J. Mueller, R. W. Pasken, W. Dannevik, T. P. Eichler Saint Louis University Department of Earth and
Georgia Performance Standards Framework for Natural Disasters 6 th Grade
 The following instructional plan is part of a GaDOE collection of Unit Frameworks, Performance Tasks, examples of Student Work, and Teacher Commentary. Many more GaDOE approved instructional plans are
Common Cloud Names, Shapes, and Altitudes:
 Common Cloud Names, Shapes, and Altitudes: Low Clouds Middle Clouds High Clouds Genus Cumulus Cumulonimbus (extend through all 3 levels) Stratus Stratocumulus Altocumulus Altostratus Nimbostratus (extend
North American METAR codes
 North American METAR codes North American METARs deviate from the WMO (who write the code on behalf of ICAO) FM 15-XII code. Details are listed in the FAA's Aeronautical Information Manual (AIM), but the
For more detailed information, see your Vantage Vue Console manual.
 For more detailed information, see your Vantage Vue Console manual. Current Weather Mode Moon phase, alarm & forecast icons Wind Rose Compass Antenna icon shows active transmission Graph of selected variable
Climates are described by the same conditions used to describe
 58 The Causes of Climate R E A D I N G Climates are described by the same conditions used to describe weather, such as temperature, precipitation, and wind. You now know that oceans have an important effect