Productivity in Cloud Forests in the Andes
|
|
|
- Merry Manning
- 10 years ago
- Views:
Transcription
1 Productivity in Cloud Forests in the Andes Carbon cycle measurements and model results from JULES Toby Marthews Leeds, 10th June 2010 at the Oxford University Centre for the Environment (OUCE) in association with the Andes Biodiversity and Ecosystem Research Group (ABERG) and the RAINFOR network
 in association with the Andes Biodiversity and Ecosystem Research Group")
2 Cloud Forests Cloud forests (=upper montane forest =ceja de la montaña) only represent 0.26% of the world s land surface, but are a high conservation priority: If the Amazon warms by 2-4 C then will the cloud forest biome go extinct or migrate to higher elevations? Worldwide Cloud Forest distribution

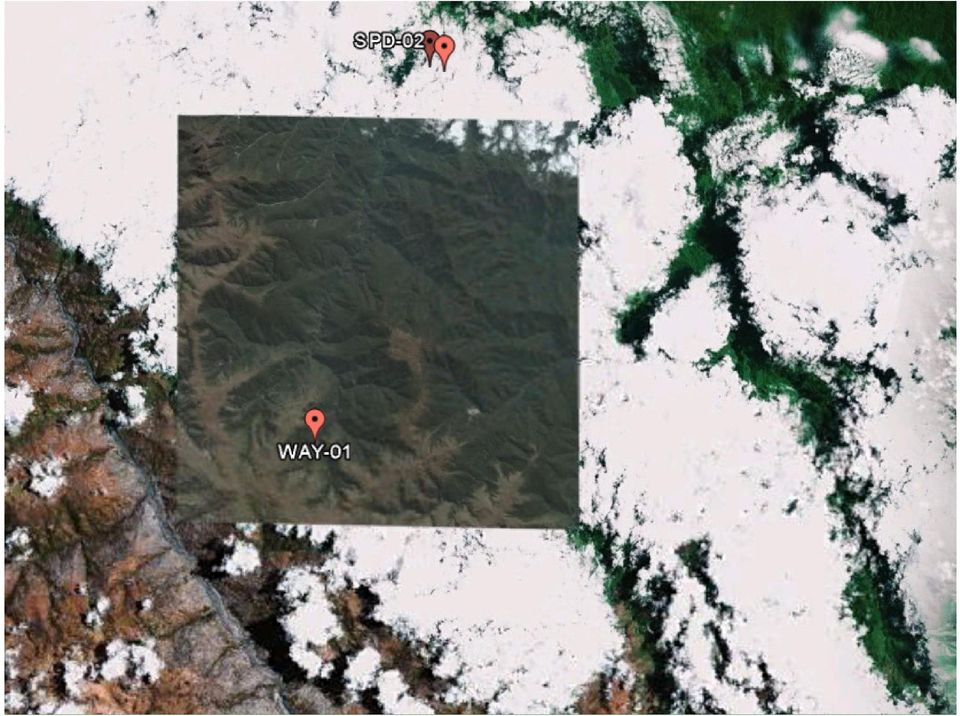
3 Most of my work concerns a transect of forest census plots in the Kosñipata Valley in SE Peru (Wayqecha - San Pedro - Tono). I am also using a pseudo-transect Tambopata - Manaus - Caxiuanã to compare with the lowland Amazon.

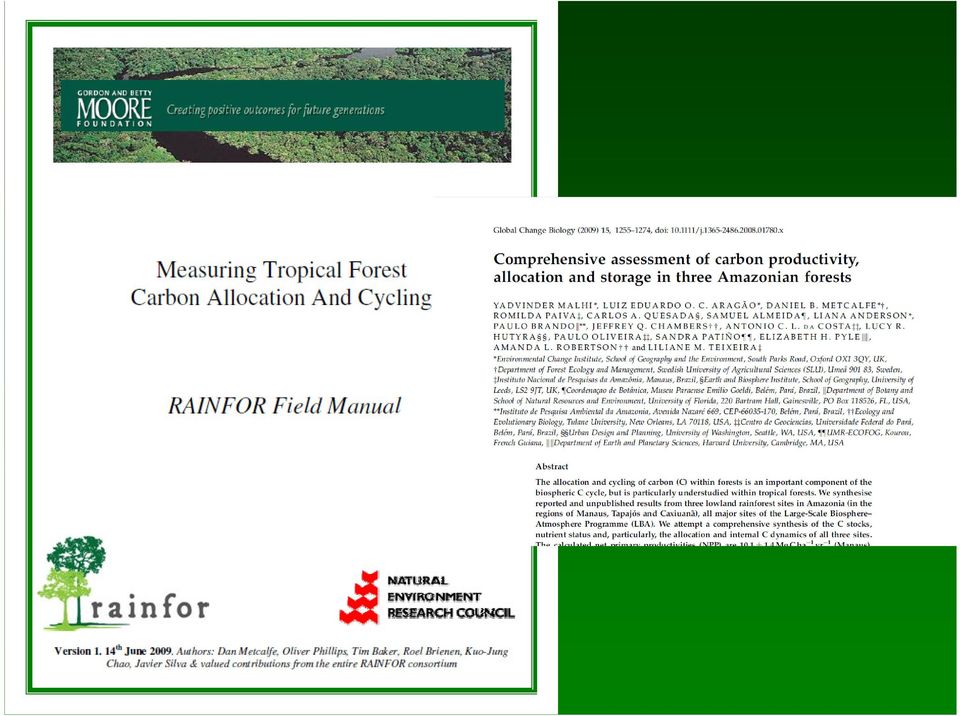
4 We are using the RAINFOR network coordinated by University of Leeds

5

6

7
8 Kosñipata Ridge 200m 1250m 1000m 1500m 1750m 2000m 2250m 2500m 2750m 3450m 3250m 3000m

9 Kosñipata Ridge: a natural ecosystem laboratory 26.4 o C 21 o C 22.1 o C 19 o C 16.7 o C 15.3 o C 14.8o C 13.3 o C 11.9 o C 8.5 o C 9.2 o C 10.5 o C

10 1 ha plots S, W Fire PUNA PUNA Plot 1 (3391m) Plot 2 (3205m) Plot 3 (3033m) Plot 4 (2745m) Plot 2 (3205m) Plot 3 (3033m) Plot 1 (3391m) Plot 4 (2745m) Plot 5 (2540m) Plot 6 (2290m) CLOUD MONTANE RAINFORESTS Plot 5 (2540m) Plot 6 (2290m) Plot 7 (2038m) Plot 7 (2038m) Plot 8 (1855m) Plot 7 (1855m) Plot 9 (210m) Plot 10 (194m) LOWLAND RAINFORESTS CLOUD FORESTS LOW MONTANE FORESTS SUBMONTANE FORESTS N 0 1km S, W Kosñipata Valley, SE Peru Source: Dr. Roman-Cuesta (2006)
 Plot 8 (1855m) Plot 7 (1855m) Plot 9 (210m) Plot 10 (194m) LOWLAND RAINFORESTS CLOUD FORESTS LOW MONTANE FORESTS")
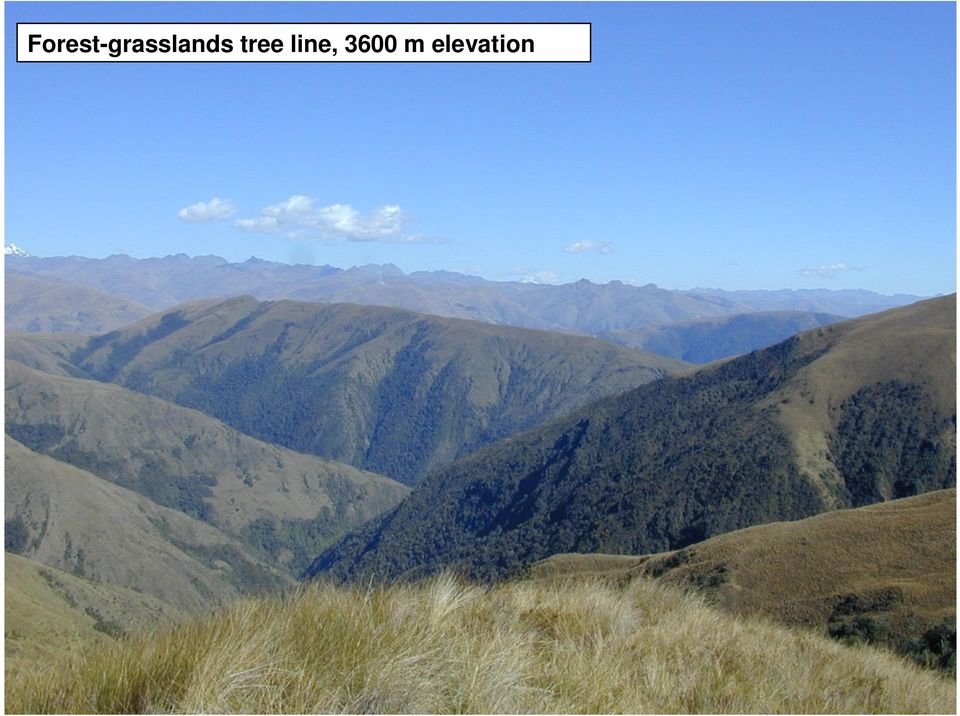
11 Forest-grasslands tree line, 3600 m elevation
12 Upper montane cloud forest, 3000 m elevation

13 Upper montane cloud forest, 2750 m elevation

14 Submontane forest, 1500 m elevation

15 Presumably, half a mountainside & several tree snags are busy heading along the Amazon from San Pedro to the Atlantic...

16

17 The Carbon Cycle of a Forest Source: Dr. Cécile Girardin

18 Above-ground biomass growth Canopy production 0.1 mm nylon mesh 0.5 m 0.5 m ~ 1 m Root production

19
20

21
22 Manaus lowland forest: 75 m asl GPP = 30.4 R Total = 29.3±4.7 R Aut = 19.8±4.6 R Het = 9.6±1.2 NPP Total = 10.1±1.4 NPP Ag = 7.3±1.3 NPP Bg = 2.8±0.7 NPP leaves,flowers,fruit = 3.6±0.7 NPP VOC = 0.13±0.06 R leaf = 10.0±4.0 NPP branch turnover = 1.0±1.0 R stem = 4.2±1.0 D Fine litterfall = 3.6±0.7 Predicted R soil = 12.6±2.3 Measured R soil = 12.1±1.7 R CWD = 2.5±0.3 NPP stem = 2.58±0.06 D CWD = 3.58±1.0 R roots = 5.6±2.0 R soil het. =7.1±1.1 NPP coarse roots = 0.8±0.2 NPP fine roots = 2.1±0.7 D Root = 2.8±0.7 ALL UNITS ARE t C / ha per year F doc = 0.19±0.07
23 Wayqecha cloud forest: 3025 m asl R Total = 15.7±2.0 R Aut = 9.8±1.7 R Het = 5.9±1.0 GPP estimated =16.2±2.5 GPP(canopy physiology) = 14 NPP Total = 5.2±0.7 NPP Ag = 3.6±0.5 NPP Bg = 1.6±0.4 NPP leaves,flowers,fruit =1.9±0.1 R leaf = 6.0±1.2 NPP branch turnover = 0.5±0.5 R stem = 1.1±0.2 D Fine litterfall =1.9±0.1 Predicted R soil = 9.2±1.9 Measured R soil = 11.6±0.1 R CWD = 0.6±0.2 NPP stem = 1.2±0.1 D CWD = 2.4±0.6 R roots = 3.9±1.6 R soil het. =5.3±1.1 NPP coarse roots = 0.4±0.1 NPP fine roots = 1.2±0.4 D Root = 1.6±0.4 ALL UNITS ARE t C / ha per year
24 NPP: Net Primary Productivity (NPP) in µmol CO2/m2s WAY SP TON TAM CAX MAN JULES v2.1.1 simulations with can_rad_mod=4: Solid line = 24 hr mean Broken lines = daytime & nighttime means Dotted lines = 24 hr min & max Points = Field measurements Grey band is an estimate from Clark et al. (2001, Ecol Appl) ON THE Y-AXIS 30 t C / ha per year is approx. 7.9 µmol C/m2 per sec flux Mean annual temperature in ºC Girardin et al. (in press GCB). Net primary productivity and its allocation along a tropical forest elevational transect in the Peruvian Andes. Marthews et al. (in prep). Carbon fluxes in six Amazonian and Andean forests: ecosystem productivity and carbon use efficiency.
25 GPP: Gross Primary Productivity (GPP) in µmol CO2/m2s WAY SP TON TAM CAX JULES v2.1.1 simulations with can_rad_mod=4: Solid line = 24 hr mean Broken lines = daytime & nighttime means Dotted lines = 24 hr min & max Points = Field measurements MAN Grey band is an estimate from Clark et al. (2001, Ecol Appl) and Piao et al.(2010, Ecology). ON THE Y-AXIS 30 t C / ha per year is approx. 7.9 µmol C/m2 per sec flux Mean annual temperature in ºC Girardin et al. (in press GCB). Net primary productivity and its allocation along a tropical forest elevational transect in the Peruvian Andes. Marthews et al. (in prep). Carbon fluxes in six Amazonian and Andean forests: ecosystem productivity and carbon use efficiency.
26 CUE = NPP/GPP (undefined at night when GPP=0): 0.8 JULES v2.1.1 simulations with can_rad_mod=4: Solid line = 24 hr mean Broken lines = daytime & nighttime means Dotted lines = 24 hr min & max Points = Field measurements Carbon use efficiency (CUE) WAY SP TON TAM CAX MAN Grey band is an estimate from Piao et al.(2010, Ecology) Mean annual temperature in ºC Girardin et al. (in press GCB). Net primary productivity and its allocation along a tropical forest elevational transect in the Peruvian Andes. Marthews et al. (in prep). Carbon fluxes in six Amazonian and Andean forests: ecosystem productivity and carbon use efficiency.
27 The Future: Scaling up to Regional Simulations (last slide!)
28 THANKS FOR LISTENING
Life Cycle Of A Plant Population
 Life Cycle Of A Plant Population Seed Rain n=3 Growth And Mortality n=7 Seedling Cohort n=22 Environmental Sieve Seed Bank n=5 Copyright G. Bonan 22 Suvivorship Of Seedlings In A Northern Hardwood Forest
Key Words Forest Ecosystem, Carbon Dynamics, Boreal Forests, Tropical Forests, Plots Network
 1 - i Global Environment Research Account for National Institutes Advancement of East Asia Forest Dynamics Plots Network -Monitoring forest carbon cycling for the development of climate change adaptation-(abstract
Estimating Central Amazon forest structure damage from fire using sub-pixel analysis
 Estimating Central Amazon forest structure damage from fire using sub-pixel analysis Angélica Faria de Resende 1 Bruce Walker Nelson 1 Danilo Roberti Alves de Almeida 1 1 Instituto Nacional de Pesquisas
4 GrowUp: A tool for computing forest Growth, nutrient Uptake and litterfall
 4 GrowUp: A tool for computing forest Growth, nutrient Uptake and litterfall L. Bonten, J.P. Mol-Dijkstra, R. Wiegger, G.J. Reinds Alterra (WUR), Wageningen, Netherlands Figure 4.1 gives an overview of
Seasonal & Daily Temperatures. Seasons & Sun's Distance. Solstice & Equinox. Seasons & Solar Intensity
 Seasonal & Daily Temperatures Seasons & Sun's Distance The role of Earth's tilt, revolution, & rotation in causing spatial, seasonal, & daily temperature variations Please read Chapter 3 in Ahrens Figure
Estimation of Carbon Stock in Indian Forests. Subhash Ashutosh Joint Director Forest Survey of India [email protected]
 Estimation of Carbon Stock in Indian Forests Subhash Ashutosh Joint Director Forest Survey of India [email protected] Salient Features of the Methodology most comprehensive assessment so far a GIS
CSS 560 Principles of Ecology for Environmental Educators
 CSS 560 Principles of Ecology for Environmental Educators Journaling task (15:00 min/each) Draw a diagram that shows the major components (boxes) and interactions (arrows) of a terrestrial ecosystem Conceptual
Tropical Tracks. Tropical rainforests are located along the Equator. Look at the map in the Biome. Draw the Equator on your map and label it.
 Tropical Tracks KS2 In Eden s Rainforest Biome you will discover how plants, animals and people of the Tropical Rainforest fit together. Let s Start! Look Point 1 (The Map, grid reference 175 482) Tropical
THE ECOSYSTEM - Biomes
 Biomes The Ecosystem - Biomes Side 2 THE ECOSYSTEM - Biomes By the end of this topic you should be able to:- SYLLABUS STATEMENT ASSESSMENT STATEMENT CHECK NOTES 2.4 BIOMES 2.4.1 Define the term biome.
Rainforest Concern Module 2 Why do we need rainforests?
 Rainforest Concern Module 2 Why do we need rainforests? Rainforest Concern Module 2: Why do we need Rainforest? Before we go any further, there are some words you may not understand, and these words and
Assessment of cork production in new Quercus suber plantations under future climate. Joana A Paulo Margarida Tomé João HN Palma
 Assessment of cork production in new Quercus suber plantations under future climate Joana A Paulo Margarida Tomé João HN Palma 22 May 2012 1 Introduction Climate is related to several variables that affect
Ranger Report About Deforestation of the Rainforest
 Ranger Report About Deforestation of the Rainforest About deforestation Forests are cut down for many reasons, but most of them are related to money or to people s need to provide for their families. The
Lidar Remote Sensing for Forestry Applications
 Lidar Remote Sensing for Forestry Applications Ralph O. Dubayah* and Jason B. Drake** Department of Geography, University of Maryland, College Park, MD 0 *[email protected] **[email protected] 1
Breakout Session Large stocks, larger uncertainties: The role of soils in North American carbon cycle
 Breakout Session Large stocks, larger uncertainties: The role of soils in North American carbon cycle Network of Intensive Carbon Monitoring Sites in Mexico: Challenges for soil organic carbon estimation
Urban Tree Planting Quantification Guidance
 Urban Tree Planting Quantification Guidance June 2014 This document provides guidance for quantifying an Urban Tree Planting (UTP) Project s carbon stocks, both for purposes of estimating a project s baseline
Mobilising Vegetation Plot Data: the National Vegetation Survey Databank. Susan Wiser April 2016 http://nvs.landcareresearch.co.nz
 Mobilising Vegetation Plot Data: the National Vegetation Survey Databank Susan Wiser April 2016 http://nvs.landcareresearch.co.nz Nationally Significant Databases and Collections http://natsigdc.landcareresearch.co.nz/natsigdc_list.html
Tropical Rainforest. Abiotic Factors Amount of Water, Sunlight, Soil, Precipitation
 World Biomes A biome is an area of land that shares similar temperatures and precipitation. The observation of the temperature and precipitation over a period time make up a biome s climate. Each biome
Agriculture, Fisheries and Conservation Department Conservation Branch. Nature Conservation Practice Note No. 02 Revised: June 2006
 Agriculture, Fisheries and Conservation Department Conservation Branch Nature Conservation Practice Note No. 02 Revised: June 2006 Ref: AF GR CON 21/2 Measurement of Diameter at Breast Height (DBH) 1.
MOVING FORWARD WITH LIDAR REMOTE SENSING: AIRBORNE ASSESSMENT OF FOREST CANOPY PARAMETERS
 MOVING FORWARD WITH LIDAR REMOTE SENSING: AIRBORNE ASSESSMENT OF FOREST CANOPY PARAMETERS Alicia M. Rutledge Sorin C. Popescu Spatial Sciences Laboratory Department of Forest Science Texas A&M University
National and Sub-national Carbon monitoring tools developed at the WHRC
 National and Sub-national Carbon monitoring tools developed at the WHRC Nadine Laporte Woods Hole Research Center A. Baccini, W. Walker, S. Goetz, M. Sun, J. Kellndorfer Kigali, 20 th June 2011 Why measuring
Key Idea 2: Ecosystems
 Key Idea 2: Ecosystems Ecosystems An ecosystem is a living community of plants and animals sharing an environment with non-living elements such as climate and soil. An example of a small scale ecosystem
Microclimate in the Outdoor Classroom
 Microclimate in the Outdoor Classroom 1. CONTRIBUTOR S NAME: TJ FONTAINE 2. NAME OF INQUIRY: MICROCLIMATE IN THE OUTDOOR CLASSROOM 3. GOALS AND OBJECTIVES: TEACH STUDENTS ABOUT THE SIMULARITIES AND DIFFERENCES
Physiography, Geography and Climate of Latin America (Lecture 3)
") Physiography, Geography and Climate of Latin America (Lecture 3) Natural Landmarks in Latin America World's longest and second highest mountain range, and the world's highest active volcanoes. Biggest
Physiography, Geography and Climate of Latin America (Lecture 3) Natural Landmarks in Latin America World's longest and second highest mountain range, and the world's highest active volcanoes. Biggest
Threats to tropical forests
 Threats to tropical forests and what we can do about it Ryszard Laskowski Institute of Environmental Sciences Jagiellonian University www.eko.uj.edu.pl/laskowski 1/22 Human activities: dangers and hopes
PROPOSED TERMS OF REFERENCE
 Annexure-IV PROPOSED TERMS OF REFERENCE 1.0 Proposed Scope of Work for EIA Study The components of the EIA study include: Detailed description of all elements of the project activities (existing and proposed
GEOGG142 GMES Calibration & validation of EO products
 GEOGG142 GMES Calibration & validation of EO products Dr. Mat Disney [email protected] Pearson Building room 113 020 7679 0592 www.geog.ucl.ac.uk/~mdisney Outline Calibration & validation Example:
Forest carbon sequestration and climate change. Dr Brian Tobin University College Dublin
 Forest carbon sequestration and climate change Dr Brian Tobin University College Dublin Overview Sequestration what is it & why important? Role of forests in climate change CARBiFOR research project Forest
Restoration of Fire-adapted Ecosystems in the Central and Southern Appalachians
 Restoration of Fire-adapted Ecosystems in the Central and Southern Appalachians Marek Smith The Nature Conservancy 12181-A Courthouse Hill Road Warm Springs, VA 24484 [email protected] Sam Lindblom The
14.330 SOIL MECHANICS Assignment #4: Soil Permeability.
 Geotechnical Engineering Research Laboratory One University Avenue Lowell, Massachusetts 01854 Edward L. Hajduk, D.Eng, PE Lecturer PA105D Tel: (978) 94 2621 Fax: (978) 94 052 e mail: [email protected]
Will climate changedisturbance. interactions perturb northern Rocky Mountain ecosystems past the point of no return?
 Photo: Craig Allen, USGS Will climate changedisturbance interactions perturb northern Rocky Mountain ecosystems past the point of no return? Rachel Loehman Research Landscape Ecologist USGS Alaska Science
Testing steady states carbon stocks of Yasso07 and ROMUL models against soil inventory data in Finland
 Testing steady states carbon stocks of Yasso07 and ROMUL models against soil inventory data in Finland A. Lehtonen 1, T. Linkosalo 2, J. Heikkinen 1, M. Peltoniemi 1, R. Sievänen 1, R. Mäkipää 1, P. Tamminen
Broken Arrow Public Schools AP Environmental Science Objectives Revised 11-19-08
 1 st six weeks 1 Identify questions and problems that can be answered through scientific investigation. 2 Design and conduct scientific investigations to answer questions about the world by creating hypotheses;
Arturo Sanchez-Azofeifa, PhD, PEng Cassidy Rankine, Gilberto Zonta-Pastorello Centre for Earth Observation Sciences (CEOS) Earth and Atmospheric
 Earth and Atmospheric") Arturo Sanchez-Azofeifa, PhD, PEng Cassidy Rankine, Gilberto Zonta-Pastorello Centre for Earth Observation Sciences (CEOS) Earth and Atmospheric Sciences Department University of Alberta Microsoft WSN
Arturo Sanchez-Azofeifa, PhD, PEng Cassidy Rankine, Gilberto Zonta-Pastorello Centre for Earth Observation Sciences (CEOS) Earth and Atmospheric Sciences Department University of Alberta Microsoft WSN
T.A. Tarasova, and C.A.Nobre
 SEASONAL VARIATIONS OF SURFACE SOLAR IRRADIANCES UNDER CLEAR-SKIES AND CLOUD COVER OBTAINED FROM LONG-TERM SOLAR RADIATION MEASUREMENTS IN THE RONDONIA REGION OF BRAZIL T.A. Tarasova, and C.A.Nobre Centro
Amherst County Public Schools. AP Environmental Science Curriculum Pacing Guide. College Board AP Environmental Science Site
 Amherst County Public Schools AP Environmental Science Curriculum Pacing Guide College Board AP Environmental Science Site REV: 8/12 1 st 9 weeks AP Objectives Energy Resources and Consumption A. Energy
Multi-scale upscaling approaches of soil properties from soil monitoring data
 local scale landscape scale forest stand/ site level (management unit) Multi-scale upscaling approaches of soil properties from soil monitoring data sampling plot level Motivation: The Need for Regionalization
Chapter 3 Communities, Biomes, and Ecosystems
 Communities, Biomes, and Ecosystems Section 1: Community Ecology Section 2: Terrestrial Biomes Section 3: Aquatic Ecosystems Click on a lesson name to select. 3.1 Community Ecology Communities A biological
Establishing ecologically sustainable forest biomass supply chains: A case study in the boreal forest of Canada
 Establishing ecologically sustainable forest biomass supply chains: A case study in the boreal forest of Canada Evelyne Thiffault Canadian Forest Service David Paré Canadian Forest Service Sylvain Volpé
Low / High Bay Datasheet
 Solid-State Lighting Series Low / High Bay Datasheet Low/high bay lighting is typically used in industrial applications. They have the same features as high bay lighting but with a different sized enclosed
Overview. Suggested Lesson Please see the Greenlinks Module description.
 Overview Plants interact with their environment in many ways that we cannot see. Children often enjoy learning about these hidden secrets of plant life. In this lesson, children will learn about role of
Let s SAR: Mapping and monitoring of land cover change with ALOS/ALOS-2 L-band data
 Let s SAR: Mapping and monitoring of land cover change with ALOS/ALOS-2 L-band data Rajesh Bahadur THAPA, Masanobu SHIMADA, Takeshi MOTOHKA, Manabu WATANABE and Shinichi [email protected]; [email protected]
TERMS OF REFERENCE FOR THE RAPID EIA STUDY
 TERMS OF REFERENCE FOR THE RAPID EIA STUDY 1 SUMMARY OF EIA METHODOLOGY STEP I : SCOPING OF THE ASSESSMENT Own with prevailing regulatory setting and criteria Identification of Environmental Assessment
Technology For Adaptation. Forestry Conservation Management. Dr. Javier Aliaga Lordemann
 Technology For Adaptation. Forestry Conservation Management Dr. Javier Aliaga Lordemann Forests has more carbon store than the currently carbon free atmosphere. By contrast, are important sources of emissions
REVIEW UNIT 10: ECOLOGY SAMPLE QUESTIONS
 Period Date REVIEW UNIT 10: ECOLOGY SAMPLE QUESTIONS A. Sample Multiple Choice Questions Complete the multiple choice questions to review this unit. 1. All of the following are density-dependent factors
- OJEWP/Panamá -Nanang Sujana/Indonesia - REPALEF/Congo
 1 Crédito fotografías: - OJEWP/Panamá -Nanang Sujana/Indonesia - REPALEF/Congo EFFECTIVE PARTICIPATION OF LOCAL PEOPLES AND COMMUNITIES: A CHALLENGE IN GLOBAL CLIMATE NEGOTIATIONS The presence and full
INTEGRATED NATIONAL ADAPTATION PILOT República de Colombia INAP
 INTEGRATED NATIONAL ADAPTATION PILOT INAP Ecosystem Based Adaptation High Mountain Ecosystems Angela Andrade Technical Coordinator INAP Klaus Schutze Páez Coordinator Comp B CLIMATE CHANGE IN COLOMBIA
Climate Futures Evaluation and Synthesis Tool
 Climate Futures Evaluation and Synthesis Tool September 2015 Alexander Epstein, Ben Rasmussen, and Chris Cutler The National Transportation Systems Center Advancing transportation innovation for the public
The Terms of reference (ToR) for conducting Rapid EIA study for the proposed project is described below:
 for conducting Rapid EIA study for the proposed project is described below:") Proposed Terms of Reference for EIA Study Objective: In order to identify the environmental impacts due to construction and operation of the proposed project and associated facilities, a study will be
Proposed Terms of Reference for EIA Study Objective: In order to identify the environmental impacts due to construction and operation of the proposed project and associated facilities, a study will be
Tropical Rainforests in the Pleistocene. Tropical Rainforests in the Pleistocene. Tropical Rainforests in the Pleistocene
 Tropical Rainforests in the Pleistocene tropics stable during Pleistocene? 1 C temperature drop based on 1976 CLIMAP study of warm vs. cold loving forams (vs. 10 C in North Atlantic) Paleothermometers
INTRODUCTION TO TAIWAN AND ENVIRONMENTAL EDUCATION LEARNING PROJECT IN THE US
 INTRODUCTION TO TAIWAN AND ENVIRONMENTAL EDUCATION LEARNING PROJECT IN THE US By I-Chun Lu International Fellow, Taiwan, World Forestry Institute Associate Researcher, Taiwan Forestry Research Institute
Vincent Constantin, CADFEM (Suisse) AG
 AG") Fast Titelmasterformat and reliable Bolt durch Assessment Klicken bearbeiten inside ANSYS Vincent Constantin, CADFEM (Suisse) AG Agenda Introduction VDI 2230 Bolt Assessment inside ANSYS Verification Examples
Fast Titelmasterformat and reliable Bolt durch Assessment Klicken bearbeiten inside ANSYS Vincent Constantin, CADFEM (Suisse) AG Agenda Introduction VDI 2230 Bolt Assessment inside ANSYS Verification Examples
Agroforestry and climate change. Emmanuel Torquebiau FAO webinar 5 February 2013
 Agroforestry and climate change Emmanuel Torquebiau FAO webinar 5 February 2013 Agroforestry: well-known buffering and resilience effects Climate variability is well buffered by agroforestry because of
RADIATION IN THE TROPICAL ATMOSPHERE and the SAHEL SURFACE HEAT BALANCE. Peter J. Lamb. Cooperative Institute for Mesoscale Meteorological Studies
 RADIATION IN THE TROPICAL ATMOSPHERE and the SAHEL SURFACE HEAT BALANCE by Peter J. Lamb Cooperative Institute for Mesoscale Meteorological Studies and School of Meteorology The University of Oklahoma
3.1 Measuring Biodiversity
 3.1 Measuring Biodiversity Every year, a news headline reads, New species discovered in. For example, in 2006, scientists discovered 36 new species of fish, corals, and shrimp in the warm ocean waters
Regents Biology LAB. STUDY OF POPULATION DENSITY ON A SUBURBAN LAWN
 Period Date LAB. STUDY OF POPULATION DENSITY ON A SUBURBAN LAWN Ecological communities are built on the interactions between the creatures (both plants and animals) that live there and the physical environment
Jeongho SEO, Kyeonghak LEE, Raehyun KIM Korea Forest Research Institute. 6~8. Sept. 2007 Kuala Lumpur, Malaysia
 5 th Workshop on GHG Inventory in Asia Jeongho SEO, Kyeonghak LEE, Raehyun KIM Korea Forest Research Institute 6~8. Sept. 2007 Kuala Lumpur, Malaysia Contents 1/ 32 Background 2/ 32 Land Use and Forestry
Ecosystem Responses to High-severity Wildfire
 Ecosystem Responses to High-severity Wildfire August 22, 2005 Final Report submitted by Steven Overby, RMRS, Flagstaff, AZ. Vegetation Analysis PI: John D. Bailey, Professor of Ecosystem Ecology, NAU Pre-treatment
SHAPING LAND-USE PRACTICES AND SUPPLY CHAINS THROUGH COMMODITY CERTIFICATION: THE EXPERIENCE OF THE RAINFOREST ALLIANCE
 SHAPING LAND-USE PRACTICES AND SUPPLY CHAINS THROUGH COMMODITY CERTIFICATION: THE EXPERIENCE OF THE RAINFOREST ALLIANCE Jeffrey Milder, Rainforest Alliance GEF/STAP Mainstreaming Biodiversity Workshop
A Model to Help You Determine Your
 A User-Friendly Model for Predicting Greenhouse Gas Fluxes and Carbon Sequestration Wetland s Carbon in Tidal Budget Wetlands A Model to Help You Determine Your Omar Abdul-Aziz, Ph.D., Assistant Professor
Coastwide Reference Monitoring System Wetlands (CRMS-Wetlands) Project Update
 Project Update") Coastwide Reference Monitoring System Wetlands (CRMS-Wetlands) Project Update Louisiana Department of Natural Resources Coastal Restoration Division U.S. Geological Survey National Wetlands Research Center
Coastwide Reference Monitoring System Wetlands (CRMS-Wetlands) Project Update Louisiana Department of Natural Resources Coastal Restoration Division U.S. Geological Survey National Wetlands Research Center
Naturalist Guide Carlos Chavarria
 Naturalist Guide Carlos Chavarria Carlos Roberto Chavarría has been working on conservation and community development based on the sustainable use of natural resources since 1984. He has a Forestry degree
Tropical rainforests grow in areas of high rainfall, they are found between the Tropic of Cancer and the Tropic of Capricorn.
 Tracking KS3 the Tropics In our Tropical Rainforest Biome you will discover how plants, animals and people of the Tropical Rainforest fit together. Let s Start! Look point 1 (Map on Left as you enter the
The Tropical Rainforest Rainforest Series, Part 1 - by Mikki Sadil
 Rainforest Series, Part 1 - Tropical rainforests are among the most mysterious of all geographical biomes in the world. A biome is an area with very distinctive plants and animals that have adapted to
Climate Change: A Local Focus on a Global Issue Newfoundland and Labrador Curriculum Links 2010-2011
 Climate Change: A Local Focus on a Global Issue Newfoundland and Labrador Curriculum Links 2010-2011 HEALTH Kindergarten: Grade 1: Grade 2: Know that litter can spoil the environment. Grade 3: Grade 4:
California Standards Grades 9 12 Boardworks 2009 Science Contents Standards Mapping
 California Standards Grades 912 Boardworks 2009 Science Contents Standards Mapping Earth Sciences Earth s Place in the Universe 1. Astronomy and planetary exploration reveal the solar system s structure,
6.4 Taigas and Tundras
 6.4 Taigas and Tundras In this section, you will learn about the largest and coldest biomes on Earth. The taiga is the largest land biome and the tundra is the coldest. The taiga The largest land biome
Communities, Biomes, and Ecosystems
 Communities, Biomes, and Ecosystems Before You Read Before you read the chapter, respond to these statements. 1. Write an A if you agree with the statement. 2. Write a D if you disagree with the statement.
defined largely by regional variations in climate
 1 Physical Environment: Climate and Biomes EVPP 110 Lecture Instructor: Dr. Largen Fall 2003 2 Climate and Biomes Ecosystem concept physical and biological components of environment are considered as single,
STATE UNIVERSITY OF NEW YORK COLLEGE OF TECHNOLOGY CANTON, NEW YORK COURSE OUTLINE ESCI 101 - INTRODUCTION TO ENVIRONMENTAL SCIENCE
 STATE UNIVERSITY OF NEW YORK COLLEGE OF TECHNOLOGY CANTON, NEW YORK COURSE OUTLINE ESCI 101 - INTRODUCTION TO ENVIRONMENTAL SCIENCE Prepared By: Rajiv Narula, Ph.D. SCHOOL OF SCIENCE, HEALTH, AND CRIMINAL
THE PLANT KINGDOM: THE WATER CYCLE
 THE PLANT KINGDOM: THE WATER CYCLE Material: The Water Cycle Nomenclature The Water cycle Model Water Ice Heat Source (lamp with a clamp) Tables Presentation 1: Key Experience 1. Say, Today we are going
Bayesian Modeling of Ecosystem Services in Human-Environment Systems
 Bayesian Modeling of in Human-Environment Systems Thomas Koellner1 and Adrienne Grêt-Regamey2 1Department of Environmental Sciences, Natural and Social Science Interface NSSI, ETH Zurich, Switzerland 2
Impacts of air pollution on human health, ecosystems and cultural heritage
 Impacts of air pollution on human health, ecosystems and cultural heritage Air pollution causes damage to human health, crops, ecosystems and cultural heritage The scientific data presented in this brochure
Burrowing Owl Distribution Modeling
 Burrowing Owl Distribution Modeling Scientific Name: Athene cunicularia Distribution Status: Migratory Summer Breeder State Rank: S3B Global Rank: G4 Inductive Modeling Model Created By: Joy Ritter Model
Impact of Warming on Outflows from Selected Upper Watersheds in California
 Impact of Warming on Outflows from Selected Upper Watersheds in California Guobiao Huang (CA DWR), Tariq Kadir (CA DWR) and Francis Chung (CA DWR) California Water and Environmental Modeling Forum Pacific
Report of the technical assessment of the proposed forest reference emission level of Brazil submitted in 2014
 United Nations FCCC/TAR/2014/BRA Distr.: General 1 December 2014 English only Report of the technical assessment of the proposed forest reference emission level of Brazil submitted in 2014 Summary This
High / Low Bay Datasheet
 Solid-State Lighting Series High / Low Bay Datasheet High / Low Bay lighting is typically used in industrial applications. They have the same features as high LED4 solution of light in low/high ceiling
Using Remote Sensing to Monitor Soil Carbon Sequestration
 Using Remote Sensing to Monitor Soil Carbon Sequestration E. Raymond Hunt, Jr. USDA-ARS Hydrology and Remote Sensing Beltsville Agricultural Research Center Beltsville, Maryland Introduction and Overview
Environmental Science
 Environmental Science UNIT I: Introduction to Environmental Science The student will demonstrate the ability to use scientific skills necessary to identify and analyze environmental issues. a. Define environmental
Cloud Masking and Cloud Products
 Cloud Masking and Cloud Products MODIS Operational Algorithm MOD35 Paul Menzel, Steve Ackerman, Richard Frey, Kathy Strabala, Chris Moeller, Liam Gumley, Bryan Baum MODIS Cloud Masking Often done with
Biodiversity and Ecosystem Services: Arguments for our Future Environment
 Biodiversity and Ecosystem Services: Arguments for our Future Environment How have we advanced our understanding of the links between biodiversity, ecosystem functions and ecosystem services? The issue
MONITORING OF FOREST PRODUCTIVITY, FUNCTIONALITY AND ECOSYSTEM SERVICES OF ITALIAN FORESTS. Prof. Marco Marchetti
 MONITORING OF FOREST PRODUCTIVITY, FUNCTIONALITY AND ECOSYSTEM SERVICES OF ITALIAN FORESTS Prof. Marco Marchetti and the spin off, CSIG srl www.ecogeofor.unimol.it Research topics: Forest and landscape
Opportunities for RIT in Ecuador. By Rubén Proaño Assistant Professor Industrial Engineering [email protected]
 Opportunities for RIT in Ecuador By Rubén Proaño Assistant Professor Industrial Engineering [email protected] Opportunities for RIT in Ecuador o Latitude 0 0' 0 Picture credits: None of these pictures are
Table A1. To assess functional connectivity of Pacific marten (Martes caurina) we identified three stand types of interest (open,
 we identified three stand types of interest (open,") Supplemental Online Appendix Table A1. To assess functional connectivity of Pacific marten (Martes caurina) we identified three stand types of interest (open, simple, complex) but divided these into subclasses
Supplemental Online Appendix Table A1. To assess functional connectivity of Pacific marten (Martes caurina) we identified three stand types of interest (open, simple, complex) but divided these into subclasses
Deforestation in the Amazon
 Deforestation in the Amazon By Rhett A Butler Rainforests once covered 14% of the earth's land surface; now they cover a mere 6% and experts estimate that the last remaining rainforests could be consumed