Analysis and Interpretation of Clinical Trials. How to conclude?
|
|
|
- Toby Pearson
- 7 years ago
- Views:
Transcription

1 Analysis and Interpretation of Clinical Trials How to conclude? Statistical Issues Dr Ferran Torres Unitat de Suport en Estadística i Metodología - USEM Statistics and Methodology Support Unit Hospital Clínic Barcelona Ferran.Torres@uab.es Barcelona, June 15, 2009

2 Documentation All the information will be available at the following link: Presentation in power point and pdf Additional documentation: Scientific recommendations Regulatory recommendations 2

3 Documentation 3

4 Outline Why statistics? Population and samples p value Statistical vs clinical significance Statistical errors (a and b) Sample size Estimation of treatment effect: Confidence Intervals 4
 Sample size Estimation of treatment")

5 Why Statistics? Variation!!!! 5


6 Variability 6

7 Why Statistics? Medicine is a quantitative science but not exact Not like physics or chemistry Variation characterises much of medicine Statistics is about handling and quantifying variation and uncertainty Humans differ in response to exposure to adverse effects Example: not every smoker dies of lung cancer some non-smokers die of lung cancer Humans differ in response to treatment Example: penicillin does not cure all infections Humans differ in disease symptoms Example: Sometimes cough and sometimes wheeze are presenting features for asthma 7

8 Why Statistics Are Necessary Statistics can tell us whether events could have happened by chance and to make decisions We need to use Statistics because of variability in our data Generalise: can what we know help to predict what will happen in new and different situations? 8

9 Memorable quotes 50% of what you learn about therapy in the next 5 years is wrong. (The trouble is we don t know which 50%) (Anon) in this world there is nothing certain but death and taxes. Benjamin Franklin ( ). (also said by Woody Allen) 86% of all statistics are invented on the spot (Huff How to Lie with Statistics) There are lies, damn lies, and statistics Benjamin Disraeli ( ) 9
 86% of all statistics are invented on the spot (Huff How to Lie with")
10 Error? unreliable reliable but not valid reliable & valid Classification of measurements 10

11 Random versus Systematic error Example: Systolic Blood Pressure (mm Hg) Random Systematic (Bias) True Value True Value

12 Random versus Systematic error Random Sample size Bias Sample size 12

13 Types of Statistics Descriptive Statistics enumerate, organise, summarise, and categorise graphical representation of data. these type of statistics describes the data. Examples means and frequency of outcomes charts and graphs 13

14 Types of Statistics Inferential Statistics drawing conclusions from incomplete information. they make predictions about a larger population given a smaller sample these are thought of as the statistical test Examples 95%CI, t-test, chi-square test, ANOVA, regression 14

15 Population and Samples Sample Population of the Study Target Population 15

16 Extrapolation Sample Study Results Inferential analysis Statistical Tests Confidence Intervals Population Conclusions 16

17 Statistical Inference Statistical Tests=> p-value Confidence Intervals 17 17

18 Valid samples? Population Likely to occur Invalid Sample and Conclusions Unlikely to occur 18

19 P-value The p-value is a tool to answer the question: Could the observed results have occurred by chance*? p <.05 statistically significant Remember: Decision given the observed results in a SAMPLE Extrapolating results to POPULATION *: accounts exclusively for the random error, not bias

20 RCT from a statistical point of view Treatment A Randomisation Treatment B (control) 1 homogeneous population 2 distinct populations 20 TITRE DE LA PRESENTATION (A MODIFIER SUR LE MASQUE)


21 RCT Sample Population 21
22 Statistical significance/confidence A>B p<0.05 means:? I can conclude that the higher values observed with treatment A vs treatment B are linked to the treatment rather to chance, with a risk of error of less than 5% 22 TITRE DE LA PRESENTATION (A MODIFIER SUR LE MASQUE)
23 Factors influencing statistical significance Signal Noise (background) Quantity Difference Variance (SD) Quantity of data 23 TITRE DE LA PRESENTATION (A MODIFIER SUR LE MASQUE)
24 P-value A very low p-value does NOT imply: Clinical relevance (NO!!!) Magnitude of the treatment effect (NO!!) With n or variability p Please never compare p-values!! (NO!!!) 24
25 Type I & II Error & Power Reality (Population) A=B A B Conclusion (sample) A=B p>0.05 A B p<0.05 OK Type I error (a) Type II error (b) OK 25
26 Type I & II Error & Power Type I Error (a) False positive Rejecting the null hypothesis when in fact it is true Standard: a=0.05 In words, chance of finding statistical significance when in fact there truly was no effect Type II Error (b) False negative Accepting the null hypothesis when in fact alternative is true Standard: b=0.20 or 0.10 In words, chance of not finding statistical significance when in fact there was an effect 26
27 Sample Size The planned number of participants is calculated on the basis of: Expected effect of treatment(s) Variability of the chosen endpoint Accepted risks in conclusion effect number variability number risk number 27
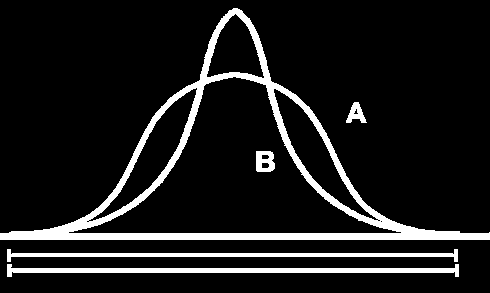
28 Frecuencia Frecuencia Frecuencia Sample Size The planned number of participants is calculated on the basis of: Expected effect of treatment(s) Variability of the chosen endpoint Accepted risks in conclusion effect number variability number risk number 300 ALTURA 300 ALTURA 120 ALTURA Desv. típ. = Media = N = Desv. típ. = Media = N = Desv. típ. = Media = N = ALTURA ALTURA ALTURA 28
29 Sample Size The planned number of participants is calculated on the basis of: Expected effect of treatment(s) Variability of the chosen endpoint Accepted risks in conclusion effect number variability number risk number A=B Reality (Population) A B Conclusion (sample) A=B p>0.05 A B p<0.05 OK Type I error (a) Type II error (b) POWER 29
30 95%CI Better than p-values use the data collected in the trial to give an estimate of the treatment effect size, together with a measure of how certain we are of our estimate CI is a range of values within which the true treatment effect is believed to be found, with a given level of confidence. 95% CI is a range of values within which the true treatment effect will lie 95% of the time Generally, 95% CI is calculated as Sample Estimate ± 1.96 x Standard Error 30
 Confidence limit (lower) Confidence limit")
31 Interval Estimation A probability that the population parameter falls somewhere within the interval Confidence interval Sample statistic (point estimate) Confidence limit (lower) Confidence limit (upper) 31
32 Superiority study Control better Test better IC95% d < 0 - effect d = 0 No differences d > 0 + effect 32
33 Lower equivalence boundary Upper equivalence boundary Statistically and Clinically superiority Statistical Superiority Non-inferiority Equivalence Inferiority <- Treatment less effective 0 Treatment-Control Treatment more effective -> 33
34 34
II. DISTRIBUTIONS distribution normal distribution. standard scores
 Appendix D Basic Measurement And Statistics The following information was developed by Steven Rothke, PhD, Department of Psychology, Rehabilitation Institute of Chicago (RIC) and expanded by Mary F. Schmidt,
Descriptive Statistics
 Descriptive Statistics Primer Descriptive statistics Central tendency Variation Relative position Relationships Calculating descriptive statistics Descriptive Statistics Purpose to describe or summarize
HYPOTHESIS TESTING (ONE SAMPLE) - CHAPTER 7 1. used confidence intervals to answer questions such as...
 - CHAPTER 7 1. used confidence intervals to answer questions such as...") HYPOTHESIS TESTING (ONE SAMPLE) - CHAPTER 7 1 PREVIOUSLY used confidence intervals to answer questions such as... You know that 0.25% of women have red/green color blindness. You conduct a study of men
HYPOTHESIS TESTING (ONE SAMPLE) - CHAPTER 7 1 PREVIOUSLY used confidence intervals to answer questions such as... You know that 0.25% of women have red/green color blindness. You conduct a study of men
Projects Involving Statistics (& SPSS)
") Projects Involving Statistics (& SPSS) Academic Skills Advice Starting a project which involves using statistics can feel confusing as there seems to be many different things you can do (charts, graphs,
Projects Involving Statistics (& SPSS) Academic Skills Advice Starting a project which involves using statistics can feel confusing as there seems to be many different things you can do (charts, graphs,
Chapter 7 Notes - Inference for Single Samples. You know already for a large sample, you can invoke the CLT so:
 Chapter 7 Notes - Inference for Single Samples You know already for a large sample, you can invoke the CLT so: X N(µ, ). Also for a large sample, you can replace an unknown σ by s. You know how to do a
 There are three kinds of people in the world those who are good at math and those who are not. PSY 511: Advanced Statistics for Psychological and Behavioral Research 1 Positive Views The record of a month
MULTIPLE REGRESSION AND ISSUES IN REGRESSION ANALYSIS
 MULTIPLE REGRESSION AND ISSUES IN REGRESSION ANALYSIS MSR = Mean Regression Sum of Squares MSE = Mean Squared Error RSS = Regression Sum of Squares SSE = Sum of Squared Errors/Residuals α = Level of Significance
HYPOTHESIS TESTING (ONE SAMPLE) - CHAPTER 7 1. used confidence intervals to answer questions such as...
 - CHAPTER 7 1. used confidence intervals to answer questions such as...") HYPOTHESIS TESTING (ONE SAMPLE) - CHAPTER 7 1 PREVIOUSLY used confidence intervals to answer questions such as... You know that 0.25% of women have red/green color blindness. You conduct a study of men
HYPOTHESIS TESTING (ONE SAMPLE) - CHAPTER 7 1 PREVIOUSLY used confidence intervals to answer questions such as... You know that 0.25% of women have red/green color blindness. You conduct a study of men
Basic research methods. Basic research methods. Question: BRM.2. Question: BRM.1
 BRM.1 The proportion of individuals with a particular disease who die from that condition is called... BRM.2 This study design examines factors that may contribute to a condition by comparing subjects
Inclusion and Exclusion Criteria
 Inclusion and Exclusion Criteria Inclusion criteria = attributes of subjects that are essential for their selection to participate. Inclusion criteria function remove the influence of specific confounding
Correlational Research
 Correlational Research Chapter Fifteen Correlational Research Chapter Fifteen Bring folder of readings The Nature of Correlational Research Correlational Research is also known as Associational Research.
SAMPLING & INFERENTIAL STATISTICS. Sampling is necessary to make inferences about a population.
 SAMPLING & INFERENTIAL STATISTICS Sampling is necessary to make inferences about a population. SAMPLING The group that you observe or collect data from is the sample. The group that you make generalizations
Sample Size and Power in Clinical Trials
 Sample Size and Power in Clinical Trials Version 1.0 May 011 1. Power of a Test. Factors affecting Power 3. Required Sample Size RELATED ISSUES 1. Effect Size. Test Statistics 3. Variation 4. Significance
This clinical study synopsis is provided in line with Boehringer Ingelheim s Policy on Transparency and Publication of Clinical Study Data.
 abcd Clinical Study for Public Disclosure This clinical study synopsis is provided in line with s Policy on Transparency and Publication of Clinical Study Data. The synopsis which is part of the clinical
HYPOTHESIS TESTING WITH SPSS:
 HYPOTHESIS TESTING WITH SPSS: A NON-STATISTICIAN S GUIDE & TUTORIAL by Dr. Jim Mirabella SPSS 14.0 screenshots reprinted with permission from SPSS Inc. Published June 2006 Copyright Dr. Jim Mirabella CHAPTER
Sample Size Planning, Calculation, and Justification
 Sample Size Planning, Calculation, and Justification Theresa A Scott, MS Vanderbilt University Department of Biostatistics theresa.scott@vanderbilt.edu http://biostat.mc.vanderbilt.edu/theresascott Theresa
Principles of Hypothesis Testing for Public Health
 Principles of Hypothesis Testing for Public Health Laura Lee Johnson, Ph.D. Statistician National Center for Complementary and Alternative Medicine johnslau@mail.nih.gov Fall 2011 Answers to Questions
Fairfield Public Schools
 Mathematics Fairfield Public Schools AP Statistics AP Statistics BOE Approved 04/08/2014 1 AP STATISTICS Critical Areas of Focus AP Statistics is a rigorous course that offers advanced students an opportunity
SECOND M.B. AND SECOND VETERINARY M.B. EXAMINATIONS INTRODUCTION TO THE SCIENTIFIC BASIS OF MEDICINE EXAMINATION. Friday 14 March 2008 9.00-9.
 SECOND M.B. AND SECOND VETERINARY M.B. EXAMINATIONS INTRODUCTION TO THE SCIENTIFIC BASIS OF MEDICINE EXAMINATION Friday 14 March 2008 9.00-9.45 am Attempt all ten questions. For each question, choose the
Unit 31 A Hypothesis Test about Correlation and Slope in a Simple Linear Regression
 Unit 31 A Hypothesis Test about Correlation and Slope in a Simple Linear Regression Objectives: To perform a hypothesis test concerning the slope of a least squares line To recognize that testing for a
Online 12 - Sections 9.1 and 9.2-Doug Ensley
 Student: Date: Instructor: Doug Ensley Course: MAT117 01 Applied Statistics - Ensley Assignment: Online 12 - Sections 9.1 and 9.2 1. Does a P-value of 0.001 give strong evidence or not especially strong
Consider a study in which. How many subjects? The importance of sample size calculations. An insignificant effect: two possibilities.
 Consider a study in which How many subjects? The importance of sample size calculations Office of Research Protections Brown Bag Series KB Boomer, Ph.D. Director, boomer@stat.psu.edu A researcher conducts
"Statistical methods are objective methods by which group trends are abstracted from observations on many separate individuals." 1
 BASIC STATISTICAL THEORY / 3 CHAPTER ONE BASIC STATISTICAL THEORY "Statistical methods are objective methods by which group trends are abstracted from observations on many separate individuals." 1 Medicine
Examining Differences (Comparing Groups) using SPSS Inferential statistics (Part I) Dwayne Devonish
 using SPSS Inferential statistics (Part I) Dwayne Devonish") Examining Differences (Comparing Groups) using SPSS Inferential statistics (Part I) Dwayne Devonish Statistics Statistics are quantitative methods of describing, analysing, and drawing inferences (conclusions)
Examining Differences (Comparing Groups) using SPSS Inferential statistics (Part I) Dwayne Devonish Statistics Statistics are quantitative methods of describing, analysing, and drawing inferences (conclusions)
CONTENTS OF DAY 2. II. Why Random Sampling is Important 9 A myth, an urban legend, and the real reason NOTES FOR SUMMER STATISTICS INSTITUTE COURSE
 1 2 CONTENTS OF DAY 2 I. More Precise Definition of Simple Random Sample 3 Connection with independent random variables 3 Problems with small populations 8 II. Why Random Sampling is Important 9 A myth,
Non-Inferiority Tests for Two Means using Differences
 Chapter 450 on-inferiority Tests for Two Means using Differences Introduction This procedure computes power and sample size for non-inferiority tests in two-sample designs in which the outcome is a continuous
Biostatistics: Types of Data Analysis
 Biostatistics: Types of Data Analysis Theresa A Scott, MS Vanderbilt University Department of Biostatistics theresa.scott@vanderbilt.edu http://biostat.mc.vanderbilt.edu/theresascott Theresa A Scott, MS
Statistik for MPH: 2. 10. september 2015. www.biostat.ku.dk/~pka/mph15. Risiko, relativ risiko, signifikanstest (Silva: 110-133.) Per Kragh Andersen
 Per Kragh Andersen") Statistik for MPH: 2 10. september 2015 www.biostat.ku.dk/~pka/mph15 Risiko, relativ risiko, signifikanstest (Silva: 110-133.) Per Kragh Andersen 1 Fra den. 1 uges statistikundervisning: skulle jeg gerne
Statistik for MPH: 2 10. september 2015 www.biostat.ku.dk/~pka/mph15 Risiko, relativ risiko, signifikanstest (Silva: 110-133.) Per Kragh Andersen 1 Fra den. 1 uges statistikundervisning: skulle jeg gerne
Lesson 1: Comparison of Population Means Part c: Comparison of Two- Means
 Lesson : Comparison of Population Means Part c: Comparison of Two- Means Welcome to lesson c. This third lesson of lesson will discuss hypothesis testing for two independent means. Steps in Hypothesis
Introduction to Statistics and Quantitative Research Methods
 Introduction to Statistics and Quantitative Research Methods Purpose of Presentation To aid in the understanding of basic statistics, including terminology, common terms, and common statistical methods.
Introduction to Quantitative Methods
 Introduction to Quantitative Methods October 15, 2009 Contents 1 Definition of Key Terms 2 2 Descriptive Statistics 3 2.1 Frequency Tables......................... 4 2.2 Measures of Central Tendencies.................
Class 19: Two Way Tables, Conditional Distributions, Chi-Square (Text: Sections 2.5; 9.1)
") Spring 204 Class 9: Two Way Tables, Conditional Distributions, Chi-Square (Text: Sections 2.5; 9.) Big Picture: More than Two Samples In Chapter 7: We looked at quantitative variables and compared the
Spring 204 Class 9: Two Way Tables, Conditional Distributions, Chi-Square (Text: Sections 2.5; 9.) Big Picture: More than Two Samples In Chapter 7: We looked at quantitative variables and compared the
2013 MBA Jump Start Program. Statistics Module Part 3
 2013 MBA Jump Start Program Module 1: Statistics Thomas Gilbert Part 3 Statistics Module Part 3 Hypothesis Testing (Inference) Regressions 2 1 Making an Investment Decision A researcher in your firm just
Statistics in Medicine Research Lecture Series CSMC Fall 2014
 Catherine Bresee, MS Senior Biostatistician Biostatistics & Bioinformatics Research Institute Statistics in Medicine Research Lecture Series CSMC Fall 2014 Overview Review concept of statistical power
Introduction. Hypothesis Testing. Hypothesis Testing. Significance Testing
 Introduction Hypothesis Testing Mark Lunt Arthritis Research UK Centre for Ecellence in Epidemiology University of Manchester 13/10/2015 We saw last week that we can never know the population parameters
" Y. Notation and Equations for Regression Lecture 11/4. Notation:
 Notation: Notation and Equations for Regression Lecture 11/4 m: The number of predictor variables in a regression Xi: One of multiple predictor variables. The subscript i represents any number from 1 through
Section 13, Part 1 ANOVA. Analysis Of Variance
 Section 13, Part 1 ANOVA Analysis Of Variance Course Overview So far in this course we ve covered: Descriptive statistics Summary statistics Tables and Graphs Probability Probability Rules Probability
Simple Linear Regression Inference
 Simple Linear Regression Inference 1 Inference requirements The Normality assumption of the stochastic term e is needed for inference even if it is not a OLS requirement. Therefore we have: Interpretation
X X X a) perfect linear correlation b) no correlation c) positive correlation (r = 1) (r = 0) (0 < r < 1)
 perfect linear correlation b) no correlation c) positive correlation (r = 1) (r = 0) (0 < r < 1)") CORRELATION AND REGRESSION / 47 CHAPTER EIGHT CORRELATION AND REGRESSION Correlation and regression are statistical methods that are commonly used in the medical literature to compare two or more variables.
CORRELATION AND REGRESSION / 47 CHAPTER EIGHT CORRELATION AND REGRESSION Correlation and regression are statistical methods that are commonly used in the medical literature to compare two or more variables.
COMPARISONS OF CUSTOMER LOYALTY: PUBLIC & PRIVATE INSURANCE COMPANIES.
 277 CHAPTER VI COMPARISONS OF CUSTOMER LOYALTY: PUBLIC & PRIVATE INSURANCE COMPANIES. This chapter contains a full discussion of customer loyalty comparisons between private and public insurance companies
Week 4: Standard Error and Confidence Intervals
 Health Sciences M.Sc. Programme Applied Biostatistics Week 4: Standard Error and Confidence Intervals Sampling Most research data come from subjects we think of as samples drawn from a larger population.
C. The null hypothesis is not rejected when the alternative hypothesis is true. A. population parameters.
 Sample Multiple Choice Questions for the material since Midterm 2. Sample questions from Midterms and 2 are also representative of questions that may appear on the final exam.. A randomly selected sample
Hypothesis testing. c 2014, Jeffrey S. Simonoff 1
 Hypothesis testing So far, we ve talked about inference from the point of estimation. We ve tried to answer questions like What is a good estimate for a typical value? or How much variability is there
Statistics Review PSY379
 Statistics Review PSY379 Basic concepts Measurement scales Populations vs. samples Continuous vs. discrete variable Independent vs. dependent variable Descriptive vs. inferential stats Common analyses
Parametric and non-parametric statistical methods for the life sciences - Session I
 Why nonparametric methods What test to use? Rank Tests Parametric and non-parametric statistical methods for the life sciences - Session I Liesbeth Bruckers Geert Molenberghs Interuniversity Institute
1. What is the critical value for this 95% confidence interval? CV = z.025 = invnorm(0.025) = 1.96
 = 1.96") 1 Final Review 2 Review 2.1 CI 1-propZint Scenario 1 A TV manufacturer claims in its warranty brochure that in the past not more than 10 percent of its TV sets needed any repair during the first two years
1 Final Review 2 Review 2.1 CI 1-propZint Scenario 1 A TV manufacturer claims in its warranty brochure that in the past not more than 10 percent of its TV sets needed any repair during the first two years
2 Precision-based sample size calculations
 Statistics: An introduction to sample size calculations Rosie Cornish. 2006. 1 Introduction One crucial aspect of study design is deciding how big your sample should be. If you increase your sample size
DATA INTERPRETATION AND STATISTICS
 PholC60 September 001 DATA INTERPRETATION AND STATISTICS Books A easy and systematic introductory text is Essentials of Medical Statistics by Betty Kirkwood, published by Blackwell at about 14. DESCRIPTIVE
In the general population of 0 to 4-year-olds, the annual incidence of asthma is 1.4%
 Hypothesis Testing for a Proportion Example: We are interested in the probability of developing asthma over a given one-year period for children 0 to 4 years of age whose mothers smoke in the home In the
Two-sample inference: Continuous data
 Two-sample inference: Continuous data Patrick Breheny April 5 Patrick Breheny STA 580: Biostatistics I 1/32 Introduction Our next two lectures will deal with two-sample inference for continuous data As
Non-inferiority studies: non-sense or sense?
 Non-inferiority studies: non-sense or sense? Prof. Emmanuel Lesaffre Department of Biostatistics, Erasmus MC, Rotterdam, the Netherlands L-Biostat, K.U.Leuven, Leuven, Belgium 1 2 3 1. Review of study
Chi Squared and Fisher's Exact Tests. Observed vs Expected Distributions
 BMS 617 Statistical Techniques for the Biomedical Sciences Lecture 11: Chi-Squared and Fisher's Exact Tests Chi Squared and Fisher's Exact Tests This lecture presents two similarly structured tests, Chi-squared
Lecture Notes Module 1
 Lecture Notes Module 1 Study Populations A study population is a clearly defined collection of people, animals, plants, or objects. In psychological research, a study population usually consists of a specific
ABSORBENCY OF PAPER TOWELS
 ABSORBENCY OF PAPER TOWELS 15. Brief Version of the Case Study 15.1 Problem Formulation 15.2 Selection of Factors 15.3 Obtaining Random Samples of Paper Towels 15.4 How will the Absorbency be measured?
Independent t- Test (Comparing Two Means)
") Independent t- Test (Comparing Two Means) The objectives of this lesson are to learn: the definition/purpose of independent t-test when to use the independent t-test the use of SPSS to complete an independent
Independent t- Test (Comparing Two Means) The objectives of this lesson are to learn: the definition/purpose of independent t-test when to use the independent t-test the use of SPSS to complete an independent
Using Excel for inferential statistics
 FACT SHEET Using Excel for inferential statistics Introduction When you collect data, you expect a certain amount of variation, just caused by chance. A wide variety of statistical tests can be applied
Study Guide for the Final Exam
 Study Guide for the Final Exam When studying, remember that the computational portion of the exam will only involve new material (covered after the second midterm), that material from Exam 1 will make
Chi-square test Fisher s Exact test
 Lesson 1 Chi-square test Fisher s Exact test McNemar s Test Lesson 1 Overview Lesson 11 covered two inference methods for categorical data from groups Confidence Intervals for the difference of two proportions
Testing Hypotheses About Proportions
 Chapter 11 Testing Hypotheses About Proportions Hypothesis testing method: uses data from a sample to judge whether or not a statement about a population may be true. Steps in Any Hypothesis Test 1. Determine
Statistics for the intensivist (3) ICU Fellowship Training Radboudumc
 ICU Fellowship Training Radboudumc") Statistics for the intensivist (3) ICU Fellowship Training Radboudumc Comparison of means Single observed mean with hypothesized value Two means arising from paired data Two means from unpaired data Confidence
Statistics for the intensivist (3) ICU Fellowship Training Radboudumc Comparison of means Single observed mean with hypothesized value Two means arising from paired data Two means from unpaired data Confidence
Data Quality Assessment: A Reviewer s Guide EPA QA/G-9R
 United States Office of Environmental EPA/240/B-06/002 Environmental Protection Information Agency Washington, DC 20460 Data Quality Assessment: A Reviewer s Guide EPA QA/G-9R FOREWORD This document is
Summary of Formulas and Concepts. Descriptive Statistics (Ch. 1-4)
") Summary of Formulas and Concepts Descriptive Statistics (Ch. 1-4) Definitions Population: The complete set of numerical information on a particular quantity in which an investigator is interested. We assume
Summary of Formulas and Concepts Descriptive Statistics (Ch. 1-4) Definitions Population: The complete set of numerical information on a particular quantity in which an investigator is interested. We assume
How To Test For Significance On A Data Set
 Non-Parametric Univariate Tests: 1 Sample Sign Test 1 1 SAMPLE SIGN TEST A non-parametric equivalent of the 1 SAMPLE T-TEST. ASSUMPTIONS: Data is non-normally distributed, even after log transforming.
Personalized Predictive Medicine and Genomic Clinical Trials
 Personalized Predictive Medicine and Genomic Clinical Trials Richard Simon, D.Sc. Chief, Biometric Research Branch National Cancer Institute http://brb.nci.nih.gov brb.nci.nih.gov Powerpoint presentations
Introduction to Hypothesis Testing. Hypothesis Testing. Step 1: State the Hypotheses
 Introduction to Hypothesis Testing 1 Hypothesis Testing A hypothesis test is a statistical procedure that uses sample data to evaluate a hypothesis about a population Hypothesis is stated in terms of the
 T O P I C 1 2 Techniques and tools for data analysis Preview Introduction In chapter 3 of Statistics In A Day different combinations of numbers and types of variables are presented. We go through these
MULTIPLE CHOICE. Choose the one alternative that best completes the statement or answers the question.
 Sample Practice problems - chapter 12-1 and 2 proportions for inference - Z Distributions Name MULTIPLE CHOICE. Choose the one alternative that best completes the statement or answers the question. Provide
Data Analysis, Research Study Design and the IRB
 Minding the p-values p and Quartiles: Data Analysis, Research Study Design and the IRB Don Allensworth-Davies, MSc Research Manager, Data Coordinating Center Boston University School of Public Health IRB
Hypothesis testing - Steps
 Hypothesis testing - Steps Steps to do a two-tailed test of the hypothesis that β 1 0: 1. Set up the hypotheses: H 0 : β 1 = 0 H a : β 1 0. 2. Compute the test statistic: t = b 1 0 Std. error of b 1 =
Statistics for Sports Medicine
 Statistics for Sports Medicine Suzanne Hecht, MD University of Minnesota (suzanne.hecht@gmail.com) Fellow s Research Conference July 2012: Philadelphia GOALS Try not to bore you to death!! Try to teach
Two Related Samples t Test
 Two Related Samples t Test In this example 1 students saw five pictures of attractive people and five pictures of unattractive people. For each picture, the students rated the friendliness of the person
Minitab Tutorials for Design and Analysis of Experiments. Table of Contents
 Table of Contents Introduction to Minitab...2 Example 1 One-Way ANOVA...3 Determining Sample Size in One-way ANOVA...8 Example 2 Two-factor Factorial Design...9 Example 3: Randomized Complete Block Design...14
Critical appraisal. Gary Collins. EQUATOR Network, Centre for Statistics in Medicine NDORMS, University of Oxford
 Critical appraisal Gary Collins EQUATOR Network, Centre for Statistics in Medicine NDORMS, University of Oxford EQUATOR Network OUCAGS training course 25 October 2014 Objectives of this session To understand
Two-sample hypothesis testing, II 9.07 3/16/2004
 Two-sample hypothesis testing, II 9.07 3/16/004 Small sample tests for the difference between two independent means For two-sample tests of the difference in mean, things get a little confusing, here,
12: Analysis of Variance. Introduction
 1: Analysis of Variance Introduction EDA Hypothesis Test Introduction In Chapter 8 and again in Chapter 11 we compared means from two independent groups. In this chapter we extend the procedure to consider
ANOVA ANOVA. Two-Way ANOVA. One-Way ANOVA. When to use ANOVA ANOVA. Analysis of Variance. Chapter 16. A procedure for comparing more than two groups
 ANOVA ANOVA Analysis of Variance Chapter 6 A procedure for comparing more than two groups independent variable: smoking status non-smoking one pack a day > two packs a day dependent variable: number of
QUANTITATIVE METHODS BIOLOGY FINAL HONOUR SCHOOL NON-PARAMETRIC TESTS
 QUANTITATIVE METHODS BIOLOGY FINAL HONOUR SCHOOL NON-PARAMETRIC TESTS This booklet contains lecture notes for the nonparametric work in the QM course. This booklet may be online at http://users.ox.ac.uk/~grafen/qmnotes/index.html.
Types of Studies. Systematic Reviews and Meta-Analyses
 Types of Studies Systematic Reviews and Meta-Analyses Important medical questions are typically studied more than once, often by different research teams in different locations. A systematic review is
Introduction to. Hypothesis Testing CHAPTER LEARNING OBJECTIVES. 1 Identify the four steps of hypothesis testing.
 Introduction to Hypothesis Testing CHAPTER 8 LEARNING OBJECTIVES After reading this chapter, you should be able to: 1 Identify the four steps of hypothesis testing. 2 Define null hypothesis, alternative
2 Sample t-test (unequal sample sizes and unequal variances)
") Variations of the t-test: Sample tail Sample t-test (unequal sample sizes and unequal variances) Like the last example, below we have ceramic sherd thickness measurements (in cm) of two samples representing
Variations of the t-test: Sample tail Sample t-test (unequal sample sizes and unequal variances) Like the last example, below we have ceramic sherd thickness measurements (in cm) of two samples representing
Introduction to Regression and Data Analysis
 Statlab Workshop Introduction to Regression and Data Analysis with Dan Campbell and Sherlock Campbell October 28, 2008 I. The basics A. Types of variables Your variables may take several forms, and it
A Statistical Analysis of Popular Lottery Winning Strategies
 CS-BIGS 4(1): 66-72 2010 CS-BIGS http://www.bentley.edu/csbigs/vol4-1/chen.pdf A Statistical Analysis of Popular Lottery Winning Strategies Albert C. Chen Torrey Pines High School, USA Y. Helio Yang San
Tutorial 5: Hypothesis Testing
 Tutorial 5: Hypothesis Testing Rob Nicholls nicholls@mrc-lmb.cam.ac.uk MRC LMB Statistics Course 2014 Contents 1 Introduction................................ 1 2 Testing distributional assumptions....................
How To Check For Differences In The One Way Anova
 MINITAB ASSISTANT WHITE PAPER This paper explains the research conducted by Minitab statisticians to develop the methods and data checks used in the Assistant in Minitab 17 Statistical Software. One-Way
MULTIPLE CHOICE. Choose the one alternative that best completes the statement or answers the question.
 STT315 Practice Ch 5-7 MULTIPLE CHOICE. Choose the one alternative that best completes the statement or answers the question. Solve the problem. 1) The length of time a traffic signal stays green (nicknamed
Data Mining Techniques Chapter 5: The Lure of Statistics: Data Mining Using Familiar Tools
 Data Mining Techniques Chapter 5: The Lure of Statistics: Data Mining Using Familiar Tools Occam s razor.......................................................... 2 A look at data I.........................................................
Statistical Rules of Thumb
 Statistical Rules of Thumb Second Edition Gerald van Belle University of Washington Department of Biostatistics and Department of Environmental and Occupational Health Sciences Seattle, WA WILEY AJOHN
NONPARAMETRIC STATISTICS 1. depend on assumptions about the underlying distribution of the data (or on the Central Limit Theorem)
") NONPARAMETRIC STATISTICS 1 PREVIOUSLY parametric statistics in estimation and hypothesis testing... construction of confidence intervals computing of p-values classical significance testing depend on assumptions
NONPARAMETRIC STATISTICS 1 PREVIOUSLY parametric statistics in estimation and hypothesis testing... construction of confidence intervals computing of p-values classical significance testing depend on assumptions
Content Sheet 7-1: Overview of Quality Control for Quantitative Tests
 Content Sheet 7-1: Overview of Quality Control for Quantitative Tests Role in quality management system Quality Control (QC) is a component of process control, and is a major element of the quality management
General Method: Difference of Means. 3. Calculate df: either Welch-Satterthwaite formula or simpler df = min(n 1, n 2 ) 1.
 1.") General Method: Difference of Means 1. Calculate x 1, x 2, SE 1, SE 2. 2. Combined SE = SE1 2 + SE2 2. ASSUMES INDEPENDENT SAMPLES. 3. Calculate df: either Welch-Satterthwaite formula or simpler df = min(n
General Method: Difference of Means 1. Calculate x 1, x 2, SE 1, SE 2. 2. Combined SE = SE1 2 + SE2 2. ASSUMES INDEPENDENT SAMPLES. 3. Calculate df: either Welch-Satterthwaite formula or simpler df = min(n
Can I have FAITH in this Review?
 Can I have FAITH in this Review? Find Appraise Include Total Heterogeneity Paul Glasziou Centre for Research in Evidence Based Practice Bond University What do you do? For an acutely ill patient, you do
MBA 611 STATISTICS AND QUANTITATIVE METHODS
 MBA 611 STATISTICS AND QUANTITATIVE METHODS Part I. Review of Basic Statistics (Chapters 1-11) A. Introduction (Chapter 1) Uncertainty: Decisions are often based on incomplete information from uncertain
Lean Six Sigma Black Belt-EngineRoom
 Lean Six Sigma Black Belt-EngineRoom Course Content and Outline Total Estimated Hours: 140.65 *Course includes choice of software: EngineRoom (included for free), Minitab (must purchase separately) or
1. Then f has a relative maximum at x = c if f(c) f(x) for all values of x in some
 f(x) for all values of x in some") Section 3.1: First Derivative Test Definition. Let f be a function with domain D. 1. Then f has a relative maximum at x = c if f(c) f(x) for all values of x in some open interval containing c. The number
Section 3.1: First Derivative Test Definition. Let f be a function with domain D. 1. Then f has a relative maximum at x = c if f(c) f(x) for all values of x in some open interval containing c. The number
Hypothesis Testing for Beginners
 Hypothesis Testing for Beginners Michele Piffer LSE August, 2011 Michele Piffer (LSE) Hypothesis Testing for Beginners August, 2011 1 / 53 One year ago a friend asked me to put down some easy-to-read notes
Data, Measurements, Features
 Data, Measurements, Features Middle East Technical University Dep. of Computer Engineering 2009 compiled by V. Atalay What do you think of when someone says Data? We might abstract the idea that data are
SCHOOL OF HEALTH AND HUMAN SCIENCES DON T FORGET TO RECODE YOUR MISSING VALUES
 SCHOOL OF HEALTH AND HUMAN SCIENCES Using SPSS Topics addressed today: 1. Differences between groups 2. Graphing Use the s4data.sav file for the first part of this session. DON T FORGET TO RECODE YOUR
Introduction to Hypothesis Testing
 I. Terms, Concepts. Introduction to Hypothesis Testing A. In general, we do not know the true value of population parameters - they must be estimated. However, we do have hypotheses about what the true
Comparing Two Groups. Standard Error of ȳ 1 ȳ 2. Setting. Two Independent Samples
 Comparing Two Groups Chapter 7 describes two ways to compare two populations on the basis of independent samples: a confidence interval for the difference in population means and a hypothesis test. The