DIRECTIONAL COUPLER AND ATTENUATOR FOR MEDIUM WAVE POWER NETWORK ANALYZER MEASUREMENT SYSTEM
|
|
|
- Lawrence Shaw
- 10 years ago
- Views:
Transcription
1 DIRECTIONAL COUPLER AND FOR MEDIUM WAVE POWER NETWORK ANALYZER MEASUREMENT SYSTEM DIRECTIONAL COUPLER INPUT OUTPUT 50 OHMS 500 WATTS CW.2 MHZ TO 12 MHZ 30 DB MIN DIRECTIVITY S/N 0X TOROIDAL CURRENT TRANSFORMER -30 DB FWD -30 DB REF S/N Ox -30 DB OUT 12 DB RF 50 OHMS S/N 0x DEVICE PERFORMANCE DATA AND APPLICATION PAPERS NOVEMBER 2004

2 TOC MEASUREMENT NOTES AND GRAPHS PAGES SWEPT FREQUENCY TECHNIQUES FOR EVALUATING AM SYSTEM BANDWIDTH PAGES EVALUATION AND IMPROVEMENT OF ANTENNA CHARACTERISTICS FOR OPTIMAL DIGITAL PERFORMANCE PAGES The Tunwall Radio directional coupler and attenuator are built for the measurement system described in the articles listed above. The directional coupler is built according to the schematic diagram in the first article. The measurement graphs were made on the first coupler and attenuator built. All subsequent devices were constructed identically, and correct performance was verified individually. The construction and sale of the devices and reprinting of the articles are with the author s permission. Steve Tunwall 205 Ironwood Circle Aurora, OH [email protected]

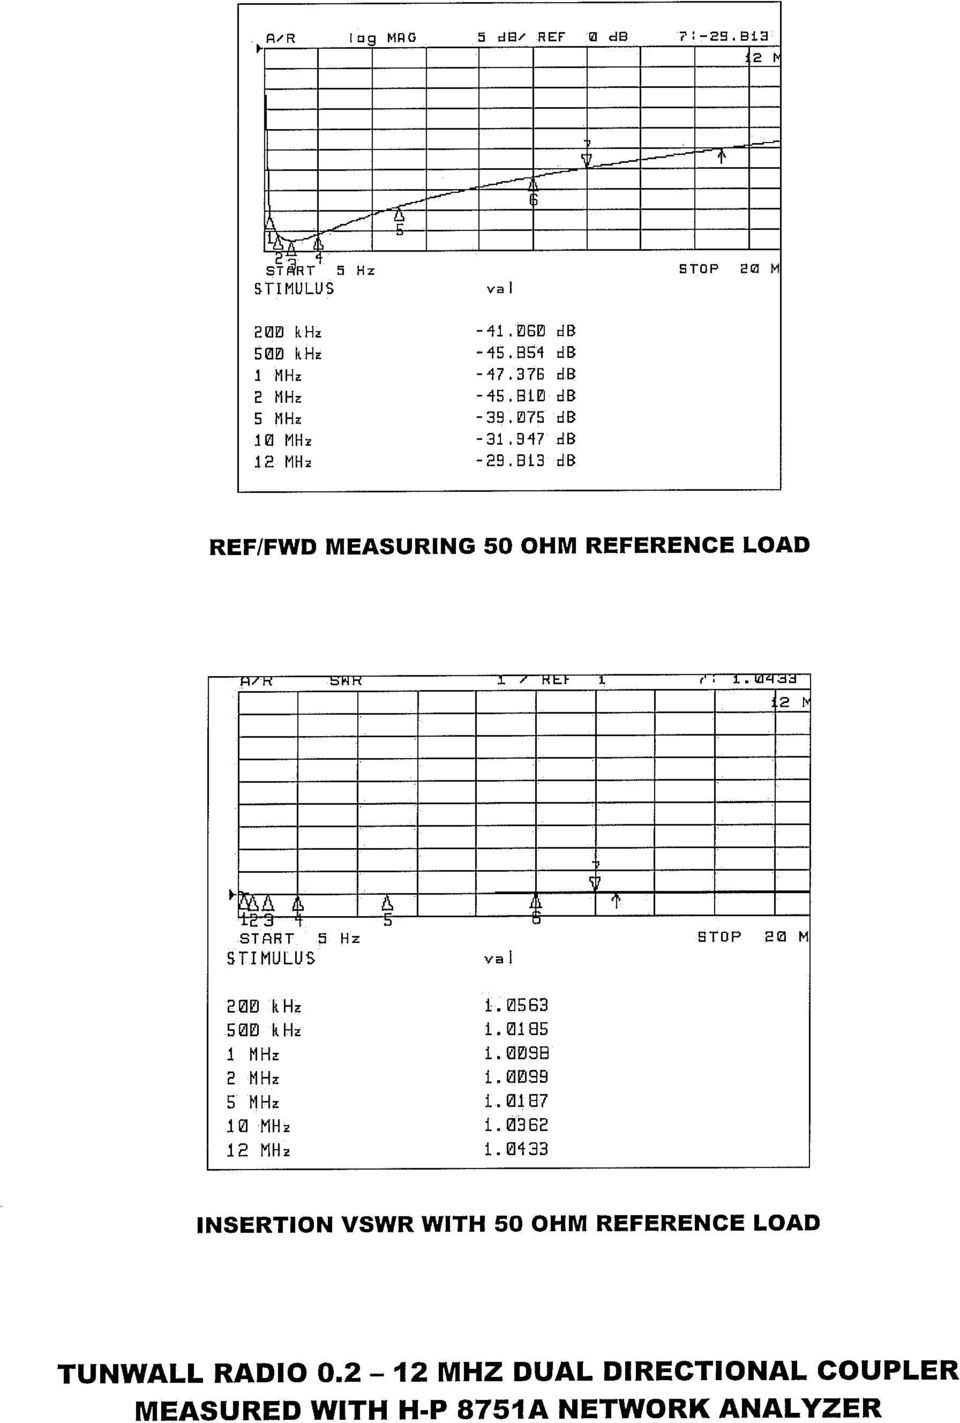
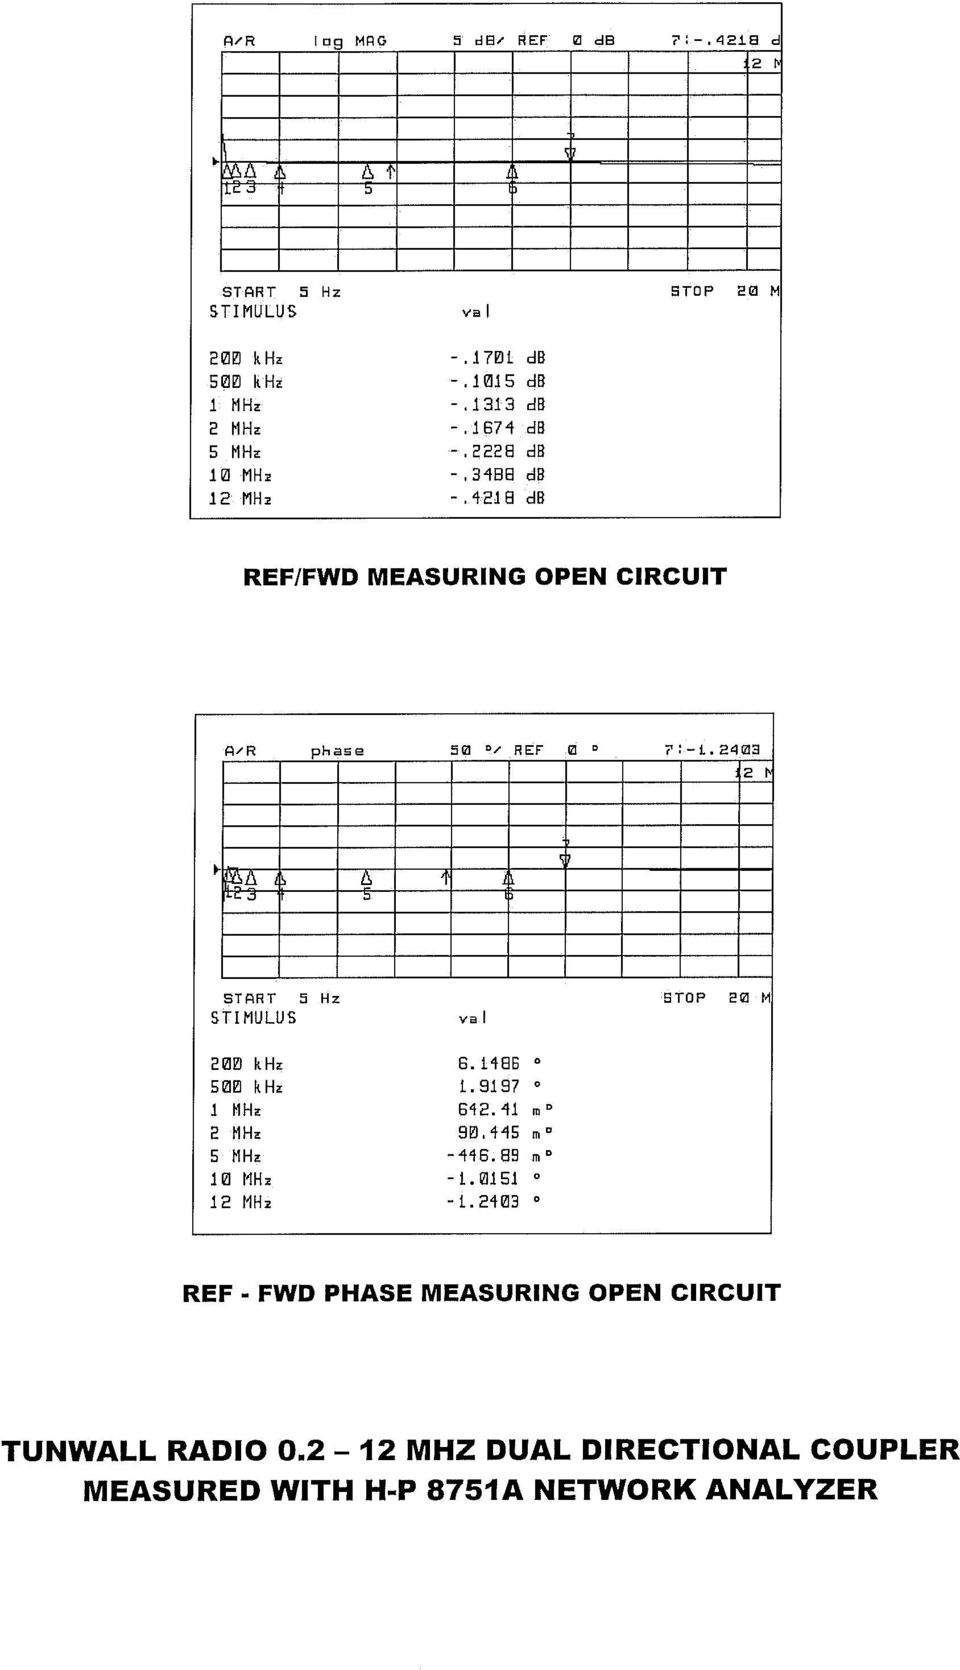
3 MEASUREMENT NOTES, DIRECTIONAL COUPLER 1. Rounding to the nearest db, the reflected port-to-forward port ratio exceeded 30 db from 200 KHz to 12 MHz when the directional coupler was terminated in a Maury Microwave Corporation ohm calibrated reference load. Over the mediumwave range for which the design was optimized, between 500 KHz and 2 MHz, the ratio exceeded 46 db. 2. The insertion VSWR was lowest - not exceeding 1.02:1 - over the range of 500 KHz to 2 MHz. This confirms that the implementation is optimized to allow operating impedance measurements within a mediumwave system with minimal insertion effect. 3. The flatness of the reflected port-to-forward port response and phase characteristics with open-circuit and short-circuit loads is sufficient, with the calibration correction of a modern vector network analyzer employed, to allow accurate impedance measurements within the common limitations of the reflection coefficient method. 4. Impedance measurements made using it in the power network analyzer system, looking into a dummy load with power of up to 200 watts sweeping from 500 KHz to 2 MHz, showed no indication of heating effects or nonlinearity. MEASUREMENT NOTES, 1. The measured attenuation would round down to 11 db instead of up to the stated 12 db within the mediumwave frequency range of 500 KHz to 2 MHz. The theoretical attenuation for the design, considering only the pure resistances involved, is 11.5 db and, hence, the stated attenuation - rounded to the nearest db - is 12 db. In the power network analyzer system for which the attenuator is intended, such small differences are of no consequence. The attenuator does not serve a calibrated function in the system. As typical variations in value of the power resistors within the circuit can be expected to result in attenuation to vary within a small range +/- the design value of 11.5 db in future units that are constructed, 12 db is an acceptable generic value. It is not referred to as a 12.0 db attenuator, however, as that would suggest an improper level of precision. 2. The flatness of the input impedance with the attenuator terminated in a 50 ohm load is very good over the mediumwave range of 500 KHz to 2 MHz. 3. It was tested with 100 watts input and a 50 ohm dummy load termination for 15 minutes and had no significant change in its input impedance or attenuation although it did get quite hot. If the attenuator is connected to an antenna receiving enough energy from other stations to deliver significant power to a 50 ohm load, it should work well if the power network analyzer system power plus the received energy does not greatly exceed 100 watts. The simple test given to the attenuator should justify a power rating of 100 watts intermittent.

4
5
6

7

8 TUNWALL RADIO TCT RESPONSE TERMINATED 50 OHMS DB FREQUENCY MHZ

9 SWEPT FREQUENCY TECHNIQUES FOR EVALUATING AM ANTENNA SYSTEM BANDWIDTH Ronald D. Rackley, P.E. du Treil, Lundin & Rackley, Inc. Sarasota, Florida Introduction To assure high quality transmission for stations operating in the AM radio band, the bandwidth characteristics of their transmitting antenna systems must be maintained to high standards. Impedance bandwidth as presented to a transmitter s final amplifier is the primary factor that is studied today, and it can be evaluated with measurements made using traditional impedance bridging techniques. The signals radiated from antennas can be subject to other bandwidth-related factors such as the delay characteristics of the matching equipment and filters, if any, and the pattern bandwidth characteristics of directional antenna systems. Evaluation of these other factors requires measurement of more than just impedance. The advent of digital transmission within the AM band promises to focus a much higher level of attention on antenna-related bandwidth matters. Not only is it necessary to pay close attention to the symmetry of the load impedance at the final amplifier of the transmitter to minimize unintended phase modulation that can cause a conventional AM signal to interfere with its own digital counterpart, the delay and response characteristics of the networks that lie between the transmitter and the antenna element(s) can have a significant impact on the integrity of the over-the-air digital signal. Additionally, the pattern bandwidth characteristics of a directional antenna system can determine how much of a station s analog coverage area will be able to receive a decodable digital signal. Although a modern device the vector network analyzer is capable of rapidly measuring every characteristic necessary to evaluate the important aspects of RF system bandwidth performance, it has not found widespread use in the AM band. Because vector network analyzers use signals at or near the milliwatt level for their measurements, they are subject to massive interference and even damage when connected directly to AM antennas because of the high levels of interference, from other signals and static discharges, that are induced on their towers. A system has been developed that utilizes a vector network analyzer along with an external amplifier for swept-frequency measurements of AM antennas and their associated RF circuitry under power with several volts of signal at the test terminals and a high degree of isolation between the antenna and the sensitive test equipment. The system can be used to make conventional impedance sweep measurements much more rapidly than is possible with traditional bridging equipment, and can also make sweep measurements of internal operating impedances, network response characteristics, network phase characteristics, network delay characteristics, and directional antenna element phase and ratio characteristics very efficiently. About Network Analyzers Present-day network analyzer technology evolved from the sweep measurement techniques that were used to plot the VSWR-vs-frequency characteristics of antennas at VHF frequencies and above 20 or more years ago. Scalar network analyzers so named because they do not view the quantities that they measure as complex numbers made such measurements more convenient when they became available by combining the sweep generator and tracking oscilloscope functions in one box. With the advent of vector network analyzer technology, it became possible to view the complex impedances of antennas instead of just their VSWR characteristics. A vector network analyzer consists in a very basic sense of a sweep generator, three synchronized receivers that detect the relative magnitudes and phases of the signals that are fed into them, and a computer that can process the outputs of two or more of the receivers as appropriate for the type of measurement that is desired. Impedance is just one thing that vector network analyzers can measure they can be used to measure many other parameters that are described by the relative magnitudes and phases of voltages or currents within a system, such as the response and phase characteristics of the

10 currents entering and leaving a network. Some vector network analyzers have the ability to perform the necessary mathematical transform to convert impedance sweep information at the input of a transmission line into a reflection-vs-distance (time domain) plot, making it possible to use one in place of a traditional time domain reflectometer ( TDR ) for finding line faults. Vector network analyzers fall into two general categories, those which simply have the sweep generator output and three receiver inputs on their front panels for connecting to the external components that are necessary for the desired measurements (with four jacks) and those which have everything necessary for specific measurements inside (with two jacks). Vector network analyzers with four jacks generally use external test sets that are designed for them. Such test sets fall into two categories S-parameter test sets that are capable of measuring the characteristics of a device under test ( DUT ) bi-directionally and transmission/reflection test sets that measure the input and pass characteristics of a DUT with the signal flow in one direction. Vector network analyzers with two jacks are very convenient for typical laboratory applications, but they lack the flexibility to be used with custom external devices for unusual applications such as high power measurements on AM directional arrays. The High-Power Measurement System The system that has been developed for AM band measurements at high power is based on a four-jack vector network analyzer. Both a Hewlett-Packard model 8753C analyzer and an Agilent Technologies model 4395A analyzer have been employed successfully in the system, the latter having the advantage of a built-in 3.5-inch magnetic disk drive to store its screen images making it unnecessary to have a printer or plotter attached during its use. In place of a transmission/reflection test set, the system uses a linear power amplifier, followed by a 12 db power attenuator, and then a broadband, highpower directional coupler that was custom designed for optimum performance within the range of 0.5 to 2.0 MHz. The power amplifier boosts the low-level RF output of the analyzer to a much higher voltage for application to the DUT. The voltage is dropped by the attenuator before entering the directional coupler both for amplifier load isolation and to attenuate interference signals coming from the DUT, which are reflected at the amplifier, by at least 24 db before they appear at the forward port of the directional coupler. The reference receiver, which phase-locks the analyzer, is therefore isolated by any interference that is present on the DUT by at least 24 db. The 12 db attenuator that follows the amplifier should be rated for higher power than the amplifier, for continuous operation, and should also be rated for bi-directional power flow if it is to be used to measure antennas that are near other AM radio stations that induce significant voltages on them. The directional coupler can be used by itself with its reflected port connected to the analyzer s receiver A for impedance measurements of a DUT. It can also be used to derive the reference signal necessary to phase-lock the analyzer with the reference receiver connected to its forward port and receivers A and B connected in other configurations. INPUT FORWARD 50 1 T 20 T FT Figure 1 Directional Coupler 1 T 20 T REFLECTED FT OUTPUT Figure 1 shows the circuit of the directional coupler that was developed for this system. Constructed in a 3.5 X 4.5 X 2 inch metal box with minimal lead length between the two transformers to minimize strays, it provides more than 40 db directivity over the frequency range of the AM band and was designed to withstand more than 100 volts across the DUT. The transformers are wound on Amadon Associates ferrite toroids. If a directional coupler for use between 3 30 MHz is desired, FT-114A-61 ferrite toroids may be substituted for those shown. The circuit requires precision, non-inductive 50 ohm resistors for accurate measurements. Caddock MP- 820 power film resistors, which have a resistance tolerance of one percent and are rated for 2.25 watts when free-mounted, are employed in the directional coupler circuit. An ENI type 240L linear amplifier is employed by the system. It has 50 db of gain and is rated for a continuous power output of 40 watts over the frequency range of 20 KHz to 10 MHz, which is achieved with the analyzer s power output set to 4 dbm. Other amplifiers should work well in the

11 system, although their power must be sufficient to overcome the level of interference that is encountered when the system is connected to an antenna. Impedance Measurements A network analyzer measures impedance by processing reflection coefficient information from a directional coupler with the signal from its internal sweep generator passing through it into the DUT. Since that process becomes more prone to error as the measured impedance departs further from the characteristic impedance of the directional coupler typically 50 ohms a different approach is used by modern impedance analyzers which are capable of very precise measurement from a fraction of an ohm to several megohms. It has been found, however, that with high quality directional couplers network analyzers can measure impedance values within the rated accuracy of the bridges that have traditionally been used for impedance measurements at AM frequencies up to a VSWR of greater than 10:1 referenced to the characteristic impedance. Most impedances that are encountered within AM antenna systems fall within that range. RF OUTPUT RECEIVER R AMPLIFIER (+50 db) (-12 db) FWD DIRECTIONAL COUPLER REF DUT measurements are made and the length of time required for each successive frequency sweep. For impedance measurements (and most of the other measurements that are made on AM antenna equipment), an IF bandwidth setting of 300 Hz has been found to be more than satisfactory. Vector network analyzers employ very sophisticated mathematical processing to achieve a high degree of accuracy including compensation for the effects of the coaxial cable used to connect the system to the DUT after they are calibrated with known open circuit, short circuit, and characteristic impedance standards. They are capable of covering a much wider frequency range than the AM band typically from a few hundred KHz to several GHz and precision calibration kits are normally recommended for use with them. Such calibration kits have been found to be unnecessary for making accurate measurements over the relatively narrow frequency range of the AM band, as long as a precision 50 ohm non-inductive resistor is used for the terminated calibration, a low-inductance short circuit is used for the short calibration, and a low stray-capacitance open circuit is used for the open calibration. These conditions are not nearly as hard to meet at 1.0 MHz as they are at 1 GHz, or even 100 MHz so it has been found to be sufficient to open and short test clips attached to the end of the coaxial cable that is used to connect the directional coupler to the DUT and then attach them to a low-inductance precision resistor, as prompted by the analyzer during the calibration process. RECEIVER A RECEIVER B VECTOR NETWORK ANALYZER Figure 2 Impedance Measurement System Figure 2 shows a block diagram of the system configuration that may be used for impedance measurements at the input of a DUT such as at a directional antenna common point or at the termination of the final amplifier of a transmitter. For an RF output of 4 dbm from the analyzer, the attenuators limit the signal level after amplification to 12 dbm at the receiver inputs a level that is well within the range of the analyzer. The IF bandwidth that is selected for the analyzer determines both the resolution with which Figure 3 Impedance Measurements at ATU Input Figure 3 is a photograph of the system being used to measure the input impedance of a nondirectional antenna s tuning unit. Figure 4 shows both the Smith Chart plot and the tabulation of the impedance sweep that were generated by the analyzer.

12 methods, it is necessary to constantly move the equipment when setting up the networks within a phasor cabinet, for instance. With the vector network analyzer system, the equipment can be placed within view of a phasor cabinet and not moved. A test cable of sufficient length to reach all of the networks can be calibrated once and then used repeatedly during the setup process. Operating Impedance Measurements Figure 4 Impedance Measurement Results The ability to measure impedances over a wide frequency range rapidly makes the system useful for other things such as evaluating transmission lines. Even if the analyzer does not have the option that allows it to function as a TDR, a sweep of measurements such as is shown on Figure 5 can be interpreted to find the length of a transmission line that is open-circuited or short-circuited on its far end by noting the frequency spacing between successive resonant points the line being one-half wavelength, or 180 elecrtical degrees in length, at that frequency. Despite the fact that the process of measuring impedances near zero (at the resonant points) is imperfect due to the nature of the reflection coefficient method used by vector network analyzers, it has been found that line lengths may be determined with sufficient accuracy for practical directional antenna work by this method. Figure 6 shows how the system may be configured to use two directional couplers to sweep the operating impedances of a directional antenna system where the transmission lines exit its phasor cabinet. Such measurements can be very meaningful for troubleshooting both impedance bandwidth and pattern bandwidth problems in arrays. RF OUTPUT RECEIVER R RECEIVER A RECEIVER B VECTOR NETWORK ANALYZER AMPLIFIER (+50 db) (-12 db) PHASOR FWD FWD DIRECTIONAL COUPLER DIRECTIONAL COUPLER REF LINE CP Figure 6 Operating Impedance System Figure 5 Transmission Line Measurements The system is also useful for the initial setup of RF matching and phase shifting networks, since the ability to connect a coaxial cable of any practical length to the directional coupler and then calibrate it for accurate impedance measurement at its far end makes it possible to measure and adjust network branches without having to place the measurement equipment nearby. With traditional bridging The directional coupler that is used to measure the operating impedance supplies its forward and reverse samples to the B and A receiver inputs of the analyzer, respectively. Short leads must be used at its input and output to minimize its insertion effects on the antenna parameters. The analyzer is configured to use the two receivers for measurement, and the input to the reference receiver which is derived from the forward port of the directional coupler at the common point is only used to phase-lock the system. This allows the system to operate with a high degree of interference immunity even when measuring the line matches of the low-power towers of an array owing to the isolation of the reference receiver input from other signals that are picked up by the antenna.

13 Measuring Network Response Characteristics Figure 7 shows the system configured to use the A and B receiver inputs to measure the response of a network using current transformers at its input and output. The measurements may be made with the network driven by the output of the directional coupler and terminated in a load, as shown, or with the network connected for normal operation with the antenna input driven by the output of the directional coupler. Figure 9 Response Measurements RF OUTPUT AMPLIFIER (+50 db) (-12 db) DIRECTIONAL COUPLER FWD RECEIVER R RECEIVER A NETWORK RECEIVER B VECTOR NETWORK ANALYZER Figure 7 Response Measurement System The details of the current transformer design are shown on Figure 8. The secondary consists of 32 turns of RG-174 miniature coaxial cable wound onto the ferrite toroid and connected as shown. The test setup to measure the response of an antenna matching/diplexer unit, with a current transformer at one station s input and another at the combined output, is shown in Figure 9. Figure 10 is a close-up photograph showing the transformer at the unit s input. Figure 10 Current Transformer at ATU Input Figure 11 shows the measured response in db and Figure 12 shows the measured phase shift. Figure 13 shows the measured delay characteristics. In addition to phase shift and delay characteristics, vector network analyzers can also produce a screen showing a plot of the departure from linear phase a related quantity that may be convenient to use when analyzing the transparency of a network or system of networks. 1 T FT T OUTPUT Figure 8 Current Transformer Figure 11 Measured Response

14 the ratio and phase of the current flowing in a tower of an array may vary with frequency, respectively. RF OUTPUT AMPLIFIER (+50 db) (-12 db) DIRECTIONAL COUPLER CP FWD RECEIVER R RECEIVER A DA TOWER CURRENT SAMPLES Figure 12 Measured Phase Shift Sweep RECEIVER B REFERENCE TOWER CURRENT SAMPLE VECTOR NETWORK ANALYZER Figure 14 DA Phase and Ratio Measurements Figure 13 Measured Delay Sweep The system may be used in its response measurement configuration to evaluate and adjust filters such as are employed to eliminate intermodulation products from transmitters and for multiplexing more than one frequency on a single antenna. Such work goes very quickly with the system. An analyzer IF Bandwidth setting of 100 Hz has been found to be more than sufficient for filter tuning work, while a setting of 300 Hz can be used for measuring the response of simpler networks. Figure 15 Measured Ratio Sweep Measuring Directional Antenna Parameters Figure 14 shows the configuration that may be used to measure the phase and ratio-vs-frequency characteristics of a directional antenna system s elements. The common point is driven by the directional coupler which derives the signal for the analyzer s reference receiver input. The antenna monitor sampling line of the reference tower is connected to the B receiver s input. The other sampling lines are switched to the A receiver s input and the analyzer is alternately set to measure the magnitude and phase relationships of the A and B inputs for each tower. Figures 15 and 16 show how Figure 16 Measured Phase Sweep It may be necessary to use attenuator values that differ from those that are shown at the analyzer s receiver inputs on Figure 14, depending on the sensitivity of the sampling devices that are employed

15 in the antenna monitor sampling system. The voltages at the terminals of the antenna monitor can be compared to the voltage that is known to be present at the common point under normal operation to determine the db isolation between the directional antenna s input and the sampling lines when they are terminated in 50 ohm loads - and appropriate attenuator values can then be chosen. Information on how the tower ratios and phases vary with frequency may be used to evaluate pattern bandwidth. The measured antenna element parameters at carrier and sideband frequencies may be used to calculate the changes in far-field magnitude and phase that occur at different azimuths, using computer software such as the Mininec Broadcast Professional package. The far-field response may then be calculated directly from the magnitude excursions. The delay characteristics may be calculated from the phase characteristics at the azimuths of interest. Further Comments The capabilities of network analyzers far exceed the specific applications that are described herein, and anyone wishing to use the system will do well to become thoroughly familiar with them by studying their instruction manuals and any other educational materials that are available. The information provided herein is for general use only and assumes that any user will be competent in the use of vector network analyzers before the described procedures are undertaken. Although the system has been successfully used under a variety of conditions at different transmitter sites, the experience with it is not exhaustive and there may be some cases where its usefulness is limited by interference or other factors that are yet unknown. While the system has proven very effective for evaluating antenna performance and setting up networks where frequency sweep information is useful, the battery-powered convenience of current model bridging equipment still recommends it for simple single-frequency impedance measurements particularly in equipment that is located outdoors. For that convenience, and the ability to measure very high and very low impedances that are outside the accurate range of the vector network analyzer system RF bridges and generator/receiver units will continue to be standard equipment for engineers who service and adjust AM antennas. Conclusion With the high power measurement system described herein, vector network analyzers may be utilized for both conventional impedance measurements and the specialized tests that are required to evaluate the transparency of AM antenna systems for digital signal transmission. Because automatic sweptfrequency techniques are used, the bandwidth characteristics of an antenna system can be evaluated with minimal station down time. As of yet, no antenna system performance requirements have been issued by the developer of the digital transmission system that has been approved for use by AM stations in the United States. Presumably, the requirements will be forthcoming and engineers will then be able to use the vector network analyzer system to obtain the information necessary to predict the performance of antenna systems under as built conditions and, where necessary, devise corrective measures. References: 1) Using a Network Analyzer to Characterize High-Power Components, Agilent Technologies Application Note ) Exploring the Architectures of Network Analyzers, Agilent Technologies Application Note ) Understanding the Fundamental Principles of Vector Network Analysis, Agilent Technologies Application Note ) Applying Error Correction to Network Analyzer Measurements, Agilent Technologies Application Note ) Advanced Impedance Measurement Capability of the RF I-V Method Compared to the Network Analysis Method, Agilent Technologies Application Note

16 EVALUATION AND IMPROVEMENT OF AM ANTENNA CHARACTERISTICS FOR OPTIMAL DIGITAL PERFORMANCE Ronald D. Rackley, P.E. du Treil, Lundin & Rackley, Inc. Sarasota, Florida INTRODUCTION AM digital transmission places high demands on antenna system bandwidth, both from the standpoint of the input impedance at the transmitter load - which can cause noisy analog reception - and the antenna s far-field radiation characteristics, which can erode the error-correction capability of the digital signal and make its reception inconsistent. Directional antenna systems present the additional complication of sideband phase and amplitude errors resulting from changes in pattern shape with frequency, which can render digital modulation un-decodable in areas with satisfactory analog reception. A conventional AM signal is modulated in amplitude only, and has an uncomplicated spectral display that is directly related to the spectral content of the modulating audio. For single-frequency (sinusoidal) audio modulation, the RF envelope waveform is produced by two sidebands separated from the RF carrier frequency by the modulating signal s frequency. For 100-percent modulation, each sideband is one-half the amplitude of the carrier. AM In-Band-On-Channel (IBOC) digital transmission technology is currently moving from the realm of the theoretical into the "real World" and, although the body of on-the-air experience with it is limited, it is rapidly expanding. Measurements can be made to evaluate the important aspects of antenna performance and, in many cases where performance is found to be lacking, relatively simple measures can be taken to improve matters. - F(M) + F(M) MODULATION BASICS As the ultimate goal in digital transmission is to have the signal pass through the antenna system and arrive at the receiver with its components in their correct relationships, it is best to start with an understanding of the nature of those components and how they might be affected by the transmission system. Digital modulation is accomplished by varying both the amplitude and the angle of the RF carrier simultaneously to transmit the digital bits that are decoded in the receiver. In the case of IBOC transmission such as is presently being introduced in the USA, this is done while still transmitting the conventional AM signal by sending the digital information at a low level so that the resulting occupied spectrum fits within the RF mask of an AM channel as defined in the FCC Rules. AM SINUSOIDAL MODULATION SPECTRUM (FREQUENCY DOMAIN) A spectrum analyzer screen showing such modulation contains the three components of the signal plotted in terms of frequency (in the frequency domain). It is very difficult to visualize the components of even the simplest form of modulation in the time domain, since the carrier and sidebands are all varying sinusoidally over time although at different rates. Normally, complex mathematical expressions are used to explain modulation in the time domain using phasor algebra. Fortunately, it is possible to show the relative motion of the carrier and sideband phasors using vector analysis by referencing the degree of rotation of the sidebands to a fixed point in the rotation of the carrier phasor.

17 The two sidebands of a conventional singlefrequency modulated AM signal appear as equallength vectors that rotate in opposite directions relative to the stationary carrier vector and are always displaced from it by equal but opposite angles. At the point in the modulated RF envelope where its amplitude is equal to that of the carrier alone, the two sidebands oppose each other to completely cancel in the resultant of the vector addition. As the two sideband vectors fall in line with each other and the carrier vector, the resultant approaches twice the carrier magnitude to form a 100-percent positive modulation peak. R - F(M) + F(M) - F(M) + F(M) AM SINUSOIDAL MODULATION (VECTOR REPRESENTATION) As the sideband vectors rotate so that the resultant is greater than the amplitude alone, the waveform progresses toward a positive modulation peak. R AM SINUSOIDAL MODULATION (VECTOR REPRESENTATION) Similarly, when enough time has passed for the two sideband vectors to rotate to the opposite direction, the resultant will approach zero to form a 100-percent negative modulation peak (not shown). - F(M) + F(M) Except when testing with tone modulation, AM signals are much more complicated. The complex waveforms of normal programming have many frequency components. In a perfect system, however, the components will always be divided into equal, symmetrical sideband components. AM SINUSOIDAL MODULATION (VECTOR REPRESENTATION)

18 + F(M) AND ETC... FREQUENCY COMPONENTS OF MODULATING WAVEFORM F (C) - F(M) AM COMPLEX MODULATION (VECTOR REPRESENTATION) A spectrum analyzer shows the range of frequencies occupied by the various sideband components for normal program modulation. FM - PM MODULATION FIRST ORDER SIDEBANDS AM COMPLEX MODULATION SPECTRUM (FREQUENCY DOMAIN) Suppose that the sidebands vectors are symmetrical about an imaginary line running perpendicular to the carrier vector instead of to the carrier vector itself in other words, the sidebands of AM transmission are rotated 90 degrees (in quadrature) relative to the carrier. The resultant will not always fall in line with the carrier, but will vary in angle from it over time. This will be fundamentally angle modulation which, in analog transmission, may be either phase modulation or frequency modulation depending on the process applied to the audio to produce it. Careful observation reveals that angle modulation accomplished with only two sidebands for the singlefrequency, sinusoidal case would also produce secondary amplitude modulation, since the resultant follows a line tangent to the circle that would be traced by the carrier vector if only its angle were changing. That is why an FM signal has many sidebands even if only a single-frequency tone is being transmitted the infinite number of harmonically-related sidebands that trail off in amplitude and vary in phase are necessary in order to have the resultant trace the circle rather than the tangent line. Real-World conditions do not permit infinite bandwidth, of course, so at lease a small amount of distortion is theoretically unavoidable when FM is transmitted through a bandwidth-limited transmission channel. DIGITAL TRANSMISSION Digital transmission utilizes a combination of amplitude and angle modulation to send the bits of information that are decoded by receivers. Such modulation is generally referred to as I-Q modulation, as each bit has a unique combination of I (in phase with the carrier) and Q (in quadrature relative to the carrier) components assigned for it. The following diagram depicts the basic concepts involved in sending a 16-bit digital constellation with I-Q modulation superimposed on a conventional AM signal. It is a conceptual sketch only, and does not represent any actual transmission system. It is not to scale.
 Suppose that the sidebands vectors are symmetrical about an imaginary line running perpendicular to the")
19 100% POSITIVE PEAK TRANSMITTER LOAD OPTIMIZATION CARRIER DIGITAL INFORMATION When a transmitter with a perfect modulation system is connected to a perfect load (one which does not change impedance with frequency), perfect transmission of the digital signal will result. Modern transmitters that have been designed to carry digital modulation approach perfection, at least for all practical purposes. Real-world antennas, however, do not. Since it is not realistic to expect antennas to have input impedances that are constant with frequency, the goal of having the effects of changing impedance at least be symmetrical about the carrier frequency must be pursued. If the load impedances at sideband frequencies differ from the carrier frequency in symmetrical fashion, cross-talk between the digital and analog signals can be minimized. AM + DIGITAL IQ MODULATION CONCEPTUAL ONLY - NOT TO SCALE It can be seen that, for the bits to arrive in the correct relationships to be decoded by a receiver, the transmission system must maintain their correct locations in terms if I and Q and they must remain isolated from the AM signal. It is important to note that the symmetry must be provided to the actual active components of the final amplifier, where the process may be most closely simulated by a perfect source. The circuitry that provides impedance matching and bandpass filtering between the final amplifier and the transmitter output port must be considered if it is impossible to make impedance measurements at the final amplifier. Assuming that the output network of a transmitter is adjusted to provide the correct load impedance for the final amplifier at carrier frequency, the most important thing to know about it for sideband symmetry analysis is its phase delay. LOAD MUST BE SYMMETRICAL HERE TRANSMITTER OUTPUT PORT FINAL AMPLIFIER OUTPUT MATCHING AND FILTERING NETWORK AM IBOC MODULATION SPECTRUM (FREQUENCY DOMAIN) CONCEPTUAL - NOT TO SCALE IBOC digital transmission occupies spectrum in addition to that of a conventional AM signal. It is most convenient to view impedances as they appear on a Smith Chart when analyzing sideband symmetry. In order to view the important characteristics of the impedances without respect to what the impedance might be at carrier frequency such as at the final amplifier of a solid state transmitter which operates into an 8 Ohm load or at the common point of a directional antenna system s phasor which might be offset in reactance by several negative ohms to correct for the insertion inductance of a contactor between it and the transmitter perunit Smith Charts (referenced to 1.0 rather than a transmission line impedance like 50 Ohms) are used.

20 45 DEG TOWARD GENERATOR +J 1.0 R=1.0 0 DEG OR 180 DEG J= DEG F(L) -J 1.0 F(H) 135 DEG SMITH CHART BASICS The process of converting an impedance sweep for per-unit analysis is known as normalizing to the carrier frequency impedance. Dividing the resistance at a sideband frequency by the carrier frequency resistance gives the sideband per-unit normalized resistance if the carrier frequency resistance is assigned a value of unity. Dividing the difference in reactance between a sideband frequency and the carrier frequency by the carrier resistance gives the sideband per-unit normalized reactance if the carrier frequency reactance is assigned a value of zero. FINAL AMPLIFIER LOAD IMPEDANCE SYMMETRY F (C) - F(M) + F(M) NORMALIZING PER-UNIT VALUES TO THE CARRIER IMPEDANCE 1. DIVIDE EACH SIDEBAND RESISTANCE BY THE CARRIER RESISTANCE 2. DIVIDE THE DIFFERENCE BETWEEN EACH SIDEBAND REACTANCE AND THE CARRIER REACTANCE BY THE CARRIER RESISTANCE EXAMPLES FREQUENCY C.P. RESISTANCE C.P. REACTANCE PER-UNIT RESISTANCE PER-UNIT REACTANCE - 15 KHZ j j 0.16 CARRIER j KHZ j j KHZ j j 0.09 CARRIER j j KHZ j j 0.12 SIDEBAND ALTERATION FROM SYMMETRICAL LOAD A symmetrical impedance sweep will appear on the Smith Chart with equal normalized resistances and equal normalized reactances of opposite sign for equal frequency deviation from the carrier frequency. For this symmetrical case, the sideband resistances are equal but lower than the carrier resistance - at both sideband frequencies and the

21 sideband reactances are symmetrical. If the final amplifier functions as a voltage source, higher power will be delivered to both sidebands than would be the case with a flat load (meaning longer sideband vectors) - resulting in pre-emphasis but not harmonic distortion in the demodulated waveform.. In addition, the opposite reactances will cause both sidebands to be offset by equal but opposite angles relative to the carrier - producing envelope delay, but not harmonic distortion, in the demodulated waveform. Both effects are perfectly acceptable for analog transmission, as long as the transmitter is not driven into nonlinearity to deliver the required sideband power. For digital transmission, the effects on the I-Q constellation will be more easily compensated than would be the case with a nonsymmetrical load. Importantly for IBOC transmission, the symmetry will prevent crosstalk between the digital and analog signals. F(L) +X -X F(H) R Digital-to-analog crosstalk may be the area of most concern for stations initially converting to IBOC transmission. Although a certain amount of hiss-type noise must be tolerated under the carrier of an AM station transmitting the IBOC signal, a very prominent bacon frying noise has been noted in certain cases. Thus far, experience indicates that this noise may be significantly decreased by establishing final amplifier load symmetry. FINAL AMPLIFIER LOAD IMPEDANCE ASSYMMETRY The following case of asymmetrical sideband load impedances shows how the two sideband vectors are altered differently in length and offset differently in angle due to the sideband impedances presented to the final amplifier. It is obvious that the resultant will follow an ellipse over a cycle of the analog modulating frequency rather than the straight line that is traced by a pure AM signal. Non-symmetrical load impedance characteristics, in addition to causing crosstalk between the digital and analog signals in IBOC transmission, also complicate the error correction process for the digital I-Q constellation - leading to higher bit error rates that erode the reliability of the digital transmission channel. For the same reasons, the analog signal sidebands are altered in such a way as to cause harmonic distortion in the demodulated waveform. F (C) - F(M) SIDEBAND ALTERATION FROM ASYMMETRICAL LOAD + F(M)
22 The asymmetrical load in this case can be made to perform identically to the symmetrical load that was considered in the first case by the addition of a -45 degree phase shifting network between the transmitter and the antenna. TRANSMITTER TRANSMITTER OUTPUT PORT - 45 DEGREE PHASE SHIFTING NETWORK TO ANTENNA Some loads may not be made symmetrical for the transmitter s final amplifier by simple phase rotation. One method to evaluate the potential for symmetry is to plot the normalized per-unit antenna input impedance on transparent overlay paper over a Smith Chart so that it can be rotated about the reference point to simulate the effects of added phase shift. It is obvious by inspection that this load will require more than the addition of a phase-shifting network to have final amplifier load symmetry. IBOC DESIRED CHARACTERISTICS Although there are no universally accepted criteria for evaluating the effects on digital transmission of finite-bandwidth antenna systems, the developer of the digital transmission system that is presently in use in the United States, Ibiquity, has recommended the following desired characteristics for antenna systems that transmit with their system: I. Load Impedance Bandwidth a. +/- 5 KHz - symmetry of the load impedance presented to the final RF amplifier within the transmitter such that the VSWR calculated for one sideband impedance, when normalized to the complex conjugate of the corresponding sideband impedance on the other side of carrier frequency, does not exceed 1.035:1 +X R +5 KHz +X - 5 KHz R -X F(H) F(L) -X ANTENNA IMPEDANCE ASYMMETRY b. +/- 10 KHz - the VSWR of the load impedance presented to the final RF amplifier within the transmitter should not exceed 1.20:1 when normalized to the carrier frequency impedance. c. +/- 15 KHz - the VSWR of the load impedance presented to the final RF amplifier within the transmitter should not exceed 1.40:1 when normalized to the carrier frequency impedance.
23 +X +10 KHz 1.2:1 VSWR R 1.4:1 VSWR Fc -15 KHz NETWORK ANALYZER MEASUREMENTS It has been found to be very convenient to use a network analyzer to make the measurements necessary for evaluating antenna system performance for digital transmission. A power-amplified system for making measurements with interference immunity has been developed for this purpose, and was described in the author s paper which appears in the NAB 2003 Engineering Conference Proceedings. -X RF OUTPUT AMPLIFIER (+50 db) (-12 db) DIRECTIONAL COUPLER DUT FWD REF II. Far-Field Radiation Pattern Bandwidth a. +/- 15 KHz - Response within +/- 2 db b. +/- 15 KHz - Group delay constant within +/- 5.0 microseconds These values are preliminary guidelines and are subject to change as more experience is gained with digital transmission. Thus far, experience has shown that the recommendations for sideband VSWR at 10 and 15 KHz from the carrier frequency are very conservative. Loads with higher sideband VSWRS have provided satisfactory performance both in the lab and in the field when the sideband impedances are made nearsymmetrical about the carrier frequency [where perfect symmetry would have equal resistance and equal-but-opposite reactance excursions on either side of the carrier frequency]. RECEIVER R RECEIVER A RECEIVER B VECTOR NETWORK ANALYZER IMPEDANCE MEASUREMENT SYSTEM As explained earlier, the symmetry of the sideband impedances at +/- 5 KHz of carrier frequency has proven to be very important for minimizing digital-to-analog crosstalk. Such crosstalk causes noise that is sometimes described as bacon frying underneath the analog signal when digital transmission is underway. IMPEDANCE MEASUREMENTS AT ATU INPUT
24 AN IMPEDANCE SWEEP A MEASURED DA TOWER RATIO SWEEP Another configuration may be used to measure the phase and ratio-vs-frequency characteristics of a directional antenna system s elements. The common point is driven by the directional coupler which derives the signal for the analyzer s reference receiver input. The antenna monitor sampling line of the reference tower is connected to the B receiver s input. The other sampling lines are switched to the A receiver s input and the analyzer is alternately set to measure the magnitude and phase relationships of the A and B inputs for each tower. A MEASURED DA TOWER PHASE SWEEP RF OUTPUT RECEIVER R RECEIVER A RECEIVER B AMPLIFIER (+50 db) (-12 db) FWD DIRECTIONAL COUPLER CP DA TOWER CURRENT SAMPLES REFERENCE TOWER CURRENT SAMPLE Information on how the tower ratios and phases vary with frequency may be used to evaluate pattern bandwidth. The measured antenna element parameters at carrier and sideband frequencies may be used to calculate the changes in far-field magnitude and phase that occur at different azimuths, using computer software such as the Mininec Broadcast Professional package. The far-field response may then be calculated directly from the magnitude excursions. The delay characteristics may be calculated from the phase characteristics at the azimuths of interest. VECTOR NETWORK ANALYZER DA PHASE AND RATIO MEASUREMENTS
RF Network Analyzer Basics
 RF Network Analyzer Basics A tutorial, information and overview about the basics of the RF Network Analyzer. What is a Network Analyzer and how to use them, to include the Scalar Network Analyzer (SNA),
Experiment 7: Familiarization with the Network Analyzer
 Experiment 7: Familiarization with the Network Analyzer Measurements to characterize networks at high frequencies (RF and microwave frequencies) are usually done in terms of scattering parameters (S parameters).
MEASUREMENT UNCERTAINTY IN VECTOR NETWORK ANALYZER
 MEASUREMENT UNCERTAINTY IN VECTOR NETWORK ANALYZER W. Li, J. Vandewege Department of Information Technology (INTEC) University of Gent, St.Pietersnieuwstaat 41, B-9000, Gent, Belgium Abstract: Precision
Keysight Technologies Understanding the Fundamental Principles of Vector Network Analysis. Application Note
 Keysight Technologies Understanding the Fundamental Principles of Vector Network Analysis Application Note Introduction Network analysis is the process by which designers and manufacturers measure the
Engineering Sciences 151. Electromagnetic Communication Laboratory Assignment 3 Fall Term 1998-99
 Engineering Sciences 151 Electromagnetic Communication Laboratory Assignment 3 Fall Term 1998-99 WAVE PROPAGATION II: HIGH FREQUENCY SLOTTED LINE AND REFLECTOMETER MEASUREMENTS OBJECTIVES: To build greater
Optimizing IP3 and ACPR Measurements
 Optimizing IP3 and ACPR Measurements Table of Contents 1. Overview... 2 2. Theory of Intermodulation Distortion... 2 3. Optimizing IP3 Measurements... 4 4. Theory of Adjacent Channel Power Ratio... 9 5.
HD Radio FM Transmission System Specifications Rev. F August 24, 2011
 HD Radio FM Transmission System Specifications Rev. F August 24, 2011 SY_SSS_1026s TRADEMARKS HD Radio and the HD, HD Radio, and Arc logos are proprietary trademarks of ibiquity Digital Corporation. ibiquity,
Understanding the Fundamental Principles of Vector Network Analysis. Application Note 1287-1. Table of Contents. Page
 Understanding the Fundamental Principles of Vector Network Analysis Application Note 1287-1 Table of Contents Page Introduction 2 Measurements in Communications Systems 2 Importance of Vector Measurements
0HDVXULQJWKHHOHFWULFDOSHUIRUPDQFH FKDUDFWHULVWLFVRI5),)DQGPLFURZDYHVLJQDO SURFHVVLQJFRPSRQHQWV
,)DQGPLFURZDYHVLJQDO SURFHVVLQJFRPSRQHQWV") 0HDVXULQJWKHHOHFWULFDOSHUIRUPDQFH FKDUDFWHULVWLFVRI5),)DQGPLFURZDYHVLJQDO SURFHVVLQJFRPSRQHQWV The treatment given here is introductory, and will assist the reader who wishes to consult the standard texts
0HDVXULQJWKHHOHFWULFDOSHUIRUPDQFH FKDUDFWHULVWLFVRI5),)DQGPLFURZDYHVLJQDO SURFHVVLQJFRPSRQHQWV The treatment given here is introductory, and will assist the reader who wishes to consult the standard texts
Impedance 50 (75 connectors via adapters)
") VECTOR NETWORK ANALYZER PLANAR TR1300/1 DATA SHEET Frequency range: 300 khz to 1.3 GHz Measured parameters: S11, S21 Dynamic range of transmission measurement magnitude: 130 db Measurement time per point:
VECTOR NETWORK ANALYZER PLANAR TR1300/1 DATA SHEET Frequency range: 300 khz to 1.3 GHz Measured parameters: S11, S21 Dynamic range of transmission measurement magnitude: 130 db Measurement time per point:
Antenna Properties and their impact on Wireless System Performance. Dr. Steven R. Best. Cushcraft Corporation 48 Perimeter Road Manchester, NH 03013
 Antenna Properties and their impact on Wireless System Performance Dr. Steven R. Best Cushcraft Corporation 48 Perimeter Road Manchester, NH 03013 Phone (603) 627-7877 FAX: (603) 627-1764 Email: [email protected]
Department of Electrical and Computer Engineering Ben-Gurion University of the Negev. LAB 1 - Introduction to USRP
 Department of Electrical and Computer Engineering Ben-Gurion University of the Negev LAB 1 - Introduction to USRP - 1-1 Introduction In this lab you will use software reconfigurable RF hardware from National
Agilent 8510-13 Measuring Noninsertable Devices
 Agilent 8510-13 Measuring Noninsertable Devices Product Note A new technique for measuring components using the 8510C Network Analyzer Introduction The majority of devices used in real-world microwave
ECE 435 INTRODUCTION TO THE MICROWAVE NETWORK ANALYZER
 ECE 435 INTRODUCTION TO THE MICROWAVE NETWORK ANALYZER Latest revision: October 1999 Introduction A vector network analyzer (VNA) is a device capable of measuring both the magnitude and phase of a sinusoidal
Implementing Digital Wireless Systems. And an FCC update
 Implementing Digital Wireless Systems And an FCC update Spectrum Repacking Here We Go Again: The FCC is reallocating 600 MHz Frequencies for Wireless Mics 30-45 MHz (8-m HF) 174-250 MHz (VHF) 450-960 MHz
Application Note Noise Frequently Asked Questions
 : What is? is a random signal inherent in all physical components. It directly limits the detection and processing of all information. The common form of noise is white Gaussian due to the many random
Measuring RF Parameters of Networks Bill Leonard NØCU
 Measuring RF Parameters of Networks Bill Leonard NØCU NAØTC - 285 TechConnect Radio Club http://www.naøtc.org/ What is a Network? A Network is a group of electrical components connected is a specific way
RF Measurements Using a Modular Digitizer
 RF Measurements Using a Modular Digitizer Modern modular digitizers, like the Spectrum M4i series PCIe digitizers, offer greater bandwidth and higher resolution at any given bandwidth than ever before.
The W5JCK Guide to the Mathematic Equations Required for the Amateur Extra Class Exam
 The W5JCK Guide to the Mathematic Equations Required for the Amateur Extra Class Exam This document contains every question from the Extra Class (Element 4) Question Pool* that requires one or more mathematical
T = 1 f. Phase. Measure of relative position in time within a single period of a signal For a periodic signal f(t), phase is fractional part t p
, phase is fractional part t p") Data Transmission Concepts and terminology Transmission terminology Transmission from transmitter to receiver goes over some transmission medium using electromagnetic waves Guided media. Waves are guided
Data Transmission Concepts and terminology Transmission terminology Transmission from transmitter to receiver goes over some transmission medium using electromagnetic waves Guided media. Waves are guided
Agilent De-embedding and Embedding S-Parameter Networks Using a Vector Network Analyzer. Application Note 1364-1
 Agilent De-embedding and Embedding S-Parameter Networks Using a Vector Network Analyzer Application Note 1364-1 Introduction Traditionally RF and microwave components have been designed in packages with
Performing Amplifier Measurements with the Vector Network Analyzer ZVB
 Product: Vector Network Analyzer R&S ZVB Performing Amplifier Measurements with the Vector Network Analyzer ZVB Application Note This document describes typical measurements that are required to be made
Maximizing Receiver Dynamic Range for Spectrum Monitoring
 Home Maximizing Receiver Dynamic Range for Spectrum Monitoring Brian Avenell, National Instruments Corp., Austin, TX October 15, 2012 As consumers continue to demand more data wirelessly through mobile
Agilent PN 8753-1 RF Component Measurements: Amplifier Measurements Using the Agilent 8753 Network Analyzer. Product Note
 Agilent PN 8753-1 RF Component Measurements: Amplifier Measurements Using the Agilent 8753 Network Analyzer Product Note 2 3 4 4 4 4 6 7 8 8 10 10 11 12 12 12 13 15 15 Introduction Table of contents Introduction
Agilent PN 89400-13 Extending Vector Signal Analysis to 26.5 GHz with 20 MHz Information Bandwidth
 Agilent PN 89400-13 Extending Vector Signal Analysis to 26.5 GHz with 20 MHz Information Bandwidth Product Note The Agilent Technologies 89400 series vector signal analyzers provide unmatched signal analysis
INTRODUCTION TO COMMUNICATION SYSTEMS AND TRANSMISSION MEDIA
 COMM.ENG INTRODUCTION TO COMMUNICATION SYSTEMS AND TRANSMISSION MEDIA 9/6/2014 LECTURES 1 Objectives To give a background on Communication system components and channels (media) A distinction between analogue
EE 186 LAB 2 FALL 2004. Network Analyzer Fundamentals and Two Tone Linearity
 Network Analyzer Fundamentals and Two Tone Linearity Name: Name: Name: Objective: To become familiar with the basic operation of a network analyzer To use the network analyzer to characterize the in-band
GSM/EDGE Output RF Spectrum on the V93000 Joe Kelly and Max Seminario, Verigy
 GSM/EDGE Output RF Spectrum on the V93000 Joe Kelly and Max Seminario, Verigy Introduction A key transmitter measurement for GSM and EDGE is the Output RF Spectrum, or ORFS. The basis of this measurement
Title: Low EMI Spread Spectrum Clock Oscillators
 Title: Low EMI oscillators Date: March 3, 24 TN No.: TN-2 Page 1 of 1 Background Title: Low EMI Spread Spectrum Clock Oscillators Traditional ways of dealing with EMI (Electronic Magnetic Interference)
Tx/Rx A high-performance FM receiver for audio and digital applicatons
 Tx/Rx A high-performance FM receiver for audio and digital applicatons This receiver design offers high sensitivity and low distortion for today s demanding high-signal environments. By Wayne C. Ryder
Understanding Mixers Terms Defined, and Measuring Performance
 Understanding Mixers Terms Defined, and Measuring Performance Mixer Terms Defined Statistical Processing Applied to Mixers Today's stringent demands for precise electronic systems place a heavy burden
2. The Vector Network Analyzer
 ECE 584 Laboratory Experiments 2. The Vector Network Analyzer Introduction: In this experiment we will learn to use a Vector Network Analyzer to measure the magnitude and phase of reflection and transmission
The Phase Modulator In NBFM Voice Communication Systems
 The Phase Modulator In NBFM Voice Communication Systems Virgil Leenerts 8 March 5 The phase modulator has been a point of discussion as to why it is used and not a frequency modulator in what are called
Vector Network Analyzer Techniques to Measure WR340 Waveguide Windows
 LS-296 Vector Network Analyzer Techniques to Measure WR340 Waveguide Windows T. L. Smith ASD / RF Group Advanced Photon Source Argonne National Laboratory June 26, 2002 Table of Contents 1) Introduction
MSB MODULATION DOUBLES CABLE TV CAPACITY Harold R. Walker and Bohdan Stryzak Pegasus Data Systems ( 5/12/06) [email protected]
 pegasusdat@aol.com") MSB MODULATION DOUBLES CABLE TV CAPACITY Harold R. Walker and Bohdan Stryzak Pegasus Data Systems ( 5/12/06) [email protected] Abstract: Ultra Narrow Band Modulation ( Minimum Sideband Modulation ) makes
MSB MODULATION DOUBLES CABLE TV CAPACITY Harold R. Walker and Bohdan Stryzak Pegasus Data Systems ( 5/12/06) [email protected] Abstract: Ultra Narrow Band Modulation ( Minimum Sideband Modulation ) makes
Introduction to Receivers
 Introduction to Receivers Purpose: translate RF signals to baseband Shift frequency Amplify Filter Demodulate Why is this a challenge? Interference (selectivity, images and distortion) Large dynamic range
Constructing a precision SWR meter and antenna analyzer. Mike Brink HNF, Design Technologist.
 Constructing a precision SWR meter and antenna analyzer. Mike Brink HNF, Design Technologist. Abstract. I have been asked to put together a detailed article on a SWR meter. In this article I will deal
Harmonics and Noise in Photovoltaic (PV) Inverter and the Mitigation Strategies
 Inverter and the Mitigation Strategies") Soonwook Hong, Ph. D. Michael Zuercher Martinson Harmonics and Noise in Photovoltaic (PV) Inverter and the Mitigation Strategies 1. Introduction PV inverters use semiconductor devices to transform the
Soonwook Hong, Ph. D. Michael Zuercher Martinson Harmonics and Noise in Photovoltaic (PV) Inverter and the Mitigation Strategies 1. Introduction PV inverters use semiconductor devices to transform the
Automatic compression measurement using network analyzers
 Automatic compression measurement using network analyzers Introduction The dynamic range of an amplifier is determined by noise figure and compression. In multi carrier applications third order intercept
Calculating Antenna System Return Loss As Viewed Through The RF Path
 Calculating Antenna System Return Loss As Viewed Through The RF Path Lou Meyer, Director of Technical Marketing December 2009 1. Introduction Return loss (RL), reflection coefficient (Γ) and voltage standing
Loop Bandwidth and Clock Data Recovery (CDR) in Oscilloscope Measurements. Application Note 1304-6
 in Oscilloscope Measurements. Application Note 1304-6") Loop Bandwidth and Clock Data Recovery (CDR) in Oscilloscope Measurements Application Note 1304-6 Abstract Time domain measurements are only as accurate as the trigger signal used to acquire them. Often
Loop Bandwidth and Clock Data Recovery (CDR) in Oscilloscope Measurements Application Note 1304-6 Abstract Time domain measurements are only as accurate as the trigger signal used to acquire them. Often
A Guide to Calibrating Your Spectrum Analyzer
 A Guide to Calibrating Your Application Note Introduction As a technician or engineer who works with electronics, you rely on your spectrum analyzer to verify that the devices you design, manufacture,
Agilent AN 1315 Optimizing RF and Microwave Spectrum Analyzer Dynamic Range. Application Note
 Agilent AN 1315 Optimizing RF and Microwave Spectrum Analyzer Dynamic Range Application Note Table of Contents 3 3 3 4 4 4 5 6 7 7 7 7 9 10 10 11 11 12 12 13 13 14 15 1. Introduction What is dynamic range?
ELEMENTS OF CABLE TELEVISION
 1 ELEMENTS OF CABLE TELEVISION Introduction Cable television, from its inception, developed in western countries into two separate systems called Master Antenna Television (MATV) and Community Cable Television
A Network Analyzer For Active Components
 A Network Analyzer For Active Components EEEfCom 29-30 Juni ULM Marc Vanden Bossche, NMDG Engineering Remi Tuijtelaars, BSW Copyright 2005 NMDG Engineering Version 2 Outline Review of S-parameters Theory
The front end of the receiver performs the frequency translation, channel selection and amplification of the signal.
 Many receivers must be capable of handling a very wide range of signal powers at the input while still producing the correct output. This must be done in the presence of noise and interference which occasionally
Power Amplifier Gain Compression Measurements
 Technical Brief Power Amplifier Gain Compression Measurements GPIB Private Bus Sweep Out Sweep In Pulse In AC Mod Out Blank/Marker Out Blanking In Overview The 1 db gain compression of an amplifier describes
RECOMMENDATION ITU-R BS.704 *, ** Characteristics of FM sound broadcasting reference receivers for planning purposes
 Rec. ITU-R BS.704 1 RECOMMENDATION ITU-R BS.704 *, ** Characteristics of FM sound broadcasting reference receivers for planning purposes (1990) The ITU Radiocommunication Assembly, considering a) that
Spectrum Analyzers And Network Analyzers. The Whats, Whys and Hows...
 Spectrum Analyzers And Network Analyzers The Whats, Whys and Hows... Bertrand Zauhar, VE2ZAZ [email protected] June 2010 Today's Program Definitions of Spectrum and Network Analyzers, Differences between
Improving Network Analyzer Measurements of Frequency-translating Devices Application Note 1287-7
 Improving Network Analyzer Measurements of Frequency-translating Devices Application Note 1287-7 - + - + - + - + Table of Contents Page Introduction......................................................................
Keysight Technical Training Catalog
 Keysight Technical Training Catalog Keysight provides a comprehensive portfolio of technical training courses that allow you to achieve the technical proficiency necessary to optimize the effectiveness
Making Accurate Voltage Noise and Current Noise Measurements on Operational Amplifiers Down to 0.1Hz
 Author: Don LaFontaine Making Accurate Voltage Noise and Current Noise Measurements on Operational Amplifiers Down to 0.1Hz Abstract Making accurate voltage and current noise measurements on op amps in
Electronic Communications Committee (ECC) within the European Conference of Postal and Telecommunications Administrations (CEPT)
 within the European Conference of Postal and Telecommunications Administrations (CEPT)") Page 1 Electronic Communications Committee (ECC) within the European Conference of Postal and Telecommunications Administrations (CEPT) ECC RECOMMENDATION (06)01 Bandwidth measurements using FFT techniques
Page 1 Electronic Communications Committee (ECC) within the European Conference of Postal and Telecommunications Administrations (CEPT) ECC RECOMMENDATION (06)01 Bandwidth measurements using FFT techniques
One Port Network Analyzer
 99 Washington Street Melrose, MA 02176 Phone 781-665-1400 Toll Free 1-800-517-8431 Visit us at www.testequipmentdepot.com One Port Network Analyzer 5.4GHz Impendance : 50Ω(75Ωconnectors via adapters) Test
Technical Datasheet Scalar Network Analyzer Model 8003-10 MHz to 40 GHz
 Technical Datasheet Scalar Network Analyzer Model 8003-10 MHz to 40 GHz The Giga-tronics Model 8003 Precision Scalar Network Analyzer combines a 90 db wide dynamic range with the accuracy and linearity
Broadband 101: Installation and Testing
 Broadband 101: Installation and Testing Fanny Mlinarsky Introduction Today the Internet is an information superhighway with bottlenecks at every exit. These congested exits call for the deployment of broadband
DDX 7000 & 8003. Digital Partial Discharge Detectors FEATURES APPLICATIONS
 DDX 7000 & 8003 Digital Partial Discharge Detectors The HAEFELY HIPOTRONICS DDX Digital Partial Discharge Detector offers the high accuracy and flexibility of digital technology, plus the real-time display
MEASUREMENT SET-UP FOR TRAPS
 Completed on 26th of June, 2012 MEASUREMENT SET-UP FOR TRAPS AUTHOR: IW2FND Attolini Lucio Via XXV Aprile, 52/B 26037 San Giovanni in Croce (CR) - Italy [email protected] Trappole_01_EN 1 1 DESCRIPTION...3
FILTERS - IN RADIO COMMUNICATIONS
 Reading 32 Ron Bertrand VK2DQ http://www.radioelectronicschool.com FILTERS - IN RADIO COMMUNICATIONS RADIO SIGNALS In radio communications we talk a lot about radio signals. A radio signal is a very broad
Making Spectrum Measurements with Rohde & Schwarz Network Analyzers
 Making Spectrum Measurements with Rohde & Schwarz Network Analyzers Application Note Products: R&S ZVA R&S ZVB R&S ZVT R&S ZNB This application note describes how to configure a Rohde & Schwarz Network
Audio processing and ALC in the FT-897D
 Audio processing and ALC in the FT-897D I recently bought an FT-897D, and after a period of operation noticed problems with what I perceived to be a low average level of output power and reports of muffled
Network Analyzer Operation
 Network Analyzer Operation 2004 ITTC Summer Lecture Series John Paden Purposes of a Network Analyzer Network analyzers are not about computer networks! Purposes of a Network Analyzer Measures S-parameters
Introduction to Network Analyzer Measurements
 Introduction to Network Analyzer Measurements Introduction to Network Analyzer Measurements 1 Table of Contents 1. Introduction to Network Analyzer Measurements... 3 VNA Basics...3 Applications for Network
Timing Errors and Jitter
 Timing Errors and Jitter Background Mike Story In a sampled (digital) system, samples have to be accurate in level and time. The digital system uses the two bits of information the signal was this big
Understanding Power Splitters
 Understanding Power Splitters How they work, what parameters are critical, and how to select the best value for your application. Basically, a 0 splitter is a passive device which accepts an input signal
1. The Slotted Line. ECE 584 Microwave Engineering Laboratory Experiments. Introduction:
 ECE 584 Microwave Engineering Laboratory Experiments 1. The Slotted Line Introduction: In this experiment we will use a waveguide slotted line to study the basic behavior of standing waves and to measure
DDX 7000 & 8003. Digital Partial Discharge Detectors FEATURES APPLICATIONS
 DDX 7000 & 8003 Digital Partial Discharge Detectors The HAEFELY HIPOTRONICS DDX Digital Partial Discharge Detector offers the high accuracy and flexibility of digital technology, plus the real-time display
Impedance Matching and Matching Networks. Valentin Todorow, December, 2009
 Impedance Matching and Matching Networks Valentin Todorow, December, 2009 RF for Plasma Processing - Definition of RF What is RF? The IEEE Standard Dictionary of Electrical and Electronics Terms defines
Germanium Diode AM Radio
 Germanium Diode AM Radio LAB 3 3.1 Introduction In this laboratory exercise you will build a germanium diode based AM (Medium Wave) radio. Earliest radios used simple diode detector circuits. The diodes
Laboratory #5: RF Filter Design
 EEE 194 RF Laboratory Exercise 5 1 Laboratory #5: RF Filter Design I. OBJECTIVES A. Design a third order low-pass Chebyshev filter with a cutoff frequency of 330 MHz and 3 db ripple with equal terminations
Agilent 8720 Family Microwave Vector Network Analyzers
 Agilent 8720 Family Microwave Vector Network Analyzers Product Overview High-Performance Solutions for Your Measurement Challenges Now more choices for solving your measurement challenges What's new in
S-Band Low Noise Amplifier Using the ATF-10136. Application Note G004
 S-Band Low Noise Amplifier Using the ATF-10136 Application Note G004 Introduction This application note documents the results of using the ATF-10136 in low noise amplifier applications at S band. The ATF-10136
A wave lab inside a coaxial cable
 INSTITUTE OF PHYSICS PUBLISHING Eur. J. Phys. 25 (2004) 581 591 EUROPEAN JOURNAL OF PHYSICS PII: S0143-0807(04)76273-X A wave lab inside a coaxial cable JoãoMSerra,MiguelCBrito,JMaiaAlves and A M Vallera
MAINTENANCE & ADJUSTMENT
 MAINTENANCE & ADJUSTMENT Circuit Theory The concept of PLL system frequency synthesization is not of recent development, however, it has not been a long age since the digital theory has been couplet with
EECC694 - Shaaban. Transmission Channel
 The Physical Layer: Data Transmission Basics Encode data as energy at the data (information) source and transmit the encoded energy using transmitter hardware: Possible Energy Forms: Electrical, light,
EMC STANDARDS STANDARDS AND STANDARD MAKING BODIES. International. International Electrotechnical Commission (IEC) http://www.iec.
 http://www.iec.") EMC STANDARDS The EMC standards that a particular electronic product must meet depend on the product application (commercial or military) and the country in which the product is to be used. These EMC regulatory
EMC STANDARDS The EMC standards that a particular electronic product must meet depend on the product application (commercial or military) and the country in which the product is to be used. These EMC regulatory
Michael Hiebel. Fundamentals of Vector Network Analysis
 Michael Hiebel Fundamentals of Vector Network Analysis TABIH OF CONTENTS Table of contents 1 Introduction 12 1.1 What is a network analyzer? 12 1.2 Wave quantities and S-parameters 13 1.3 Why vector network
SIGNAL GENERATORS and OSCILLOSCOPE CALIBRATION
 1 SIGNAL GENERATORS and OSCILLOSCOPE CALIBRATION By Lannes S. Purnell FLUKE CORPORATION 2 This paper shows how standard signal generators can be used as leveled sine wave sources for calibrating oscilloscopes.
An octave bandwidth dipole antenna
 An octave bandwidth dipole antenna Abstract: Achieving wideband performance from resonant structures is challenging because their radiation properties and impedance characteristics are usually sensitive
Jeff Thomas Tom Holmes Terri Hightower. Learn RF Spectrum Analysis Basics
 Jeff Thomas Tom Holmes Terri Hightower Learn RF Spectrum Analysis Basics Learning Objectives Name the major measurement strengths of a swept-tuned spectrum analyzer Explain the importance of frequency
Understanding SWR by Example
 Understanding SWR by Example Take the mystery and mystique out of standing wave ratio. Darrin Walraven, K5DVW It sometimes seems that one of the most mysterious creatures in the world of Amateur Radio
MATRIX TECHNICAL NOTES
 200 WOOD AVENUE, MIDDLESEX, NJ 08846 PHONE (732) 469-9510 FAX (732) 469-0418 MATRIX TECHNICAL NOTES MTN-107 TEST SETUP FOR THE MEASUREMENT OF X-MOD, CTB, AND CSO USING A MEAN SQUARE CIRCUIT AS A DETECTOR
TCOM 370 NOTES 99-4 BANDWIDTH, FREQUENCY RESPONSE, AND CAPACITY OF COMMUNICATION LINKS
 TCOM 370 NOTES 99-4 BANDWIDTH, FREQUENCY RESPONSE, AND CAPACITY OF COMMUNICATION LINKS 1. Bandwidth: The bandwidth of a communication link, or in general any system, was loosely defined as the width of
AN1200.04. Application Note: FCC Regulations for ISM Band Devices: 902-928 MHz. FCC Regulations for ISM Band Devices: 902-928 MHz
 AN1200.04 Application Note: FCC Regulations for ISM Band Devices: Copyright Semtech 2006 1 of 15 www.semtech.com 1 Table of Contents 1 Table of Contents...2 1.1 Index of Figures...2 1.2 Index of Tables...2
Agilent AN 1316 Optimizing Spectrum Analyzer Amplitude Accuracy
 Agilent AN 1316 Optimizing Spectrum Analyzer Amplitude Accuracy Application Note RF & Microwave Spectrum Analyzers Table of Contents 3 3 4 4 5 7 8 8 13 13 14 16 16 Introduction Absolute versus relative
Shielding Effectiveness Test Method. Harbour s LL, SB, and SS Coaxial Cables. Designs for Improved Shielding Effectiveness
 Shielding Effectiveness Test Method Harbour s LL, SB, and SS Coaxial Cables Designs for Improved Shielding Effectiveness Harbour Industries 4744 Shelburne Road Shelburne Vermont 05482 USA 802-985-3311
Understanding Power Splitters
 Understanding Power Splitters how they work, what parameters are critical, and how to select the best value for your application. Basically, a 0 splitter is a passive device which accepts an input signal
THERMAL ANEMOMETRY ELECTRONICS, SOFTWARE AND ACCESSORIES
 TSI and TSI logo are registered trademarks of TSI Incorporated. SmartTune is a trademark of TSI Incorporated. THERMAL ANEMOMETRY ELECTRONICS, SOFTWARE AND ACCESSORIES IFA 300 Constant Temperature Anemometry
F = S i /N i S o /N o
 Noise figure Many receiver manufacturers specify the performance of their receivers in terms of noise figure, rather than sensitivity. As we shall see, the two can be equated. A spectrum analyzer is a
Techniques for Precise Cable and Antenna Measurements in the Field
 Techniques for Precise Cable and Antenna Measurements in the Field Using FieldFox handheld analyzers Application Note This application note introduces the practical aspects of cable and antenna testing,
Welcome. Rulon VanDyke RF System Architect, Agilent Technologies. David Leiss Senior RF Simulation Consultant, Agilent Technologies
 Welcome Rulon VanDyke RF System Architect, Agilent Technologies David Leiss Senior RF Simulation Consultant, Agilent Technologies January 12, 2012 Agenda RF Architecture Definition Costs of Poor Architecture
MODULATION Systems (part 1)
") Technologies and Services on Digital Broadcasting (8) MODULATION Systems (part ) "Technologies and Services of Digital Broadcasting" (in Japanese, ISBN4-339-62-2) is published by CORONA publishing co.,
Technologies and Services on Digital Broadcasting (8) MODULATION Systems (part ) "Technologies and Services of Digital Broadcasting" (in Japanese, ISBN4-339-62-2) is published by CORONA publishing co.,
Agilent 8753ET/8753ES Network Analyzers
 Agilent 8753ET/8753ES Network Analyzers 8753ET, 300 khz to 3 or 6 GHz 8753ES, 30 khz to 3 or 6 GHz Configuration Guide System configuration summary The following summary lists the main components required
APPLICATION NOTES POWER DIVIDERS. Things to consider
 Internet Copy Rev A Overview Various RF applications require power to be distributed among various paths. The simplest way this can be done is by using a power splitter/divider. Power dividers are reciprocal
DSA800 Series Spectrum Analyzer
 DSA800 Series Spectrum Analyzer Configuration Guide This guide is used to help users to configure DSA800 series spectrum analyzer according to their requirements. You can get an overall understanding of
PCM Encoding and Decoding:
 PCM Encoding and Decoding: Aim: Introduction to PCM encoding and decoding. Introduction: PCM Encoding: The input to the PCM ENCODER module is an analog message. This must be constrained to a defined bandwidth
R&S FSW signal and spectrum analyzer: best in class now up to 50 GHz
 R&S FSW signal and spectrum analyzer: best in class now up to 50 GHz The new R&S FSW 43 and R&S FSW 50 signal and spectrum analyzers make the outstanding features of the R&S FSW family available now also
Selecting Receiving Antennas for Radio Tracking
 Selecting Receiving Antennas for Radio Tracking Larry B Kuechle, Advanced Telemetry Systems, Inc. Isanti, Minnesota 55040 [email protected] The receiving antenna is an integral part of any radio location
AM Radio Field Strength Measurements with Confidence November 2004
 AM Radio Field Strength Measurements with Confidence November 2004 Understanding the AM Broadcast signal The AM Broadcast service in the United States and many other countries is implemented in 10 khz
RECOMMENDATION ITU-R BS.644-1 *,** Audio quality parameters for the performance of a high-quality sound-programme transmission chain
 Rec. ITU-R BS.644-1 1 RECOMMENDATION ITU-R BS.644-1 *,** Audio quality parameters for the performance of a high-quality sound-programme transmission chain (1986-1990) The ITU Radiocommunication Assembly,