Network Analyzer Operation
|
|
|
- Sherilyn Leonard
- 8 years ago
- Views:
Transcription
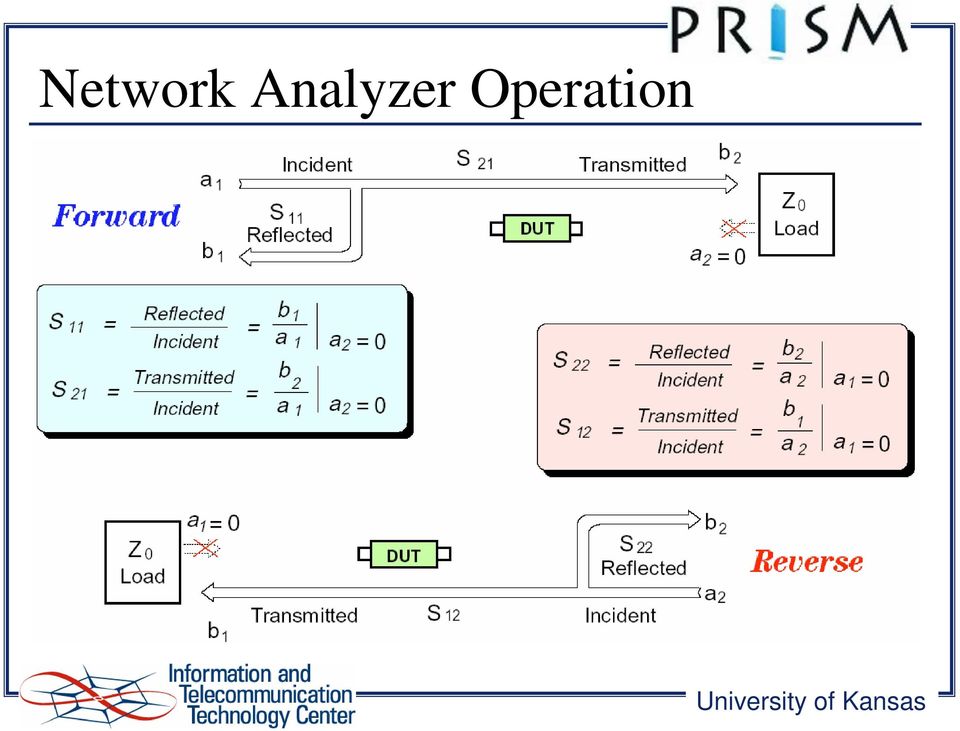
1 Network Analyzer Operation 2004 ITTC Summer Lecture Series John Paden

2 Purposes of a Network Analyzer Network analyzers are not about computer networks!

3 Purposes of a Network Analyzer Measures S-parameters of electronic devices. E.g. Filters, amplifiers, mixers, switches, antennas, etc. S-parameters are complex numbers (i.e. amplitude and phase) S-parameters are a generalization of the idea of the transfer function. Remember transfer functions from EECS 360 (signal analysis course) The transfer function of a device does not include information about the input and output impedance of a device. Therefore it does not tell you how the device will behave when connected to other components. Network analyzers are similar to continuous wave (CW) radar systems These two systems share many features.

4 Terminology The device or system to be tested is referred to as the DUT or Device Under Test. The test fixture refers to the system outside of the network analyzer that is connected to the DUT. While the test fixture is part of what the network analyzer measures, we ultimately want to measure the DUT by itself. Most of the time, the test fixture is just a pair of cables used to connect the network analyzer to the device. LTIV stands for Linear Time-Invariant.

5 Overview of NA Operation The network analyzer measures in the frequency domain. The network analyzer transmits a sinusoid into the test fixture with a known frequency, amplitude, and phase. The network receives the amplitude and phase of one frequency from the output of the test fixture. The transmitted and received sinusoids do not have to be the same frequency. For most measurements the frequencies are the same.

6 Linear Time-Invariant Devices A device is called LTIV if its operation can be explained by convolution. This means that the output signal is based on a infinite summation of scaled and time-delayed versions of the input signal. The coefficients in this infinite summation never change. Now think about what happens when you have an infinite summation of scaled and time-delayed version of a single sinusoid. After all the summations you will end up with a sinusoid of the same frequency. Its phase and amplitude (which completely characterize it) are determined by the summations.

7 Network Analyzer Operation R cos jθ R ( 2π ft + θ ) = R e R * Incident, reflected, and transmitted fields are sinusoids Acos jθ A ( 2π ft + θ ) = Ae A B cos jθ B ( 2π ft + θ ) = B e B A R e jθ θ A R B R e jθ θ B R
 = B e B A R e jθ θ A R B R e jθ θ B R")
8 Network Analyzer Operation
9 Taking a Measurement: Start/Stop Freq Decide at which frequencies you want to know how your device performs. Set your network analyzer s start and stop frequencies. If you plan to timegate or process the data add some guard room on each side (i.e. make your start frequency a little lower and your stop frequency a little higher). PRISM SAR example: We have a Low Pass Filter (LPF) with a cutoff frequency of 90 MHz. We want to know what its passband behavior is and its stopband behavior at 450 to 470 MHz where the GPS telemetry radio link operates. We will want to measure the device from near DC up to 500 MHz. Suggest using HP 8753D (300 khz-6 GHz) start frequency: 300 khz stop frequency: 500 MHz

10 Taking a Measurement: # of points Determine the maximum length of the impulse response. PRISM SAR example: Continuing are LPF example, let us assume that we have a total of 2 meters of cable with a velocity factor of 69.5% and the LPF has four sections. We want to include up to 10 reflections through the system. Total time: ns e8 90e6 =

11 Taking a measurement: # of points We know the bandwidth (BW) of our measurement: BW = stop frequency start frequency = 500 MHz We know the maximum length of the impulse response that we are interested in: 511 ns We can now calculate the number of points in the frequency domain we must sample at: 511 ns 500 MHz 511 ns = = 256 pts 2 ns 401 pts

12 Taking a measurement: Transmit Power We want to measure the stopband attenuation down to 90 db with 16 db SNR. Our low pass filter is high-power so we can transmit at the highest power the network analyzer provides: 10 dbm transmit power. The signal power with 90 db of attenuation is then -80 dbm. To achieve the desired 16 db SNR, the noise floor must be 96 dbm. Using a noise figure of 53 db for the network analyzer, the input noise power is: P Noise = 10log10( ktbf ) + 30 = 10log10( kt ) + 10log10( B) + 10log10( F ) = log10( B) = log ( B) K = Boltzmann s Constant (1.38e-23) T = IEEE ref. Temp. (290 K) B = receiver bandwidth F = Receiver noise figure (53 db)
 + 30 = 10log10( kt ) + 10log10( B) + 10log10( F ) = 204 + 10log10(")
13 Taking a Measurement: IF Bandwidth To achieve an SNR of 16 db, we need to set our receiver bandwidth so that 10Log 10 (B) is 25 db or less. Therefore B needs to be 300 Hz. The network analyzer calls receiver bandwidth IF bandwidth where IF stands for intermediate frequency.

14 Taking a Measurement: Averages Suppose we wanted to use an IF bandwidth of Hz (now 10Log 10 (B) = 40 db). Another way to increase the SNR to the appropriate level would be to average 40 measurements. This effectively uses forty times the energy (similar to increasing the power by 16 db). The whole equation becomes: SNR = 10log10( P) + 10log10( N ) 10log10( L) 10log10( ktbf ) where P = transmit power in Watts, N = number of averages, and L = loss of DUT.
 + 10log10( N ) 10log10( L) 10log10( ktbf ) where P = transmit power")
15 Taking a Measurement: Sweep Time In Sweep Mode (as opposed to stepped mode), the network analyzer transmits a linear chirp in sweep mode Voltage 0 Freq (MHz) Time (us) Time (us)
 7 6 5-0.5 4 3-1 0 0.5 1 1.")
16 Taking a Measurement: Sweep Time Sweep Time: The time it takes the network analyzer to measure all of its frequencies. IF Bandwidth Impulse Response Delay τ Stop Frequency Frequency Sweep Time Incident Signal f Reflected Signal Start Frequency BW 0 sec Time τ sec

17 Taking a Measurement: Sweep Time Stop Frequency Sweep Time Frequency Incident Signal Reflected Signal f Start Frequency BW 0 sec Time τ sec Solution: Stop Frequency Sweep Time Increase Sweep Time Frequency Start Frequency Incident Signal BW f Reflected Signal 0 sec Time τ sec

18 Taking a Measurement: Sweep Time Closer Look: We have set our network analyzer to 401 points. At each point, the network analyzer waits 1/300 seconds (that is the typical group delay through a filter with a bandwidth of 300 Hz). The impulse response is 511 ns long at most. Therefore the sweep rate is: 500 MHz pts 300 sec MHz nsec = 191 Hz < 300 Hz sec = 374 The change in frequency during the impulse response is: MHz sec

19 Taking a Measurement: Sweep Time The sweep time is always okay if you are properly sampling the frequency domain!

20 References Ballo, David, Network Analyzer Basics, Back-to- Basics Seminar, Hewlett-Packard Company, HP 8753D User Guide, Hewlett-Packard Company. HP 8720 User Guide, Hewlett-Packard Company.

21 Example PRISM SAR example: We want to measure our antennas. There is a total of 100 meters of cable, all with a velocity factor of 75%. The separation between the two antennas is 30 meters and the longest multipath expected is 80 meters. The frequencies of interest are MHz. The antennas will receive noise power from radio stations (GIVE LEVEL HERE). The 1 db compression point of the transmit amplifier is 25 dbm and it has 35 db of gain.
22 Example Determine start and stop frequency Determine transmit power Determine number of points Determine IF bandwidth and averaging Calibrate network analyzer Save calibration Take measurements
23 DUT Example Filters The local Sunflower cable network uses approximately 1 GHz of bandwidth on their cable network. Each channel occupies 5.5 MHz of this bandwidth. Sunflower offers several options: basic, unlimited, data, etc. The channels that come with the basic package are grouped into the lower part of the spectrum. Therefore, subscribers to the basic service have a low pass filter placed on the cable into their house. The channels used for data are grouped in the upper part of the spectrum. These subscribers have a high pass filter placed on the cable into their house.
24 Network Analyzer (Simplified) VtSine SRC1 Vdc=0 V Amplitude=1 V Freq=1 MHz Delay=0 nsec Damping=0 Phase=0 R R2 R=50 Ohm R R5 R=50 Ohm ISO -90 CouplerDual Directional_Coupler Coupling=6 db IN 0 R_incident Hybrid90 HYB2 Loss=3.1 db GainBal=0 db PhaseBal=90 A_reflected PwrSplit2 PWR1 S21=0.707 S31=0.707 R R1 R=50 Ohm C C1 C=1 nf I_channel Mixer I_Channel LPF_Gaussian IF_Filter_Ichan Fpass=10 khz Apass=2 db GDpass=0.9 R R3 R=50 Ohm Q_channel Mixer Q_Channel LPF_Gaussian IF_Filter_Qchan Fpass=10 khz Apass=2 db GDpass=0.9 R R4 R=50 Ohm
Impedance 50 (75 connectors via adapters)
") VECTOR NETWORK ANALYZER PLANAR TR1300/1 DATA SHEET Frequency range: 300 khz to 1.3 GHz Measured parameters: S11, S21 Dynamic range of transmission measurement magnitude: 130 db Measurement time per point:
VECTOR NETWORK ANALYZER PLANAR TR1300/1 DATA SHEET Frequency range: 300 khz to 1.3 GHz Measured parameters: S11, S21 Dynamic range of transmission measurement magnitude: 130 db Measurement time per point:
Agilent AN 1316 Optimizing Spectrum Analyzer Amplitude Accuracy
 Agilent AN 1316 Optimizing Spectrum Analyzer Amplitude Accuracy Application Note RF & Microwave Spectrum Analyzers Table of Contents 3 3 4 4 5 7 8 8 13 13 14 16 16 Introduction Absolute versus relative
Agilent PN 8753-1 RF Component Measurements: Amplifier Measurements Using the Agilent 8753 Network Analyzer. Product Note
 Agilent PN 8753-1 RF Component Measurements: Amplifier Measurements Using the Agilent 8753 Network Analyzer Product Note 2 3 4 4 4 4 6 7 8 8 10 10 11 12 12 12 13 15 15 Introduction Table of contents Introduction
T = 1 f. Phase. Measure of relative position in time within a single period of a signal For a periodic signal f(t), phase is fractional part t p
, phase is fractional part t p") Data Transmission Concepts and terminology Transmission terminology Transmission from transmitter to receiver goes over some transmission medium using electromagnetic waves Guided media. Waves are guided
Data Transmission Concepts and terminology Transmission terminology Transmission from transmitter to receiver goes over some transmission medium using electromagnetic waves Guided media. Waves are guided
MEASUREMENT UNCERTAINTY IN VECTOR NETWORK ANALYZER
 MEASUREMENT UNCERTAINTY IN VECTOR NETWORK ANALYZER W. Li, J. Vandewege Department of Information Technology (INTEC) University of Gent, St.Pietersnieuwstaat 41, B-9000, Gent, Belgium Abstract: Precision
Performing Amplifier Measurements with the Vector Network Analyzer ZVB
 Product: Vector Network Analyzer R&S ZVB Performing Amplifier Measurements with the Vector Network Analyzer ZVB Application Note This document describes typical measurements that are required to be made
Application Note Noise Frequently Asked Questions
 : What is? is a random signal inherent in all physical components. It directly limits the detection and processing of all information. The common form of noise is white Gaussian due to the many random
RF Communication System. EE 172 Systems Group Presentation
 RF Communication System EE 172 Systems Group Presentation RF System Outline Transmitter Components Receiver Components Noise Figure Link Budget Test Equipment System Success Design Remedy Transmitter Components
MATRIX TECHNICAL NOTES
 200 WOOD AVENUE, MIDDLESEX, NJ 08846 PHONE (732) 469-9510 FAX (732) 469-0418 MATRIX TECHNICAL NOTES MTN-107 TEST SETUP FOR THE MEASUREMENT OF X-MOD, CTB, AND CSO USING A MEAN SQUARE CIRCUIT AS A DETECTOR
A Network Analyzer For Active Components
 A Network Analyzer For Active Components EEEfCom 29-30 Juni ULM Marc Vanden Bossche, NMDG Engineering Remi Tuijtelaars, BSW Copyright 2005 NMDG Engineering Version 2 Outline Review of S-parameters Theory
F = S i /N i S o /N o
 Noise figure Many receiver manufacturers specify the performance of their receivers in terms of noise figure, rather than sensitivity. As we shall see, the two can be equated. A spectrum analyzer is a
ECE 435 INTRODUCTION TO THE MICROWAVE NETWORK ANALYZER
 ECE 435 INTRODUCTION TO THE MICROWAVE NETWORK ANALYZER Latest revision: October 1999 Introduction A vector network analyzer (VNA) is a device capable of measuring both the magnitude and phase of a sinusoidal
VME IF PHASE MODULATOR UNIT. mod. 205-01
 mod. 205-01 02/06 B 1/12 INDEX 1 DESCRIPTION pg. 3 2 FRONT VIEW pg. 4-5 3 TECHNICAL CHARACTERISTICS pg. 6-7 4 OPERATING INSTRUCTIONS pg. 8 5 ANNEX LIST pg. 12 02/06 B 2/12 1 - DESCRIPTION The PHASE MODULATOR
RF Network Analyzer Basics
 RF Network Analyzer Basics A tutorial, information and overview about the basics of the RF Network Analyzer. What is a Network Analyzer and how to use them, to include the Scalar Network Analyzer (SNA),
Agilent 10 Hints for Making Better Network Analyzer Measurements. Application Note 1291-1B
 Agilent 10 Hints for Making Better Network Analyzer Measurements Application Note 1291-1B Contents HINT 1. Measuring high-power amplifiers HINT 2. Compensating for time delay in cable HINT 3. Improving
Keysight Technologies Understanding the Fundamental Principles of Vector Network Analysis. Application Note
 Keysight Technologies Understanding the Fundamental Principles of Vector Network Analysis Application Note Introduction Network analysis is the process by which designers and manufacturers measure the
Jeff Thomas Tom Holmes Terri Hightower. Learn RF Spectrum Analysis Basics
 Jeff Thomas Tom Holmes Terri Hightower Learn RF Spectrum Analysis Basics Agenda Overview: Spectrum analysis and its measurements Theory of Operation: Spectrum analyzer hardware Frequency Specifications
Introduction to Receivers
 Introduction to Receivers Purpose: translate RF signals to baseband Shift frequency Amplify Filter Demodulate Why is this a challenge? Interference (selectivity, images and distortion) Large dynamic range
Jeff Thomas Tom Holmes Terri Hightower. Learn RF Spectrum Analysis Basics
 Jeff Thomas Tom Holmes Terri Hightower Learn RF Spectrum Analysis Basics Learning Objectives Name the major measurement strengths of a swept-tuned spectrum analyzer Explain the importance of frequency
1. The Slotted Line. ECE 584 Microwave Engineering Laboratory Experiments. Introduction:
 ECE 584 Microwave Engineering Laboratory Experiments 1. The Slotted Line Introduction: In this experiment we will use a waveguide slotted line to study the basic behavior of standing waves and to measure
0HDVXULQJWKHHOHFWULFDOSHUIRUPDQFH FKDUDFWHULVWLFVRI5),)DQGPLFURZDYHVLJQDO SURFHVVLQJFRPSRQHQWV
,)DQGPLFURZDYHVLJQDO SURFHVVLQJFRPSRQHQWV") 0HDVXULQJWKHHOHFWULFDOSHUIRUPDQFH FKDUDFWHULVWLFVRI5),)DQGPLFURZDYHVLJQDO SURFHVVLQJFRPSRQHQWV The treatment given here is introductory, and will assist the reader who wishes to consult the standard texts
0HDVXULQJWKHHOHFWULFDOSHUIRUPDQFH FKDUDFWHULVWLFVRI5),)DQGPLFURZDYHVLJQDO SURFHVVLQJFRPSRQHQWV The treatment given here is introductory, and will assist the reader who wishes to consult the standard texts
Improving Network Analyzer Measurements of Frequency-translating Devices Application Note 1287-7
 Improving Network Analyzer Measurements of Frequency-translating Devices Application Note 1287-7 - + - + - + - + Table of Contents Page Introduction......................................................................
GSM frequency planning
 GSM frequency planning Band : 890-915 and 935-960 MHz Channel spacing: 200 khz (but signal bandwidth = 400 khz) Absolute Radio Frequency Channel Number (ARFCN) lower band: upper band: F l (n) = 890.2 +
Data Transmission. Data Communications Model. CSE 3461 / 5461: Computer Networking & Internet Technologies. Presentation B
 CSE 3461 / 5461: Computer Networking & Internet Technologies Data Transmission Presentation B Kannan Srinivasan 08/30/2012 Data Communications Model Figure 1.2 Studying Assignment: 3.1-3.4, 4.1 Presentation
Experiment 7: Familiarization with the Network Analyzer
 Experiment 7: Familiarization with the Network Analyzer Measurements to characterize networks at high frequencies (RF and microwave frequencies) are usually done in terms of scattering parameters (S parameters).
Conquering Noise for Accurate RF and Microwave Signal Measurements. Presented by: Ernie Jackson
 Conquering Noise for Accurate RF and Microwave Signal Measurements Presented by: Ernie Jackson The Noise Presentation Review of Basics, Some Advanced & Newer Approaches Noise in Signal Measurements-Summary
Test Report: Yaesu FTDX-1200, S/N 3F02051 (loaned by Bill Trippett W7VP)
") Test Report: Yaesu FTDX-1200, S/N 3F02051 (loaned by Bill Trippett W7VP) Adam M. Farson VA7OJ/AB4OJ, 19-21 July 2013 1. Introduction and Scope: The following tests were conducted on the FTDX-1200: A. Receiver
Test Report: Yaesu FTDX-1200, S/N 3F02051 (loaned by Bill Trippett W7VP) Adam M. Farson VA7OJ/AB4OJ, 19-21 July 2013 1. Introduction and Scope: The following tests were conducted on the FTDX-1200: A. Receiver
AN1200.04. Application Note: FCC Regulations for ISM Band Devices: 902-928 MHz. FCC Regulations for ISM Band Devices: 902-928 MHz
 AN1200.04 Application Note: FCC Regulations for ISM Band Devices: Copyright Semtech 2006 1 of 15 www.semtech.com 1 Table of Contents 1 Table of Contents...2 1.1 Index of Figures...2 1.2 Index of Tables...2
Advanced Nonlinear Device Characterization Utilizing New Nonlinear Vector Network Analyzer and X-parameters
 Advanced Nonlinear Device Characterization Utilizing New Nonlinear Vector Network Analyzer and X-parameters presented by: Loren Betts Research Scientist Presentation Outline Nonlinear Vector Network Analyzer
Agilent AN 1315 Optimizing RF and Microwave Spectrum Analyzer Dynamic Range. Application Note
 Agilent AN 1315 Optimizing RF and Microwave Spectrum Analyzer Dynamic Range Application Note Table of Contents 3 3 3 4 4 4 5 6 7 7 7 7 9 10 10 11 11 12 12 13 13 14 15 1. Introduction What is dynamic range?
A Low Frequency Adapter for your Vector Network Analyzer (VNA)
") Jacques Audet, VE2AZX 7525 Madrid St, Brossard, QC, Canada J4Y G3: jacaudet@videotron.ca A Low Frequency Adapter for your Vector Network Analyzer (VNA) This compact and versatile unit extends low frequency
Jacques Audet, VE2AZX 7525 Madrid St, Brossard, QC, Canada J4Y G3: jacaudet@videotron.ca A Low Frequency Adapter for your Vector Network Analyzer (VNA) This compact and versatile unit extends low frequency
High Power Amplifier Measurements Using Agilent s Nonlinear Vector Network Analyzer
 High Power Amplifier Measurements Using Agilent s Nonlinear Vector Network Analyzer Application Note 1408-19 Table of Contents Introduction...2 PNA-X Performance...3 Hardware Setup...6 Setup Examples...12
Department of Electrical and Computer Engineering Ben-Gurion University of the Negev. LAB 1 - Introduction to USRP
 Department of Electrical and Computer Engineering Ben-Gurion University of the Negev LAB 1 - Introduction to USRP - 1-1 Introduction In this lab you will use software reconfigurable RF hardware from National
Optimizing IP3 and ACPR Measurements
 Optimizing IP3 and ACPR Measurements Table of Contents 1. Overview... 2 2. Theory of Intermodulation Distortion... 2 3. Optimizing IP3 Measurements... 4 4. Theory of Adjacent Channel Power Ratio... 9 5.
Keysight Technologies 8 Hints for Better Spectrum Analysis. Application Note
 Keysight Technologies 8 Hints for Better Spectrum Analysis Application Note The Spectrum Analyzer The spectrum analyzer, like an oscilloscope, is a basic tool used for observing signals. Where the oscilloscope
Propagation Channel Emulator ECP_V3
 Navigation simulators Propagation Channel Emulator ECP_V3 1 Product Description The ECP (Propagation Channel Emulator V3) synthesizes the principal phenomena of propagation occurring on RF signal links
Basics of RF Amplifier Measurements with the E5072A ENA Series Network Analyzer
 Basics of RF Amplifier Measurements with the E5072A ENA Series Network Analyzer Application Note Introduction The RF power amplifier is a key component used in a wide variety of industries such as wireless
Noise Figure Measurement without a Noise Source on a Vector Network Analyzer
 Noise Figure Measurement without a Noise Source on a Vector Network Analyzer Application Note Products: &S ZVA &S ZVT &S ZVAB-K30 &S NP-Z55 This application note describes the noise figure measurement
Using Spectrum Analyzers For Signal Monitoring
 Using Spectrum Analyzers For Signal Monitoring Presented by: 3 March 004 1 1 At the completion of this module you will have an understanding of how commercially available spectrum analyzers can be used
INTRODUCTION TO COMMUNICATION SYSTEMS AND TRANSMISSION MEDIA
 COMM.ENG INTRODUCTION TO COMMUNICATION SYSTEMS AND TRANSMISSION MEDIA 9/6/2014 LECTURES 1 Objectives To give a background on Communication system components and channels (media) A distinction between analogue
One Port Network Analyzer
 99 Washington Street Melrose, MA 02176 Phone 781-665-1400 Toll Free 1-800-517-8431 Visit us at www.testequipmentdepot.com One Port Network Analyzer 5.4GHz Impendance : 50Ω(75Ωconnectors via adapters) Test
R&S ZNBT8 Vector Network Analyzer Specifications
 ZNBT8_dat-sw_en_3606-9727-22_v0200_cover.indd 1 Data Sheet 02.00 Test & Measurement R&S ZNBT8 Vector Network Analyzer Specifications 20.05.2014 08:39:42 CONTENTS Definitions... 3 Measurement range... 4
Michael Hiebel. Fundamentals of Vector Network Analysis
 Michael Hiebel Fundamentals of Vector Network Analysis TABIH OF CONTENTS Table of contents 1 Introduction 12 1.1 What is a network analyzer? 12 1.2 Wave quantities and S-parameters 13 1.3 Why vector network
UNDERSTANDING NOISE PARAMETER MEASUREMENTS (AN-60-040)
") UNDERSTANDING NOISE PARAMETER MEASUREMENTS (AN-60-040 Overview This application note reviews noise theory & measurements and S-parameter measurements used to characterize transistors and amplifiers at
UNDERSTANDING NOISE PARAMETER MEASUREMENTS (AN-60-040 Overview This application note reviews noise theory & measurements and S-parameter measurements used to characterize transistors and amplifiers at
The front end of the receiver performs the frequency translation, channel selection and amplification of the signal.
 Many receivers must be capable of handling a very wide range of signal powers at the input while still producing the correct output. This must be done in the presence of noise and interference which occasionally
Visual System Simulator White Paper
 Visual System Simulator White Paper UNDERSTANDING AND CORRECTLY PREDICTING CRITICAL METRICS FOR WIRELESS RF LINKS Understanding and correctly predicting cellular, radar, or satellite RF link performance
Agilent 8720 Family Microwave Vector Network Analyzers
 Agilent 8720 Family Microwave Vector Network Analyzers Product Overview High-Performance Solutions for Your Measurement Challenges Now more choices for solving your measurement challenges What's new in
Understanding the Fundamental Principles of Vector Network Analysis. Application Note 1287-1. Table of Contents. Page
 Understanding the Fundamental Principles of Vector Network Analysis Application Note 1287-1 Table of Contents Page Introduction 2 Measurements in Communications Systems 2 Importance of Vector Measurements
Agilent N8973A, N8974A, N8975A NFA Series Noise Figure Analyzers. Data Sheet
 Agilent N8973A, N8974A, N8975A NFA Series Noise Figure Analyzers Data Sheet Specifications Specifications are only valid for the stated operating frequency, and apply over 0 C to +55 C unless otherwise
Automatic compression measurement using network analyzers
 Automatic compression measurement using network analyzers Introduction The dynamic range of an amplifier is determined by noise figure and compression. In multi carrier applications third order intercept
EECC694 - Shaaban. Transmission Channel
 The Physical Layer: Data Transmission Basics Encode data as energy at the data (information) source and transmit the encoded energy using transmitter hardware: Possible Energy Forms: Electrical, light,
APSYN420A/B Specification 1.24. 0.65-20.0 GHz Low Phase Noise Synthesizer
 APSYN420A/B Specification 1.24 0.65-20.0 GHz Low Phase Noise Synthesizer 1 Introduction The APSYN420 is a wideband low phase-noise synthesizer operating from 0.65 to 20 GHz. The nominal output power is
Agilent E4401B, E4402B, E4404B, E4405B, and E4407B ESA-E Series Spectrum Analyzers
 Agilent, E4402B, E4404B, E4405B, and E4407B ESA-E Series Spectrum Analyzers Technical Specifications All specifications apply over 0 C to + 55 C unless otherwise noted. The analyzer will meet its specifications
Technical Overview with Self-Guided Demonstration
 Agilent PSA Series Spectrum Analyzers External Source Control Measurement Personality, Option 215 Technical Overview with Self-Guided Demonstration Expand your PSA Series from spectrum analysis to scaler
2398 9 khz to 2.7 GHz Spectrum Analyzer
 Spectrum Analyzers 2398 9 khz to 2.7 GHz Spectrum Analyzer A breakthrough in high performance spectrum analysis, combining cost effectiveness and portability in a new lightweight instrument 9 khz to 2.7
Antenna Deployment Technical Brief
 ProCurve Networking Antenna Deployment Technical Brief Introduction... 2 Antenna types... 2 Omni directional antennas... 2 Directional antennas... 2 Diversity antennas... 3 High gain directional antennas...
SIGNAL GENERATORS and OSCILLOSCOPE CALIBRATION
 1 SIGNAL GENERATORS and OSCILLOSCOPE CALIBRATION By Lannes S. Purnell FLUKE CORPORATION 2 This paper shows how standard signal generators can be used as leveled sine wave sources for calibrating oscilloscopes.
Application Note Receiving HF Signals with a USRP Device Ettus Research
 Application Note Receiving HF Signals with a USRP Device Ettus Research Introduction The electromagnetic (EM) spectrum between 3 and 30 MHz is commonly referred to as the HF band. Due to the propagation
Network analyzer and spectrum analyzer two in one
 R&S ZVL Vector Network Analyzer Network analyzer and spectrum analyzer two in one The R&S ZVL is the lightest and smallest vector network analyzer in its class. On top of this, it can be used as a full-featured
RF Measurements Using a Modular Digitizer
 RF Measurements Using a Modular Digitizer Modern modular digitizers, like the Spectrum M4i series PCIe digitizers, offer greater bandwidth and higher resolution at any given bandwidth than ever before.
Measuring RF Parameters of Networks Bill Leonard NØCU
 Measuring RF Parameters of Networks Bill Leonard NØCU NAØTC - 285 TechConnect Radio Club http://www.naøtc.org/ What is a Network? A Network is a group of electrical components connected is a specific way
BASICS OF C & Ku BAND TRANSMISSIONS & LNBs
 Page 1 of 6 BASICS OF C & Ku BAND TRANSMISSIONS & LNBs A satellite broadcasts a few watts of microwave signals from the geostationary orbit 36,000 kilometers above the earth. The transmissions are also
Agilent Time Domain Analysis Using a Network Analyzer
 Agilent Time Domain Analysis Using a Network Analyzer Application Note 1287-12 0.0 0.045 0.6 0.035 Cable S(1,1) 0.4 0.2 Cable S(1,1) 0.025 0.015 0.005 0.0 1.0 1.5 2.0 2.5 3.0 3.5 4.0 Frequency (GHz) 0.005
SR2000 FREQUENCY MONITOR
 SR2000 FREQUENCY MONITOR THE FFT SEARCH FUNCTION IN DETAILS FFT Search is a signal search using FFT (Fast Fourier Transform) technology. The FFT search function first appeared with the SR2000 Frequency
MAINTENANCE & ADJUSTMENT
 MAINTENANCE & ADJUSTMENT Circuit Theory The concept of PLL system frequency synthesization is not of recent development, however, it has not been a long age since the digital theory has been couplet with
AMPLIFIED HIGH SPEED FIBER PHOTODETECTOR USER S GUIDE
 AMPLIFIED HIGH SPEED FIBER PHOTODETECTOR USER S GUIDE Thank you for purchasing your Amplified High Speed Fiber Photodetector. This user s guide will help answer any questions you may have regarding the
The Effect of Network Cabling on Bit Error Rate Performance. By Paul Kish NORDX/CDT
 The Effect of Network Cabling on Bit Error Rate Performance By Paul Kish NORDX/CDT Table of Contents Introduction... 2 Probability of Causing Errors... 3 Noise Sources Contributing to Errors... 4 Bit Error
RFSPACE CLOUD-IQ #CONNECTED SOFTWARE DEFINED RADIO
 CLOUD-IQ #CONNECTED SOFTWARE DEFINED RADIO 1 - SPECIFICATIONS Cloud-IQ INTRODUCTION The Cloud-IQ is a high performance, direct sampling software radio with an ethernet interface. It offers outstanding
Agilent N2717A Service Software Performance Verification and Adjustment Software for the Agilent ESA Spectrum Analyzers Product Overview
 Agilent N2717A Service Software Performance Verification and Adjustment Software for the Agilent ESA Spectrum Analyzers Product Overview Reduce your cost of ownership by minimizing time to calibrate and
Data Transmission. Raj Jain. Professor of CIS. The Ohio State University. Columbus, OH 43210 Jain@ACM.Org http://www.cis.ohio-state.
 Data Transmission Professor of CIS Columbus, OH 43210 Jain@ACM.Org http://www.cis.ohio-state.edu/~jain/ 2-1 Overview Time Domain and Frequency Domain Bit, Hertz Decibels Data vs Signal Attenuation, Delay
EMC Basics. Speaker : Alain Lafuente. Alain.lafuente@we-online.com
 EMC Basics Speaker : lain Lafuente lain.lafuente@we-online.com WHT IS EMC? 2 CE Marking With the formation of the single European market, standardization was required to remove technical barriers to trade.
Introduction to Network Analyzer Measurements
 Introduction to Network Analyzer Measurements Introduction to Network Analyzer Measurements 1 Table of Contents 1. Introduction to Network Analyzer Measurements... 3 VNA Basics...3 Applications for Network
R3765/67 CG Network Analyzer
 R3765/67 CG Network Analyzer RSE 05.03.02 1 R376XG Series Overview R3765 300kHz ~ 3.8 GHz R3767 300kHz ~ 8 GHz AG BG Basic model Built-in Bridge A/R & B/R Transmission Reflection CG Built-in S-parameter
DSA800 Series Spectrum Analyzer
 DSA800 Series Spectrum Analyzer Configuration Guide This guide is used to help users to configure DSA800 series spectrum analyzer according to their requirements. You can get an overall understanding of
Engineering Sciences 151. Electromagnetic Communication Laboratory Assignment 3 Fall Term 1998-99
 Engineering Sciences 151 Electromagnetic Communication Laboratory Assignment 3 Fall Term 1998-99 WAVE PROPAGATION II: HIGH FREQUENCY SLOTTED LINE AND REFLECTOMETER MEASUREMENTS OBJECTIVES: To build greater
Agilent 8753ET/8753ES Network Analyzers
 Agilent 8753ET/8753ES Network Analyzers 8753ET, 300 khz to 3 or 6 GHz 8753ES, 30 khz to 3 or 6 GHz Configuration Guide System configuration summary The following summary lists the main components required
PD Power Bandwidth- Worst Case Analysis July 2008
 IEEE P802.3at Task Force Power Via MDI Enhancements PD Power Bandwidth- Worst Case Analysis July 2008 Yair Darshan / Microsemi Corporation PD Power Bandwidth- Worst Case Analysis, Yair Darshan, May, 2008
PIEZO FILTERS INTRODUCTION
 For more than two decades, ceramic filter technology has been instrumental in the proliferation of solid state electronics. A view of the future reveals that even greater expectations will be placed on
1975-2004 GOOD WILL Instrument Co., Ltd. All rights reserved.
 Introduction to 3GHz Spectrum Analyzer of Instek Front side Features Rear side 1Frequency Adjustment 2Ref. Input 3Ref. Out 4Ext. Trigger 5GPIB 6RS232 11 12 13 7USB 8VGA Output 9Ear Phone DC Input 11 Battery
Drones Jammer. A simple drone Jammer designed to hack unwelcomed civilian drones within your backyard range.
 Drones Jammer A simple drone Jammer designed to hack unwelcomed civilian drones within your backyard range. Designed by: Ahmad Jisrawi Jisrawi@gmail.com https://twitter.com/ajisrawi What are Jammers? Commonly
Digital Modulation. David Tipper. Department of Information Science and Telecommunications University of Pittsburgh. Typical Communication System
 Digital Modulation David Tipper Associate Professor Department of Information Science and Telecommunications University of Pittsburgh http://www.tele.pitt.edu/tipper.html Typical Communication System Source
Technical Datasheet Scalar Network Analyzer Model 8003-10 MHz to 40 GHz
 Technical Datasheet Scalar Network Analyzer Model 8003-10 MHz to 40 GHz The Giga-tronics Model 8003 Precision Scalar Network Analyzer combines a 90 db wide dynamic range with the accuracy and linearity
DIRECTIONAL COUPLER AND ATTENUATOR FOR MEDIUM WAVE POWER NETWORK ANALYZER MEASUREMENT SYSTEM
 DIRECTIONAL COUPLER AND FOR MEDIUM WAVE POWER NETWORK ANALYZER MEASUREMENT SYSTEM DIRECTIONAL COUPLER INPUT OUTPUT 50 OHMS 500 WATTS CW.2 MHZ TO 12 MHZ 30 DB MIN DIRECTIVITY S/N 0X TOROIDAL CURRENT TRANSFORMER
Understanding Noise Figure
 Understanding Noise Figure Iulian Rosu, YO3DAC / VA3IUL, http://www.qsl.net/va3iul One of the most frequently discussed forms of noise is known as Thermal Noise. Thermal noise is a random fluctuation in
Spectrum Occupancy Measurements Location 3 of 6: National Science Foundation Building Roof April 16, 2004 Revision 2
 Location 3 of 6: National Science Foundation Building Roof April 16, 2004 Revision 2 Published August 15, 2005 Mark A. McHenry Shyam Chunduri Shared Spectrum Company 1595 Spring Hill Road, Suite 110 Vienna,
R&S ZVA Vector Network Analyzer Specifications
 www.atecorp.com 8-44-ATEC (2832) R&S ZVA Vector Network Analyzer Specifications ZVA_dat-sw_en_523-568-22_v_cover.indd Data Sheet. E stablished 98 Advanced Test Equipment Rentals Test & Measurement 4.5.22
Making Spectrum Measurements with Rohde & Schwarz Network Analyzers
 Making Spectrum Measurements with Rohde & Schwarz Network Analyzers Application Note Products: R&S ZVA R&S ZVB R&S ZVT R&S ZNB This application note describes how to configure a Rohde & Schwarz Network
CTCSS REJECT HIGH PASS FILTERS IN FM RADIO COMMUNICATIONS AN EVALUATION. Virgil Leenerts WØINK 8 June 2008
 CTCSS REJECT HIGH PASS FILTERS IN FM RADIO COMMUNICATIONS AN EVALUATION Virgil Leenerts WØINK 8 June 28 The response of the audio voice band high pass filter is evaluated in conjunction with the rejection
MSAN-001 X-Band Microwave Motion Sensor Module Application Note
 1. Introduction HB Series of microwave motion sensor module are X-Band Mono-static DRO Doppler transceiver front-end module. These modules are designed for movement detection, like intruder alarms, occupancy
HP 8970B Option 020. Service Manual Supplement
 HP 8970B Option 020 Service Manual Supplement Service Manual Supplement HP 8970B Option 020 HP Part no. 08970-90115 Edition 1 May 1998 UNIX is a registered trademark of AT&T in the USA and other countries.
EE 186 LAB 2 FALL 2004. Network Analyzer Fundamentals and Two Tone Linearity
 Network Analyzer Fundamentals and Two Tone Linearity Name: Name: Name: Objective: To become familiar with the basic operation of a network analyzer To use the network analyzer to characterize the in-band
TCOM 370 NOTES 99-4 BANDWIDTH, FREQUENCY RESPONSE, AND CAPACITY OF COMMUNICATION LINKS
 TCOM 370 NOTES 99-4 BANDWIDTH, FREQUENCY RESPONSE, AND CAPACITY OF COMMUNICATION LINKS 1. Bandwidth: The bandwidth of a communication link, or in general any system, was loosely defined as the width of
:-------------------------------------------------------Instructor---------------------
 Yarmouk University Hijjawi Faculty for Engineering Technology Computer Engineering Department CPE-462 Digital Data Communications Final Exam: A Date: 20/05/09 Student Name :-------------------------------------------------------Instructor---------------------
Recommendations for TDR configuration for channel characterization by S-parameters. Pavel Zivny IEEE 802.3 100GCU Singapore, 2011/03 V1.
 Recommendations for TDR configuration for channel characterization by S-parameters Pavel Zivny IEEE 802.3 100GCU Singapore, 2011/03 V1.0 Agenda TDR/TDT measurement setup TDR/TDT measurement flow DUT electrical
Laboratory #5: RF Filter Design
 EEE 194 RF Laboratory Exercise 5 1 Laboratory #5: RF Filter Design I. OBJECTIVES A. Design a third order low-pass Chebyshev filter with a cutoff frequency of 330 MHz and 3 db ripple with equal terminations
Cable Analysis and Fault Detection using the Bode 100
 Cable Analysis and Fault Detection using the Bode 100 By Stephan Synkule 2014 by OMICRON Lab V1.3 Visit www.omicron-lab.com for more information. Contact support@omicron-lab.com for technical support.
Spectrum and Power Measurements Using the E6474A Wireless Network Optimization Platform
 Application Note Spectrum and Power Measurements Using the E6474A Wireless Network Optimization Platform By: Richard Komar Introduction With the rapid development of wireless technologies, it has become
CE Test Report. : Microchip Technology Inc. 2355 West Chandler Blvd., Chandler, Arizona 85224-6199, USA
 CE Test Report Equipment : IEEE 802.11b/g Wireless LAN module Brand Name : MICROCHIP Model No. : MRF24WG0MA/MB Standard : EN 300 328 V1.8.1 (2012-06) Operating Band : 2400 MHz 2483.5 MHz Applicant Manufacturer
5 in 1 DVB-T Transmitter & Dual Cast Agile Digital Transposer TV EQUIPMENT
 The VHF/UHF Dual cast Digital Transposers/ Digital Transmitters set new standards for ATV and DVB-T transposer and transmitter technology by combining top performance with an extensive number of features
The N2PK Vector Network Analyzer (N2PK VNA) Original by Paul Kiciak, N2PK, 2007 * (*Pages edited or added by VE7WRS, 2009)
 Original by Paul Kiciak, N2PK, 2007 * (*Pages edited or added by VE7WRS, 2009)") The N2PK Vector Network Analyzer (N2PK VNA) Original by Paul Kiciak, N2PK, 2007 * (*Pages edited or added by VE7WRS, 2009) What Does Vector Mean?! Vector: magnitude & direction (angle) 01/22/07 N2PK *
The N2PK Vector Network Analyzer (N2PK VNA) Original by Paul Kiciak, N2PK, 2007 * (*Pages edited or added by VE7WRS, 2009) What Does Vector Mean?! Vector: magnitude & direction (angle) 01/22/07 N2PK *