CRMS Website Training
|
|
|
- Bethany Ross
- 10 years ago
- Views:
Transcription


1 CRMS Website Training March
2 Coastwide Reference Monitoring System - Wetlands CWPPRA Restoration Projects Congressionally funded in 1990 Multiple restoration techniques Inconsistent monitoring variables and frequencies Short data records Restoration project types: diversions of freshwater and sediments, marsh creation, shoreline protection, sediment and nutrient trapping, hydrologic restoration, and vegetation planting
3 Coastwide Reference Monitoring System - Wetlands Purpose To improve our ability to determine the effectiveness of individual coastal restoration projects. Provide information to evaluate coastal wetlands at the project, basin, and coastwide scales. To determine the ecological condition of coastal wetlands to ensure that the strategic coastal plan for Louisiana (Coast 2050, LCA, Louisiana Master Plan) is effective in recreating a sustainable coastal ecosystem.
 Did the restoration program reduce coastal wetland loss?")
 Is the restoration program effective in reducing major stressors on wetlands (i.e., flooding regime, salinity, elevation change)?")
4 Coastwide Reference Monitoring System - Wetlands CRMS Design and Assessment Funded by CWPPRA in CRMS sites Sites inside & outside of CWPPRA projects Questions to address through CRMS: (1) Did the restoration program reduce coastal wetland loss? (2) Did the restoration program sustain a diversity of vegetation types within basins? (3) Is the restoration program effective in reducing major stressors on wetlands (i.e., flooding regime, salinity, elevation change)? (4) Which project types are the most effective in creating, restoring, protecting and enhancing wetlands? Sites in swamp, fresh, intermediate, brackish, and salt marsh Allows for multiscale assessments
5 1km Coastwide Reference Monitoring System - Wetlands Site Design Non-spatial data collection Spatial data collection 200m 1km MARSH 200 m X 200 m 200m Typical Marsh Site WATER 2m X 2m vegetation station - V01 Rod Surface Elevation Table (RSET) E01 Accretion station A01 Datasonde H01, W01 Boardwalk Typical Swamp Site CRMS Site vs. CRMS Station
6 Coastwide Reference Monitoring System - Wetlands Site Design
7 Coastwide Reference Monitoring System - Wetlands Site Data Collection Parameter Method Scale Frequency Land to Water Ratio Satellite Imagery Hydrologic Basin 3 years Land to Water Ratio Digital Aerial Photography CRMS Site (1 Km 2 ) 3 years Emergent Vegetation Forested Vegetation Braun Blanquet: % Cover, Species Richness, Height of Dominant Species DBH, Canopy Cover, Understory veg (10) 2m x 2m plots per marsh site or (9) plots per swamp sites (3) 20m x 20m Forested plots & (9) 6m X6m Understory plots per site Annually during peak biomass 3 yrs during peak biomass Vertical Accretion Feldspar Plots/Cryogenic Cores 3 plots per site Bi-annually Marsh Elevation Change Rod Surface Elevation Table (RSET) 4 directions per site Bi-annually Porewater Salinity 10 and 30 cm syringe sippers 3 samples per depth per site and at vegetation plots Monthly Annually Surface Water Salinity, Temp and Water Level Submersible Data Logger in available water within 200 m of CRMS Site or in a well Hourly Soil Characteristics Core samples profiled into 4 cm increments to 24 cm. Bulk Density, OM%, Soil Salinity, ph, and Moisture. 3 cores, 18 archived samples per site 6 to 10 years
8 Coastwide Reference Monitoring System - Wetlands Analytical Teams and Web Delivery State and federal scientists Landscape Vegetation CRMS Analytical Teams Soils Academics Computer programmers Hydrology Data Delivery Web developers Oversight review
9 Coastwide Reference Monitoring System - Wetlands Analytical Teams and Web Delivery Provide web mapping viewer Landscape Hydrology Vegetation CRMS Analytical Teams Soils Data Delivery Summarize and visualize data at multiple scales Provide on-the-fly user defined graphics and tools Simplify querying and downloading of data Develop multi-metric ecological indices Develop report card
10 Coastwide Reference Monitoring System - Wetlands CRMS Website
11 Site Overview Main Menu Program Administrative links, Data Citation, and Data Descriptions Data Spatial Data / Tabular SONRIS Data Tool / Tabular CRMS Bulk Download Library Maps / Presentations / SONRIS Reports / CRMS Reports Visualizations Charting / Bulk Charting Mapping SONRIS / Basic Map Viewer
12 Program Program menu contains links to: Administrative Information Supporting or Reference Documents Privacy and Accessibility Statements Freedom of Information Act Data Citation Contacts from both USGS and OCPR Data Description Information Includes analytical framework documents Report card analysis explanations
")

13 Data Data menu contains links to: Spatial Data: Available for each CRMS site (some multi-year) Aerial Mosaic Land/Water Analysis Tabular Data Links back to SONRIS data download tools CRMS bulk data download tools
14 CRMS bulk data download tools All values for selected years, for selected stations (queue processes first come first serve) Data

")
15 Library Library menu contains links to: Maps: Available for each CRMS site (some multi-year) Presentations Reports (via SONRIS) CRMS Report Card
16 Mapping Mapping menu contains links to: Basic Map Viewer SONRIS Viewer
 Precipitation Report Card")
17 Visualizations Visualization menu contains links to: Charts Lots of Charts. Surface Elevation/Accretion % Organic / Bulk Density Vegetation Forested Pore Water Hydrographic (Salinity, Temp, Water Level) Precipitation Report Card Major change to interface to facilitate multi-station and multi-scale charting

18 Using the charting interface Charting Usage

19 Thumbnails of charts with category hover Charting Usage

20 1. Pick a Data Category 1. Hydro 2. Pick a Parameter 1. Salinity Charting Usage

21 1. Pick a Data Category 1. Hydro 2. Pick a Parameter 1. Salinity 3. Pick a Scale 1. Site 4. Enter Start / End Dates 1. 1/1/ /31/ Apply Date Filter Charting Usage

22 1. Pick a Data Category 1. Hydro 2. Pick a Parameter 1. Salinity 3. Pick a Scale 1. Site 4. Enter Start / End Dates 1. 1/1/ /31/ Apply Date Filter 5. Pick Site Charting Usage

23 1. Pick a Data Category 1. Hydro 2. Pick a Parameter 1. Salinity 3. Pick a Scale 1. Site 4. Enter Start / End Dates 1. 1/1/ /31/ Apply Date Filter 5. Pick Site Charting Usage
24 1. Pick a Data Category 1. Hydro 2. Pick a Parameter 1. Salinity 3. Pick a Scale 1. Site 4. Enter Start / End Dates 1. 1/1/ /31/ Apply Date Filter 5. Pick Site 6. View Chart 7. Save Chart Image 8. Download Data (optional) Charting Usage

25 1. Pick a Data Category 1. Hydro 2. Pick a Parameter 1. Salinity 3. Pick a Scale 1. Site 4. Enter Start / End Dates 1. 1/1/ /31/ Apply Date Filter 5. Pick Site 6. View Chart 7. Save Chart Image 8. Download Data (optional) Charting Usage

26 Charting Usage Multi-Station Charting 1. Pick a Data Category 1. Hydro 2. Pick a Parameter 1. Water Level 3. Pick a Scale 1. Multi Station 4. Enter Start / End Dates 1. 1/1/ /31/ Apply Date Filter 5. Pick Stations

27 Charting Usage Multi-Station Charting 1. Pick a Data Category 1. Hydro 2. Pick a Parameter 1. Salinity 3. Pick a Scale 1. Multi Station 4. Enter Start / End Dates 1. 1/1/ /31/ Apply Date Filter 5. Pick Stations 6. View Chart 7. Download Data (optional)

28 Charting Usage Multi-Station Charting 1. Pick a Data Category 1. Hydro 2. Pick a Parameter 1. Salinity 3. Pick a Scale 1. Multi Station 4. Enter Start / End Dates 1. 1/1/ /31/ Apply Date Filter 5. Pick Stations 6. View Chart 7. Download Data (optional)
29 Interactive Hydro Chart Charting Usage

30 Interactive Hydro Chart Charting Usage
31 Interactive Hydro Chart Charting Usage

32 Bulk charting- User defined chart selections applied to multiple charts creating a batch of charts with consistent formatting.

33 Bulk Charting
34 Bulk Charting

35 Bulk Charting

36 Bulk Charting

37 CRMS Data Download Retrieve user defined datasets for multiple dates or for multiple sites/stations.

38 Data Download

39 Data Download
40 CRMS Report Card

41 Reporting

42 Reporting
43 Using the mapping interface
44 Map Navigation CRMS Viewer now implements ESRI s ArcGIS JavaScript API which allows mouse wheel scrolling to zoom in and out of the map.
45 Interface Full Screen Button hides the top menu. Full Screen Button changes when the top menu is hidden.
46 Interface Layers Button shows and hides the Layers Menu Layers Menu Shown: Layers Menu Hidden:
47 Interface Tools Button darkens when the menu is shown. Tools Button brings up the Tools Menu.
48 Interface Zoom Button zooms to the rectangle drawn on the map. The icon darkens when the mouse is in the zoom state.
49 Interface Zoom To Full Extent Button resets the map back to the original area and zoom level. +/- Buttons zoom in and out. Manila dropdown shows how to interact with the current active layer.
50 Interface Expand layer to display more layer options. Make this the current active layer.
51 CRMS Active Layer

52 CRMS Active Layer Zoom to function zooms to the site and shows the information bubble for it. 1 Km Buffer checkbox adds/removes the 1 Km Buffer layer to the map. 200 M Buffer checkbox adds/removes the 200 M Buffer layer to the map. RealTime Hydro Sites checkbox adds/removes the RealTime Hydro Sites layer to the map. Classify invokes the tools menu with the classification option selected.
53 Click a point for Site Information Bubble CRMS Active Layer
54 CRMS Active Layer Site Information Bubble The information bubble appears when a CRMS site is clicked. The Site Info tab is automatically chosen when the bubble pops up on the screen.

55 CRMS Active Layer Site Information Bubble The Water tab contains all hydrologic information for the selected site. Salinity Brief overview of salinity data for the site. Also charts most recent salinity data for the site.

56 CRMS Active Layer Site Information Bubble The Water tab contains all hydrologic information for the selected site. Water Level Brief overview of water level data for the site. Also charts most recent water level data for the site.

57 CRMS Active Layer Site Information Bubble The Water tab contains all hydrologic information for the selected site. Water Temperature Brief overview of water temperature data for the site. Also charts most recent temperature data for the site.
58 CRMS Active Layer Site Information Bubble The Water tab contains all hydrologic information for the selected site. Hydro Index All Hydro Index charts available for the site.

59 CRMS Active Layer Site Information Bubble The Water tab contains all hydrologic information for the selected site. Water Level Range All water level range charts available for the current site.

60 CRMS Active Layer Site Information Bubble The Vegetation tab contains all vegetation information for the selected site. Herbaceous Species driven percent cover chart.
61 CRMS Active Layer Site Information Bubble The Vegetation tab contains all vegetation information for the selected site. Forested Species driven basal area chart.

62 CRMS Active Layer Site Information Bubble The Vegetation tab contains all vegetation information for the selected site. Floristic Quality Index

63 CRMS Active Layer Site Information Bubble The Vegetation tab contains all vegetation information for the selected site. Marsh Classification The chart displays marsh class by station over time, the top bar is marsh class at the site level, and the bottom line is marsh class at the site level using the helicopter survey data.

64 CRMS Active Layer Site Information Bubble The Soil tab contains all soil information for the selected site. Percent Organic Soil profiles taken at site establishment.

65 CRMS Active Layer Site Information Bubble The Soil tab contains all soil information for the selected site. Bulk Density - Soil profiles taken at site establishment.

66 CRMS Active Layer Site Information Bubble The Soil tab contains all soil information for the selected site. Surface Elevation/Accretion currently displays site level elevation change and accretion and gives rates for shallow subsidence.

67 CRMS Active Layer Site Information Bubble The Spatial tab contains all spatial information for the selected site. Land/Water with acreage breakdowns
68 CRMS Active Layer Site Information Bubble The Spatial tab contains all spatial information for the selected site. Site specific maps at the 1km scale.
69 CRMS Active Layer Site Information Bubble The Spatial tab contains all spatial information for the selected site. Aerial Photography
70 Sitte Information Bubble CRMS Active Layer The Report Card tab contains all report card information for the selected site. Report Card
71 CRMS Active Layer Site Information Bubble The Tools tab lets you do an Acreage Assessment on the selected site. Acreage Assessment Use the acreage assessment tool to determine acreage breakdowns of the available coastwide vegetation surveys or Land/Water data.
72 CWPPRA Active Layer

73 CWPPRA Active Layer Zoom to function zooms to the project and shows the information bubble for it. Constructed checkbox adds/removes the Constructed projects layer to the map. Not Constructed checkbox adds/removes the Not Constructed projects layer to the map Infrastructure checkbox adds/removes the Project Infrastructure layer to the map and shows the legend.

74 Project Information Bubble CWPPRA Active Layer The information bubble appears when a CWPPRA project is clicked. The Project Info tab is automatically chosen when the bubble pops up on the screen.

75 Project Information Bubble CWPPRA Active Layer The Water tab contains all hydrologic information for the selected project. Summary Gives a brief overview of the hydro data available for the project.
76 Project Information Bubble CWPPRA Active Layer The Water tab contains all hydrologic information for the selected project. Salinity Charts most recent data for hydro stations located within the project.

77 Project Information Bubble CWPPRA Active Layer The Water tab contains all hydrologic information for the selected project. Water Level Charts most recent data for hydro stations located within the project.

78 Project Information Bubble CWPPRA Active Layer The Water tab contains all hydrologic information for the selected project. Water Temperature Charts most recent data for hydro stations located within the project.
79 Project Information Bubble CWPPRA Active Layer The Water tab contains all hydrologic information for the selected project. Water Level Range Charts water level range data for hydro stations located within the project.
80 Project Information Bubble CWPPRA Active Layer The Vegetation tab contains all vegetation information for the selected project. Marsh Class Charts project and project reference Marsh Classification over multiple years.

81 Project Information Bubble CWPPRA Active Layer The Vegetation tab contains all vegetation information for the selected project. Project/Ref FQI Project Scale Floristic Quality Index Chart.
82 Project Information Bubble CWPPRA Active Layer The Vegetation tab contains all vegetation information for the selected project. Side by Side Side by side comparison of Marsh Class using the raster image created from helicopter surveys.
83 Project Information Bubble CWPPRA Active Layer The Report Card tab contains all report card information for the selected project. Report Card Summary of project scale information compiled into a report card.
84 Project Information Bubble CWPPRA Active Layer The Tools tab lets you do an Acreage Assessment on the selected project. Acreage Assessment Use the acreage assessment tool to determine acreage breakdowns of the available coastwide vegetation surveys or Land/Water data.
85 Hydro Basins Active Layer
86 Information Bubble Hydro Basins Active Layer The information bubble appears when a Hydro Basin is clicked. The Basin Info tab is automatically chosen when the bubble pops up on the screen. More basin level descriptive information will be posted soon.
87 Information Bubble Hydro Basins Active Layer The Report Card tab contains all report card information for the selected basin. Report Card Summary of basin scale information compiled into a report card.

88 Information Bubble Hydro Basins Active Layer The Tools tab lets you do an Acreage Assessment on the selected basin. Acreage Assessment Use the acreage assessment tool to determine acreage breakdowns of the available coastwide vegetation surveys or Land/Water data.
89 Vegetation Active Layer

90 Vegetation Active Layer Main Year selects the primary polygon layer on the map. Diff Year selects the secondary polygon layer on the map. Points checkbox adds/removes the Vegetation data points Polygons checkbox adds/removes the Vegetation Polygons layer. The slider changes the transparency of the layer. Assessment link invokes the acreage assessment tool menu for the currently selected year.

91 Vegetation Active Layer If Points is checked, the information on a vegetation data point is shown when clicked.
92 Vegetation Active Layer The Vegetation Type Change is shown when two different years are chosen for the Main Layer and Diff Layer.
93 Soils Active Layer

94 The Soil Type information window pops up when a soil area is clicked. Soils Active Layer
95 Public Lands Active Layer

96 Public Lands Active Layer State Lands checkbox adds/removes LA Department of Wildlife and Fisheries layer. Federal Lands checkbox adds/removes National Park Service and US Fish and Wildlife Service.

97 Public Lands Active Layer The Public Lands information window pops up when a Public Lands polygon is clicked.
98 Land/Water Other Layers

99 Other Layers Land/Water Year selector changes the Land/Water layer s year. Slider changes the transparency of the layer. Assessment link invokes the acreage assessment tool menu for the currently selected year.
100 CMS Other Layers
101 Base Layers Other Layers

102 Other Layers Base Layers DOQQ radio buttons add the selected DOQQ layer to the map. Other radio buttons change the base/background layer of the map.
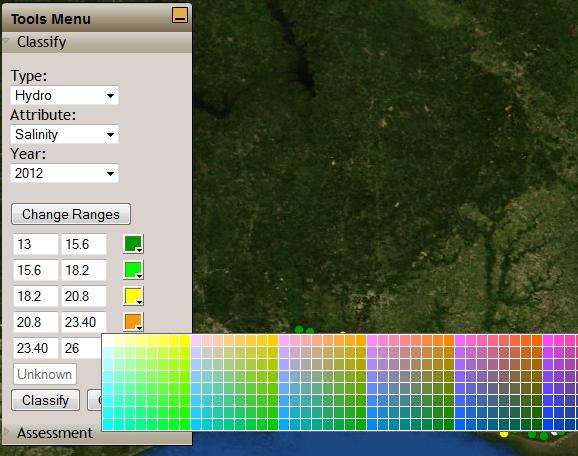
103 CRMS Tools Classify Tool A Type, Attribute, and Year must be chosen to Classify the CRMS sites. All of the Attributes except for the Marsh Classification have a color chooser option. Vegetation FQI Marsh Classification Hydro Hydro Index Salinity Water Level
104 Classify Tool CRMS Tools

105 Classify Tool CRMS Tools
106 Classify Tool CRMS Tools
107 CRMS Tools Acreage Assessment Tool A Type, Attribute, and Year must be chosen to Classify the CRMS sites. All of the Attributes except for the Marsh Classification have a color chooser option.
108 Acreage Assessment Tool CRMS Tools

109 Tools Tab Persistence CRMS Tools

110 Tools Tab Persistence CRMS Tools
111 Questions? Web Site:
CRMS Website Training March 2015
 CRMS Website Training March 2015 http://www.lacoast.gov/crms CWPPRA Restoration Program CWPPRA was congressionally funded in 1990 and mandated 20 years of restoration project monitoring CWPPRA program
Coastwide Reference Monitoring System Wetlands (CRMS-Wetlands) Project Update
 Project Update") Coastwide Reference Monitoring System Wetlands (CRMS-Wetlands) Project Update Louisiana Department of Natural Resources Coastal Restoration Division U.S. Geological Survey National Wetlands Research Center
Coastwide Reference Monitoring System Wetlands (CRMS-Wetlands) Project Update Louisiana Department of Natural Resources Coastal Restoration Division U.S. Geological Survey National Wetlands Research Center
Texas Wildfire Risk Assessment Portal (TxWRAP) User Manual. Texas A&M Forest Service
 User Manual. Texas A&M Forest Service") Texas Wildfire Risk Assessment Portal (TxWRAP) User Manual Texas A&M Forest Service October 2012 Table of Contents 1 ABOUT TXWRAP... 7 1.1 ACCESSING TXWRAP... 7 1.2 GETTING SUPPORT... 8 Documentation...
Texas Wildfire Risk Assessment Portal (TxWRAP) User Manual Texas A&M Forest Service October 2012 Table of Contents 1 ABOUT TXWRAP... 7 1.1 ACCESSING TXWRAP... 7 1.2 GETTING SUPPORT... 8 Documentation...
There are various ways to find data using the Hennepin County GIS Open Data site:
 Finding Data There are various ways to find data using the Hennepin County GIS Open Data site: Type in a subject or keyword in the search bar at the top of the page and press the Enter key or click the
Latin American and Caribbean Flood and Drought Monitor Tutorial Last Updated: November 2014
 Latin American and Caribbean Flood and Drought Monitor Tutorial Last Updated: November 2014 Introduction: This tutorial examines the main features of the Latin American and Caribbean Flood and Drought
Objectives. Raster Data Discrete Classes. Spatial Information in Natural Resources FANR 3800. Review the raster data model
 Spatial Information in Natural Resources FANR 3800 Raster Analysis Objectives Review the raster data model Understand how raster analysis fundamentally differs from vector analysis Become familiar with
MGB-LGSD Mobile GIS Application Development Project
 MGB-LGSD Mobile GIS Application Development Project Version 1.0 Submitted to: MGB-LGSD Compound, North Avenue, Diliman, Quezon City Prepared By: 19/F Strata 100 Building, F. Ortigas Jr. Road, Ortigas Center,
Michigan Tech Research Institute Wetland Mitigation Site Suitability Tool
 Michigan Tech Research Institute Wetland Mitigation Site Suitability Tool Michigan Tech Research Institute s (MTRI) Wetland Mitigation Site Suitability Tool (WMSST) integrates data layers for eight biophysical
MetroBoston DataCommon Training
 MetroBoston DataCommon Training Whether you are a data novice or an expert researcher, the MetroBoston DataCommon can help you get the information you need to learn more about your community, understand
Studying Topography, Orographic Rainfall, and Ecosystems (STORE)
") Studying Topography, Orographic Rainfall, and Ecosystems (STORE) Introduction Basic Lesson 2: Using ArcGIS Explorer to Analyze the Connection between Topography and Rainfall This lesson introduces Geographical
Studying Topography, Orographic Rainfall, and Ecosystems (STORE) Introduction Basic Lesson 2: Using ArcGIS Explorer to Analyze the Connection between Topography and Rainfall This lesson introduces Geographical
Map Navigation Controls. An Interactive, Locally Based Knowledge Resource LivingstonLive.org/maps OR gisapps/livingstonviewerinternal
 Livingston County s Internet Mapping Portal User Guide An Interactive, Locally Based Knowledge Resource LivingstonLive.org/maps OR gisapps/livingstonviewerinternal A vast majority of County government
INTRODUCTION to ESRI ARCGIS For Visualization, CPSC 178
 INTRODUCTION to ESRI ARCGIS For Visualization, CPSC 178 1) Navigate to the C:/temp folder 2) Make a directory using your initials. 3) Use your web browser to navigate to www.library.yale.edu/mapcoll/ and
HELCOM Data and Map Service. User Manual
 HELCOM Data and Map Service User Manual Version 2.2 - February 2015 1 Table of contents 1. General Information... 3 1.1 Background... 3 1.2 Technical requirements... 3 1.3 Contact... 3 2. Accessing HELCOM
How to use PGS: Basic Services Provision Map App
 How to use PGS: Basic Services Provision Map App The PGS: Basic Services Provision Map App The main features of the PGP Basic Services web application includes: Navigation Tools Map Tools Main Map Links
From GPS Data Collection to GIS Data Display A Walk-Through Example
 From GPS Data Collection to GIS Data Display A Walk-Through Example The Global Positioning System (GPS) is a satellite based navigation system consisting of 24 satellites, a worldwide network of tracking
Regional Drought Decision Support System (RDDSS) Charting Tools Help Documentation
 Charting Tools Help Documentation") Regional Drought Decision Support System (RDDSS) Charting Tools Help Documentation The following help documentation was prepared to give insight to the basic functionality of the charting tools within
Regional Drought Decision Support System (RDDSS) Charting Tools Help Documentation The following help documentation was prepared to give insight to the basic functionality of the charting tools within
Activity: Using ArcGIS Explorer
 Activity: Using ArcGIS Explorer Requirements You must have ArcGIS Explorer for this activity. Preparation: Download ArcGIS Explorer. The link below will bring you to the ESRI ArcGIS Explorer download page.
Government 98dn Mapping Social and Environmental Space
 Government 98dn Mapping Social and Environmental Space LAB EXERCISE 5: The Analysis of Fields Objectives of this lab: Visualizing raster data Using Spatial Analyst functions to create new data Analysis
Introduction to GIS software
 Introduction to GIS software There are a wide variety of GIS software packages available. Some of these software packages are freely available for you to download and could be used in your classroom. ArcGIS
Help Document for WWW.SAGIS.ORG. Step by step, how-to instructions for navigating and using the Savannah Area GIS viewer.
 Help Document for WWW.SAGIS.ORG Step by step, how-to instructions for navigating and using the Savannah Area GIS viewer. 1 SAGIS Savannah Area GIS is focused on providing access to Geospatial data in a
Geocortex HTML 5 Viewer Manual
 1 FAQ Nothing Happens When I Print? How Do I Search? How Do I Find Feature Information? How Do I Print? How can I Email A Map? How Do I See the Legend? How Do I Find the Coordinates of a Location? How
Contents. The OWRB Floodplain Viewer. Creating Maps... 8. Helpful Tips... 10
 Contents QUICK START GUIDE... 2-5 Add layers...9 Search for Layers...9 COMPREHENSIVE GUIDE... 6 Navigate the map...6 Locate specific places...6 Add layer from file...9 Add layer from web...9 Display pop-up
Water Monitoring System Website User Guide www.fldep-stevens.com
 Florida Department of Environmental Protection Division of State Lands Bureau of Survey and Mapping Water Monitoring System Website User Guide www.fldep-stevens.com Provided by Stevens Water Monitoring
COASTAL MONITORING & OBSERVATIONS LESSON PLAN Do You Have Change?
 Coastal Change Analysis Lesson Plan COASTAL MONITORING & OBSERVATIONS LESSON PLAN Do You Have Change? NOS Topic Coastal Monitoring and Observations Theme Coastal Change Analysis Links to Overview Essays
Expert Review and Questionnaire (PART I)
") NASA ARC Project 1-9-2001 Web-based Geospatial Information Services and Analytic Tools for Habitat Conservation and Management Expert Review and Questionnaire (PART I) Thank you for participating in this
NASA ARC Project 1-9-2001 Web-based Geospatial Information Services and Analytic Tools for Habitat Conservation and Management Expert Review and Questionnaire (PART I) Thank you for participating in this
WFP Liberia Country Office
 1 Oscar Gobbato [email protected] [email protected] WFP Liberia Country Office GIS training - Summary Objectives 1 To introduce to participants the basic concepts and techniques in using Geographic
IDOT Getting Around Illinois Interactive Map Quick Reference Guide
 IDOT Getting Around Illinois Interactive Map Quick Reference Guide 1 2 3 4 5 6 7 8 9 10 1) Navigation Tools The Navigation tools are used to reposition the visible area on the map display. Zoom In Clicking
Applying a circular load. Immediate and consolidation settlement. Deformed contours. Query points and query lines. Graph query.
 Quick Start Tutorial 1-1 Quick Start Tutorial This quick start tutorial will cover some of the basic features of Settle3D. A circular load is applied to a single soil layer and settlements are examined.
3D-GIS in the Cloud USER MANUAL. August, 2014
 3D-GIS in the Cloud USER MANUAL August, 2014 3D GIS in the Cloud User Manual August, 2014 Table of Contents 1. Quick Reference: Navigating and Exploring in the 3D GIS in the Cloud... 2 1.1 Using the Mouse...
Supervised Classification workflow in ENVI 4.8 using WorldView-2 imagery
 Supervised Classification workflow in ENVI 4.8 using WorldView-2 imagery WorldView-2 is the first commercial high-resolution satellite to provide eight spectral sensors in the visible to near-infrared
Mapping Your Land: An Overview for Landowners
 Mapping Your Land: An Overview for Landowners Online Mapping and Spatial Resources for the Private Forest Landowner Tutorials by John C. Gilbert 1 and John S. Kush 1 Design and Layout by Elizabeth P. Bowersock
Natural Resource-Based Planning*
 Natural Resource-Based Planning* Planning, when done well, is among the most powerful tools available to communities. A solid plan, based on good natural resource information, guides rational land-use
Data Visualization. Prepared by Francisco Olivera, Ph.D., Srikanth Koka Department of Civil Engineering Texas A&M University February 2004
 Data Visualization Prepared by Francisco Olivera, Ph.D., Srikanth Koka Department of Civil Engineering Texas A&M University February 2004 Contents Brief Overview of ArcMap Goals of the Exercise Computer
Visualization with Excel Tools and Microsoft Azure
 Visualization with Excel Tools and Microsoft Azure Introduction Power Query and Power Map are add-ins that are available as free downloads from Microsoft to enhance the data access and data visualization
Watershed Ecosystem & Restoration Services (WERS Mapping Application) User s Guide
 User s Guide") Watershed Ecosystem & Restoration Services (WERS Mapping Application) User s Guide CONTACT Site Administrators: David Gillum, GISP, AACO, OIT Rick Fisher, AACO, WERS [email protected] [email protected]
Watershed Ecosystem & Restoration Services (WERS Mapping Application) User s Guide CONTACT Site Administrators: David Gillum, GISP, AACO, OIT Rick Fisher, AACO, WERS [email protected] [email protected]
Studying Topography, Orographic Rainfall, and Ecosystems (STORE)
") Studying Topography, Orographic Rainfall, and Ecosystems (STORE) Basic Lesson 3: Using Microsoft Excel to Analyze Weather Data: Topography and Temperature Introduction This lesson uses NCDC data to compare
Studying Topography, Orographic Rainfall, and Ecosystems (STORE) Basic Lesson 3: Using Microsoft Excel to Analyze Weather Data: Topography and Temperature Introduction This lesson uses NCDC data to compare
June, 2006 Tutorial: Create map with multiple views and data layers using ArcMap GIS 9.0
 June, 2006 Tutorial: Create map with multiple views and data layers using ArcMap GIS 9.0 This presentation demonstrates how to create a publication-quality map illustration consisting of three panes or
Understanding Raster Data
 Introduction The following document is intended to provide a basic understanding of raster data. Raster data layers (commonly referred to as grids) are the essential data layers used in all tools developed
Data Visualization. Brief Overview of ArcMap
 Data Visualization Prepared by Francisco Olivera, Ph.D., P.E., Srikanth Koka and Lauren Walker Department of Civil Engineering September 13, 2006 Contents: Brief Overview of ArcMap Goals of the Exercise
Spotfire v6 New Features. TIBCO Spotfire Delta Training Jumpstart
 Spotfire v6 New Features TIBCO Spotfire Delta Training Jumpstart Map charts New map chart Layers control Navigation control Interaction mode control Scale Web map Creating a map chart Layers are added
ArcGIS Reference Document
 Migration of GIS Data to ArcSDE Page 1 of 10 Table of Contents A Brief Summary of DEP s GIS Data Storage o The Y Drive o ArcSDE (Spatial Database) Keeping Your GIS Project Data Current o Checking Your
CREATING EXCEL PIVOT TABLES AND PIVOT CHARTS FOR LIBRARY QUESTIONNAIRE RESULTS
 CREATING EXCEL PIVOT TABLES AND PIVOT CHARTS FOR LIBRARY QUESTIONNAIRE RESULTS An Excel Pivot Table is an interactive table that summarizes large amounts of data. It allows the user to view and manipulate
REGIONAL SEDIMENT MANAGEMENT: A GIS APPROACH TO SPATIAL DATA ANALYSIS. Lynn Copeland Hardegree, Jennifer M. Wozencraft 1, Rose Dopsovic 2 INTRODUCTION
 REGIONAL SEDIMENT MANAGEMENT: A GIS APPROACH TO SPATIAL DATA ANALYSIS Lynn Copeland Hardegree, Jennifer M. Wozencraft 1, Rose Dopsovic 2 ABSTRACT: Regional sediment management (RSM) requires the capability
Appendix B: Cost Estimates
 Appendix B: Estimates This appendix presents the estimated costs of the monitoring and supplemental research components presented in Section 3 of this document. A 20% quality assurance and quality control
Kodiak Island Borough GIS Online Tools
 Kodiak Island Borough GIS Online Tools The Kodiak Island Borough website is located at http://www.kodiakak.us/ You can access the GIS resources by clicking on the MAP CENTER icon in the middle of the page,
Medicare Data Portal. Quick Start Guide
 Medicare Data Portal Quick Start Guide 1 P age Background HealthLandscape (a division of the American Academy of Family Physicians [AAFP]) and the Robert Graham Center for Policy Studies in Family Medicine
Tutorial 8 Raster Data Analysis
 Objectives Tutorial 8 Raster Data Analysis This tutorial is designed to introduce you to a basic set of raster-based analyses including: 1. Displaying Digital Elevation Model (DEM) 2. Slope calculations
Introduction... 1 Welcome Screen... 2 Map View... 3. Generating a map... 3. Map View... 4. Basic Map Features... 4
 Quick Start Guide Contents Introduction... 1 Welcome Screen... 2 Map View... 3 Generating a map... 3 Map View... 4 Basic Map Features... 4 Adding a Secondary Indicator... 5 Adding a Secondary Indicator...
Using Google Earth for Environmental Science Research
 Using Google Earth for Environmental Science Research This document is up-to-date as of August 2013. If you have any questions or additions to this material please email [email protected]. Note: this
TUTORIAL - Locations & Mapping. Using the ESdat Environmental Database System. For use with ESDAT version 5
 TUTORIAL - Locations & Mapping Using the ESdat Environmental Database System For use with ESDAT version 5 (version 5 software updates available from ) Function Tutorial - Locations and Mapping Table of
Data source, type, and file naming convention
 Exercise 1: Basic visualization of LiDAR Digital Elevation Models using ArcGIS Introduction This exercise covers activities associated with basic visualization of LiDAR Digital Elevation Models using ArcGIS.
Linking FLIPS to a GIS Shapefile
 Linking FLIPS to a GIS Shapefile User s Guide Atterbury Consultants, Inc. 3800 SW Cedar Hills Blvd. Suite 145 Beaverton, Oregon 97005 503-646-5393 Phone 503-644-1683 Fax www.atterbury.com Table of Contents
CentralMass DataCommon
 CentralMass DataCommon User Training Guide Welcome to the DataCommon! Whether you are a data novice or an expert researcher, the CentralMass DataCommon can help you get the information you need to learn
Finding GIS Data and Preparing it for Use
 Finding_Data_Tutorial.Doc Page 1 of 19 Getting Ready for the Tutorial Sign Up for the GIS-L Listserv Finding GIS Data and Preparing it for Use The Yale University GIS-L Listserv is an internal University
Integrated Information Management System, Development of Web Interface, a.k.a. Online Data Portal (ODP)
") Integrated Information Management System, Development of Web Interface, a.k.a. Online Data Portal (ODP) USBR Science and Technology Project ID 3625 Eric Peterson, May 2014. Duration: Fiscal Year 2010 through
Integrated Information Management System, Development of Web Interface, a.k.a. Online Data Portal (ODP) USBR Science and Technology Project ID 3625 Eric Peterson, May 2014. Duration: Fiscal Year 2010 through
Wyoming Geographic Information Science Center & Wyoming Game & Fish Department
 Wyoming Density and Disturbance Calculation Tool Wyoming Geographic Information Science Center & Wyoming Game & Fish Department Nicholas Graf Wyoming Geographic Information Science Center University of
California Department of Fish and Game (Wildlife) GIS Data and Services
 GIS Data and Services") California Department of Fish and Game (Wildlife) GIS Data and Services http://www.dfg.ca.gov Steve Goldman GIS Manager Biogeographic Data Branch 1. GIS Data 2. Web Applications 3. Map Services GIS Data:
California Department of Fish and Game (Wildlife) GIS Data and Services http://www.dfg.ca.gov Steve Goldman GIS Manager Biogeographic Data Branch 1. GIS Data 2. Web Applications 3. Map Services GIS Data:
LYON COUNTY GEOMOOSE 2 HELP DOCUMENT
 LYON COUNTY GEOMOOSE 2 HELP DOCUMENT TABLE OF CONTENTS Lyon County Geomoose 2 Help Document... 1 Introduction... 3 Quick Reference Chart... 4 The Interface... 4 The Table of Contents... 5 Quick Reference
WEB MAPPING TOOL DOCUMENTATION
 ENTERPRISE ZONES RE DESIGNATION WEB MAPPING TOOL DOCUMENTATION January 26, 2015 COVER PAGE TABLE OF CONTENTS INTRODUCTION 1 APPLICATION LAYOUT 2 WEB MAP NAVIGATION 3 LOCATION SEARCH 4 MAP LEGEND 5 BASEMAP
PROCEDURE. See: Great Lakes Coastal Wetlands (http:// www.miseagrant.umich.edu/wetlands/index.html)
") Activity: Students review a selection of career profiles and play a lively classroom game to find out more about marine and aquatic science professionals. Grade Level: 4-8 Subjects: Science, social studies
Activity: Students review a selection of career profiles and play a lively classroom game to find out more about marine and aquatic science professionals. Grade Level: 4-8 Subjects: Science, social studies
Version 3.0, April 16, 2012, updated for ArcGIS 10.0 Produced by the Geographic Information Network of Alaska http://www.gina.alaska.
 Using the AlaskaMapped Web Services in ESRI ArcGIS Version 3.0, April 16, 2012, updated for ArcGIS 10.0 Produced by the Geographic Information Network of Alaska http://www.gina.alaska.edu AlaskaMapped
How to do it Manual No. 3: ArcMap10 in Remote Desktop mode and Landgate slip files. Jeremy Green
 How to do it Manual No. 3: ArcMap10 in Remote Desktop mode and Landgate slip files Jeremy Green Report Department of Maritime Archaeology No. 268 2010 Getting started with ArcInfo10 The ArcInfo10 exists
McIDAS-V Tutorial Displaying Polar Satellite Imagery updated September 2015 (software version 1.5)
") McIDAS-V Tutorial Displaying Polar Satellite Imagery updated September 2015 (software version 1.5) McIDAS-V is a free, open source, visualization and data analysis software package that is the next generation
McIDAS-V Tutorial Displaying Polar Satellite Imagery updated September 2015 (software version 1.5) McIDAS-V is a free, open source, visualization and data analysis software package that is the next generation
TIBCO Spotfire Business Author Essentials Quick Reference Guide. Table of contents:
 Table of contents: Access Data for Analysis Data file types Format assumptions Data from Excel Information links Add multiple data tables Create & Interpret Visualizations Table Pie Chart Cross Table Treemap
Online Monitoring User Guide
 High Resolution Temperature Sensing Strip Online Monitoring User Guide 888.637.3282 www.nerdata.com Page 1 of 26 Contents The Aurora Online Monitoring System... 3 1. Creating an Account on the Aurora Online
Symbolizing your data
 Symbolizing your data 6 IN THIS CHAPTER A map gallery Drawing all features with one symbol Drawing features to show categories like names or types Managing categories Ways to map quantitative data Standard
A STANDARD OPERATING PROCEDURES MANUAL FOR THE COAST-WIDE REFERENCE MONITORING SYSTEM-WETLANDS:
 A STANDARD OPERATING PROCEDURES MANUAL FOR THE COAST-WIDE REFERENCE MONITORING SYSTEM-WETLANDS: Methods for Site Establishment, Data Collection, and Quality Assurance/Quality Control Todd M. Folse, Jonathan
www.lpi.nsw.gov.au SCIMS Online Support Guide
 www.lpi.nsw.gov.au SCIMS Online Support Guide November 2012 Document Status Revision Version 1.7 Version date 01/11/2012 Author Owner John Kelaher and Cheryl Wheeler Land and Property Information Surveying
Inlets Online: A Tutorial for Evaluating Inlet/Beach Processes Using Aerial Photography
 Inlets Online: A Tutorial for Evaluating Inlet/Beach Processes Using Aerial Photography by Mark R. Byrnes, Feng Li, and Julie D. Rosati PURPOSE: This Coastal and Hydraulics Engineering Technical Note (CHETN)
Accountable Care Organization Quality Explorer. Quick Start Guide
 Accountable Care Organization Quality Explorer Quick Start Guide 1 P age Background HealthLandscape (a division of the American Academy of Family Physicians [AAFP]) and the Robert Graham Center for Policy
Reef Explorer User Guide
 Reef Explorer User Guide Contents USER INTERFACE...2 DATA CONTENT...3 BASEMAPS...4 ESRI BASEMAPS...4 National Geographic World Map...4 Light Gray Canvas Map...4 Ocean Basemap...4 World Terrain Base...4
Getting Started With Mortgage MarketSmart
 Getting Started With Mortgage MarketSmart We are excited that you are using Mortgage MarketSmart and hope that you will enjoy being one of its first users. This Getting Started guide is a work in progress,
Working with The Matrix Email Portal: Auto Email
 Working with The Matrix Email Portal: Auto Email Welcome to "The Portal" Welcome to The Portal, your single access point for HMLS listing information, brought to you by your REALTOR. When you arrive at
Getting Started With LP360
 Getting Started With LP360 10/30/2014 1 Contents What is LP360?... 3 System Requirements... 3 Installing LP360... 4 How to Enable the LP360 Extension... 4 How to Display the LP360 Toolbar... 4 How to Import
Restoration Planning and Development of a Restoration Bank
 Restoration Planning and Development of a Restoration Bank Black Creek Pioneer Village, South Theatre 8:30 a.m. to 3:30 p.m. Habitat Restoration and Environmental Monitoring Projects Section Restoration
Executive Dashboard. User Guide
 Executive Dashboard User Guide 2 Contents Executive Dashboard Overview 3 Naming conventions 3 Getting started 4 Welcome to Socialbakers Executive Dashboard! 4 Comparison View 5 Setting up a comparison
Image source: www.rivers.gov. Visual Data Analytics, LLC
 AWRA Spring Specialty AWRA Conference Spring Specialty on GIS Conference and Water on Resources GIS and Water VIII Resources May 13, 2014 Using a Temporal Information System for Visualization and Analysis
CRS 610 Ventura County Flood Warning System Website
 CRS 610 Ventura County Flood Warning System Website Purpose This document gives instructions and a description of the information available via the Ventura County Watershed Protection District s (VCWPD)
A GIS helps you answer questions and solve problems by looking at your data in a way that is quickly understood and easily shared.
 A Geographic Information System (GIS) integrates hardware, software, and data for capturing, managing, analyzing, and displaying all forms of geographically referenced information. GIS allows us to view,
Working with Excel in Origin
 Working with Excel in Origin Limitations When Working with Excel in Origin To plot your workbook data in Origin, you must have Excel version 7 (Microsoft Office 95) or later installed on your computer
Guide to Viewing Maps in Google Earth
 Guide to Viewing Maps in Google Earth The BCT made the decision to provide the GIS (Geographic Information System) resources for Bat Groups in the form of Google Earth maps because they do not require
This guide provides step by step instructions for using the IMF elibrary Data - My Data area. In this guide, you ll learn how to:
 This guide provides step by step instructions for using the IMF elibrary Data - area. In this guide, you ll learn how to: Access your favorite and recently used data reports. Make sure you receive email
Communities, Biomes, and Ecosystems
 Communities, Biomes, and Ecosystems Before You Read Before you read the chapter, respond to these statements. 1. Write an A if you agree with the statement. 2. Write a D if you disagree with the statement.
USER MANUAL Detcon Log File Viewer
 USER MANUAL Detcon Log File Viewer DETCON, Inc. 4055 Technology Forest Blvd., The Woodlands, Texas 77381 Ph.281.367.4100 / Fax 281.298.2868 www.detcon.com January 29, 2013 Document #4482 Revision 1.00
WONDERFUL, WATERFUL WETLANDS
 WONDERFUL, WATERFUL WETLANDS OBJECTIVES The student will do the following: 1. List characteristics of wetlands. SUBJECTS: Science, Language Arts TIME: 60 minutes 2. Describe the functions of a wetland.
Files Used in this Tutorial
 Generate Point Clouds Tutorial This tutorial shows how to generate point clouds from IKONOS satellite stereo imagery. You will view the point clouds in the ENVI LiDAR Viewer. The estimated time to complete
FDOU Project 26B Task 4 Our Florida Reefs Community Working Group Scenario Planning Results
 FDOU Project 26B Task 4 Our Florida Reefs Community Working Group Scenario Planning Results Florida Department of Environmental Protection Coral Reef Conservation Program Project 26B FDOU Project 26B Task
User s Guide to ArcView 3.3 for Land Use Planners in Puttalam District
 User s Guide to ArcView 3.3 for Land Use Planners in Puttalam District Dilhari Weragodatenna IUCN Sri Lanka, Country Office Table of Content Page No Introduction...... 1 1. Getting started..... 2 2. Geo-referencing...
United States Department of Agriculture (USDA) Agricultural Marketing Service (AMS) Livestock and Grain Market News (LGMN)
 Agricultural Marketing Service (AMS) Livestock and Grain Market News (LGMN)") United States Department of Agriculture (USDA) Agricultural Marketing Service (AMS) Livestock and Grain Market News (LGMN) Livestock Mandatory Reporting (LMR) Dashboard Users Guide Version 3.0 / 11 May
United States Department of Agriculture (USDA) Agricultural Marketing Service (AMS) Livestock and Grain Market News (LGMN) Livestock Mandatory Reporting (LMR) Dashboard Users Guide Version 3.0 / 11 May