Data Visualization. Prepared by Francisco Olivera, Ph.D., Srikanth Koka Department of Civil Engineering Texas A&M University February 2004
|
|
|
- Collin Ross
- 7 years ago
- Views:
Transcription
1 Data Visualization Prepared by Francisco Olivera, Ph.D., Srikanth Koka Department of Civil Engineering Texas A&M University February 2004 Contents Brief Overview of ArcMap Goals of the Exercise Computer and Data Requirements Procedure 1. Displaying and Navigating map 2. Feature attributes and statistics 3. Symbolizing features 4. Classifying features 5. Making maps for presentation Brief Overview of ArcMap ArcMap is an application for displaying and analyzing GIS data. The application window consists of: Map display area, Table of contents (TOC), Menus, tools and buttons. Data Frames are ArcMap document objects where the geographic information of the digital spatial datasets in form of layers is displayed. A Layer is a digital spatial dataset that has been added to a data frame and that has specific properties. Tables are arrays of data organized in rows and columns (i.e. fields) Table can be: Stand alone arrays of data with no
, Menus, tools and buttons.")
2 geographic information included or Components of digital spatial datasets in which each row includes feature shape and a unique identification number for each feature called ObjectID. Goals of the Exercise To introduce you how to Display maps, navigate maps. Looking at feature attributes Creating graphs Change default symbology using custom symbology. Symbolize features by categorical attributes Classifying features by standard methods Creating layouts Computer and Data Requirements This exercise was successfully completed using ArcGIS 8.3. The only component of ArcGIS used was ArcView. Data and project should be located at C:\GTArcGIS\Chapter03. Procedure 1. Displaying and Navigating maps

3 (1) Using the Start button on the windows taskbar, open a new ArcMap document. (2) You see the ArcMap dialog on top of the application window, in this dialog, click on Browse for maps. (3) Navigate to C:\GTArcGIS\Chapter03, click on ex03a.mxd and click open. (4) You can see that the ArcMap document contains three layers: Flight path, Counties and Cities, in which the cities layer is visible as a check mark is not inserted in the square beside its name in the table of contents. (5) Make the Counties layer disappear by clicking on the check box and turning it off.
 You can see that the ArcMap document contains three layers: Flight path, Counties and Cities, in which the cities layer is visible as a")
4 (6) Now turn it back on by clicking in the check box again. Also turn on the Cities layer by inserting a check in the box located beside its name. To make the cities visible, now hiding behind other layers, in the table of contents, drag the Cities layer to the top.

5 (7) Open the Cities layer properties by right clicking on the Cities layer and then on Properties for the Layer Properties wizard to appear. Make sure that General tab is chosen, if not click on the General tab. (8) You now rewrite the layers name by changing the name from Cities to Cities Viewed in Layer Name text box and then click apply for the wizard to disappear.
 You now rewrite the layers name by changing the name from Cities to Cities Viewed in")
6 (9) Now you will learn how to use tools toolbar. (10) On the toolbar, click on the Zoom In tool. Then using the new cursor, draw a square on the part of the world of you interest.

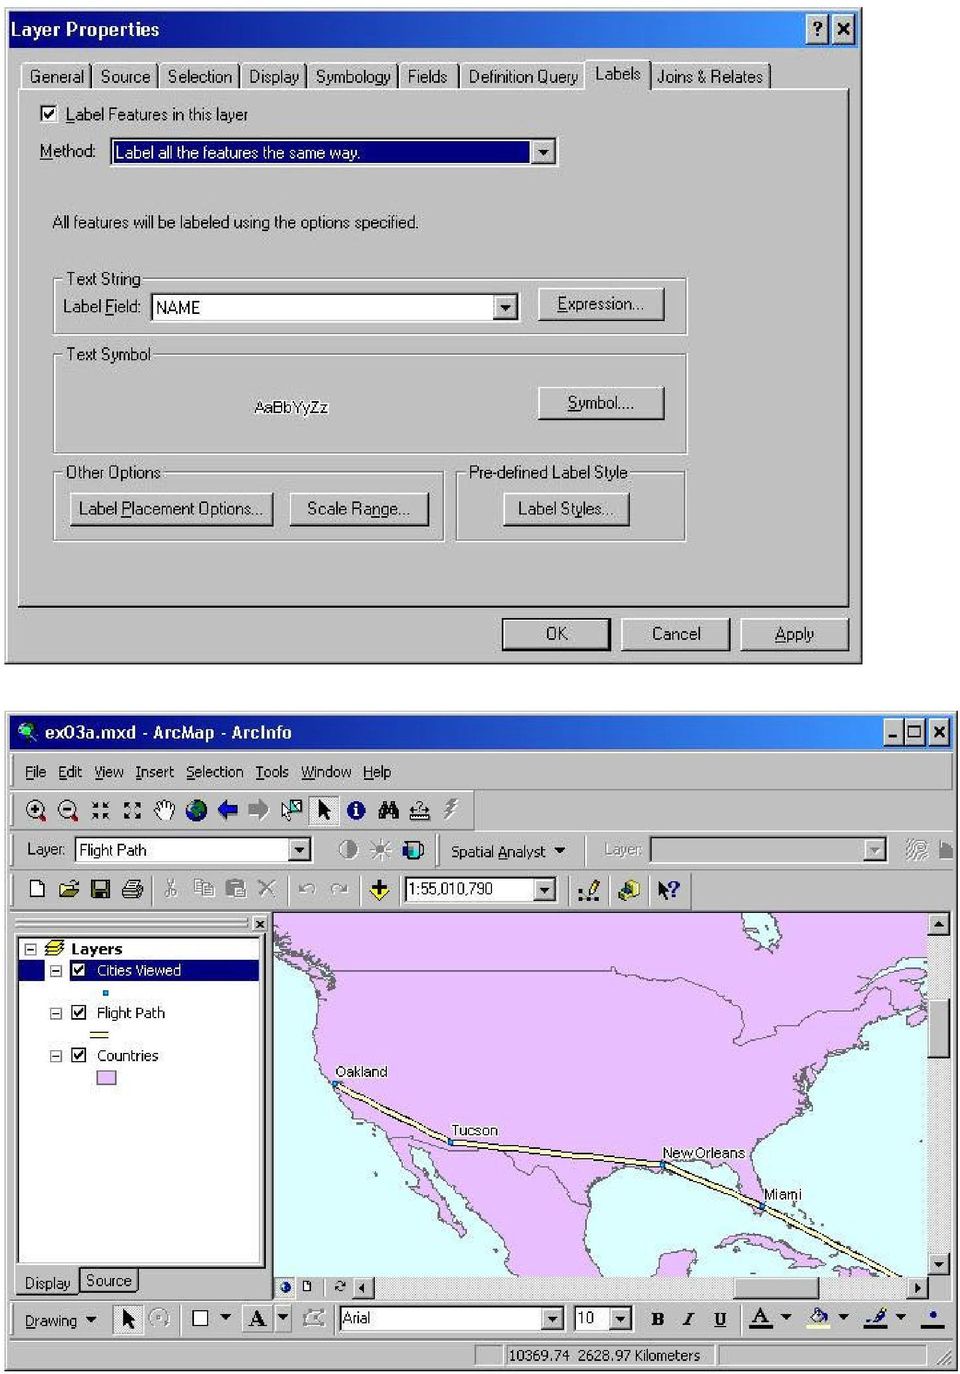
7 (11) You can now adjust the zoomed layer. i.e. move up, down, right or left using the Pan tool. To do this, click on the Pan tool, using the new cursor, click on the map and move the cursor in which ever direction you want. (12) Now you are going to label the features. You can label the features of any layer with one of the attribute associated with it. For example the cities layer can be labeled with names of the cities. Before going into labeling the Cities layer, you will have to set the properties for labeling. (13) With the layer zoomed, right click on the Cities layer, and then click on the Properties. In the Layer Properties wizard, click on the Layer tab. You can now select what attribute of the layer should be used for labeling and the properties of the labels. In the wizard, make sure that a check mark is inserted for Label Features in this layer, select Label all the features the same way for Method and select NAME for Label Field. Finally click Apply.
 With the layer zoomed, right click on the Cities layer, and then click on the Properties.")
8
9 (14) Sometimes, you would like to see the attributes of a feature on the map. This can be accomplished using Identity tool. To learn how to do this, pick any city you want, next click on Identity tool, and finally click on the city you have chosen in the Cities layer. (15) Now make the map appear in full extent. To do this just click on Full Extent tool. Do not close this document yet because you will use it for the next section of the exercise.
 Now make the map appear in full extent.")
10 2. Feature attributes and statistics (1) You will now learn how to deal with attribute table associated with the layers. In the Table of Contents (TOC), right click on the Cities Viewed layer and then click on Open Attribute Table.
, right click on the Cities")
11 (2) Scroll down through the table. There are 28 records, one for each city and scroll across the table to look at the attributes. There are ten attributes (fields). Observe the field OBJECTID, which contains a unique identification number for every record. See the Shape field, which has Point for all the records because all the cities are represented by points. The NAME field contains the names of the cities. (3) Scroll back all the way to the left so that you can change the width of the NAME field. To do this, take the cursor to the vertical bar that separates NAME and CAPITAL, so that the cursor changes from arrow headed a double headed, the start dragging the vertical bar on to the left until you start to cut off any of the names. (4) You will now shift NAME field s position. To do this, scroll the attribute table so that you can see the NAME field. Click on the field name to see that the whole column is highlighted in blue color. Release the click. Then click again on the NAME field, you will see that cursor has changed and then drag the NAME field to left of COUNTRY field. Thus the fields can be rearranged in the table.

12 (5) As you have already seen columns can be highlighted, similarly, rows can be highlighted, which is called Selection. (6) You will now select New Orleans city feature by locating it using the NAME attribute from the attribute table. In the table scroll up or down and try to find New Orleans in the NAME field. Once you have found it, click on the left edge which is shaded on the corresponding row to see that the whole row is selected in blue.

13 (7) Because you have selected a row in the table which corresponds to a feature, the feature is also selected in the map. Now minimize the table and go to the map. (8) To look at the selected feature closely, in the map, click on Selection tool, then in the drop down list, click on Zoom To Selected Features.
 To look at the selected feature closely, in the map, click on Selection")
14 (9) Now clear the selection by clicking on Selection tool, then in the drop down list, click on Clear Selected Features. Now zoom to full extent by clicking on Full Extent tool. (10) Rows in a table can be sorted in ascending or descending order based on an attribute. For example you are now going to sort the Cities attribute table according to elevation values. To do open the Cities attribute table again. To do this, right click on the Cities Viewed layer and the click on Open Attribute Table. (11) In the table scroll to the ELEVATION field. Now right click on the field name and then in the drop down click Sort Ascending.
 In the table scroll to the ELEVATION field.")
15 (12) You will see the statistics of the ELEVATION field. Right click on the ELEVATION field name and in drop down click STATISTICS. A wizard appears that shows the statistics. Take a look at it. Close the Do not close the ArcMap document.

16 3. Symbolizing features In the ArcMap document, take a look into the TOC. Observe that below each layer name there is a symbol attached to it. In this section of the exercise you will learn how to change the symbology. Symbology can be changed in different ways. It can be defined by assigning unique symbol to each feature or you can group features of a layer and define a unique symbol for each group. Apart from these there are other ways of symbolizing features. (1) In the ArcMap document which is open, you can observe that for all the features in Countries layer same symbol has been assigned. You will now change the color from default to yellow color. (2) To change the default color, in TOC under Countries layer name right click on the symbol, a drop down color palette appears, go ahead and select yellow color. The change in color is soon reflected in the map.
 In the ArcMap document which is open, you can observe that for all the features in Countries layer same symbol has been assigned.")
17 (3) Now that you have changed the color, you will now change the thickness and color of the country boundaries. (4) To do this, click on the Countries layer symbol which results in the appearance of Symbol Selector wizard. (5) With the wizard open, in the Options frame, change the Outline Width to 1 and change the Outline Color to brown. Once you have done this click Apply. You can now see the change in the boundaries thickness and color.

18

19 (6) You will now change the symbology of the Cities layer. (7) To do this, click on the Cities Viewed layer symbol which results in the appearance of Symbol Selector wizard. (8) In the symbol palette, select the Circle 2 type. (9) With the wizard open, in the Options frame, change the Color to red and change the Size to 10. Once you have done this click Apply. (10) Now you will change the background color of the data frame to Cretean Blue which is blue right now. To do this, right click on the data frame and then click on Properties. (11) In the Data Frame properties wizard, click Frame tab, then select Cretean Blue in the Background drop down. Then click on Apply and OK.
 Now you will change the background color of the data frame to Cretean Blue which is blue right now.")
20 (12) With ArcMap open, change the background of the data frame to white again following the procedure explained in the last paragraph. (13) You now change the symbology based on attribute values. First of all you will make the symbology based on unique values. For example each country can be assigned a different color from others. (14) To change the symbology based on unique value for Countries layer, right click on it, then click on Properties. Then in the wizard that pops up, select Symbology tab. (15) In the left most box which is located under Show, click Categories and then under options below it click on Unique values. You have to now select the name of the field which would have the unique values. To do this select CNTRY_NAME in the drop down for Value field. Next click on the Add All Values button and finally click Apply and OK. You can now see that each country feature has a different color.
 In the left most box which is located under Show, click Categories and then under options below it click on Unique values.")
21 (16) In the TOC, observe that the Symbol legend has a long list of symbols, which had only one value before. To make the legend invisible, click on the minus sign located beside the layer name. (17) You can try out other options for symbolizing, such as Unique vales, many fields and Match to symbols in a style to learn more about symbolizing features.
22 4. Classifying features Classifying features consists of assigning the same symbol type to features that are grouped together based on a criterion. Criteria can be based on Natural breaks, which is default method, defining equal intervals which create classes of equal value ranges etc. (1) You will now classify the country features based on the population values. To change the symbology by combining features into groups, right click Countries layer, and then click on Properties. Then in the wizard that pops up, select Symbology tab. (2) In the left most box which is located under Show, click Quantities and then under options below it click on Graduate colors. You have to now select the name of the field which would be used for classification. To do this select POP_CNTRY in the drop down for Value in the Fields frame, leave the Normalization as none. Normalization could be used
23 for example to classify based on Population density instead of population. If you want you can change the number of classes of classification using Classification frame. Finally, click Apply and OK. You can now see that all the features take one of the five colors shown in the legend, based on the population value. If you look at the legend, you will observe a value equal to -9999, because the population of some the countries are unknown. If the Cities Viewed layer is still labeled, remove the labels by right clicking on the layer and then removing the check mark for Label Features in the drop down. (3) Similarly, there are other options such as charts and multiple attributes type of classification. Try and explore them to learn more about classification of features.
24 5. Making maps for presentations In this part of the exercise, you are going to create a layout, which is the way to display the information which you infer using GIS. Usually this would be the final step in a project. (1) Before going into the details of how to create layouts, change the background of the data frame from white color to light blue color as explained previously, i.e. by using the Data Frame properties wizard. (2) Click the View menu and then click Layout View. (3) On the layout toolbar, click the Zoom Whole Page button to view the layout properly (4) It is important to set up the Page orientation before going into building the layout. Let us use Landscape orientation. To do this, Click File menu and then in the drop down click Page Setup. (5) In the Page Setup dialog, select Landscape for Page Orientation which is located on the Map Size frame.
25 (6) Now you can change the displayed map size, by first clicking on it and then dragging the corners. (7) Next step would be to add a title to this layout. To do this, click on the Insert menu and then Title. A text box appears on the page which contains the ArcMap document name. (8) To change the title, double click on the text box to see its Properties dialog. In the dialog, enter Countries of the world under Text. To change the font and size of the text, click on Change Symbol. In the Symbol Selector wizard, select any font and size you want.
26
27 (9) Now you will insert North arrow in the page. To do this click on Insert menu, then click on North Arrow. North Arrow Selector dialog appears, choose what ever type of symbol you want to insert and click OK. (10) Next insert a scale bar. To do this click on Insert menu, then click on Scale Bar Arrow. Scale Bar Selector dialog appears, choose what ever type of symbol you want to insert and click OK.
28 (11) Next step is to insert legend. To do this click on Insert menu, then click on Legend. In the Legend dialog that appears, remove all the layers except Countries from Legend Items list by selected the removable layers and the clicking the arrow which directs towards the Map Layers list. Click Next.
29 (12) In the next step of the wizard progress, enter a title for legend and select the font and size if you want. Click Next. (13) In the next step of the wizard progress, select the Border and Background of your choice. Click Next. (14) Click Next again. (15) Finally to insert the legend, click Finish (16) Give the layout a finishing touch so that it looks as shown in the image below.
30
Data Visualization. Brief Overview of ArcMap
 Data Visualization Prepared by Francisco Olivera, Ph.D., P.E., Srikanth Koka and Lauren Walker Department of Civil Engineering September 13, 2006 Contents: Brief Overview of ArcMap Goals of the Exercise
University of Arkansas Libraries ArcGIS Desktop Tutorial. Section 2: Manipulating Display Parameters in ArcMap. Symbolizing Features and Rasters:
 : Manipulating Display Parameters in ArcMap Symbolizing Features and Rasters: Data sets that are added to ArcMap a default symbology. The user can change the default symbology for their features (point,
Tutorial 3: Working with Tables Joining Multiple Databases in ArcGIS
 Tutorial 3: Working with Tables Joining Multiple Databases in ArcGIS This tutorial will introduce you to the following concepts: Identifying Attribute Data Sources Converting Tabular Data into GIS Databases
Modifying Colors and Symbols in ArcMap
 Modifying Colors and Symbols in ArcMap Contents Introduction... 1 Displaying Categorical Data... 3 Creating New Categories... 5 Displaying Numeric Data... 6 Graduated Colors... 6 Graduated Symbols... 9
Create a Poster Using Publisher
 Contents 1. Introduction 1. Starting Publisher 2. Create a Poster Template 5. Aligning your images and text 7. Apply a background 12. Add text to your poster 14. Add pictures to your poster 17. Add graphs
In this example, Mrs. Smith is looking to create graphs that represent the ethnic diversity of the 24 students in her 4 th grade class.
 Creating a Pie Graph Step-by-step directions In this example, Mrs. Smith is looking to create graphs that represent the ethnic diversity of the 24 students in her 4 th grade class. 1. Enter Data A. Open
INTRODUCTION to ESRI ARCGIS For Visualization, CPSC 178
 INTRODUCTION to ESRI ARCGIS For Visualization, CPSC 178 1) Navigate to the C:/temp folder 2) Make a directory using your initials. 3) Use your web browser to navigate to www.library.yale.edu/mapcoll/ and
Creating a PowerPoint Poster using Windows
 Creating a PowerPoint Poster using Windows Copyright 2001 Michael Dougherty (michael@nmsu.edu) Purpose The purpose of this tutorial is to illustrate how to create a 3 x 4 ft. poster using PowerPoint. This
Microsoft Access 2010 handout
 Microsoft Access 2010 handout Access 2010 is a relational database program you can use to create and manage large quantities of data. You can use Access to manage anything from a home inventory to a giant
Sample Table. Columns. Column 1 Column 2 Column 3 Row 1 Cell 1 Cell 2 Cell 3 Row 2 Cell 4 Cell 5 Cell 6 Row 3 Cell 7 Cell 8 Cell 9.
 Working with Tables in Microsoft Word The purpose of this document is to lead you through the steps of creating, editing and deleting tables and parts of tables. This document follows a tutorial format
ArcGIS Tutorial: Adding Attribute Data
 ArcGIS Tutorial: Adding Attribute Data Introduction A common need in GIS is to map characteristics, or attributes, of different geographic areas. These maps are called thematic maps. Examples of thematic
3D-GIS in the Cloud USER MANUAL. August, 2014
 3D-GIS in the Cloud USER MANUAL August, 2014 3D GIS in the Cloud User Manual August, 2014 Table of Contents 1. Quick Reference: Navigating and Exploring in the 3D GIS in the Cloud... 2 1.1 Using the Mouse...
Publisher 2010 Cheat Sheet
 April 20, 2012 Publisher 2010 Cheat Sheet Toolbar customize click on arrow and then check the ones you want a shortcut for File Tab (has new, open save, print, and shows recent documents, and has choices
Business Objects Version 5 : Introduction
 Business Objects Version 5 : Introduction Page 1 TABLE OF CONTENTS Introduction About Business Objects Changing Your Password Retrieving Pre-Defined Reports Formatting Your Report Using the Slice and Dice
Communicate: In Print
 Communicate: In Print A simple guide Work areas Communicate: In Print has two different modes in which to edit your documents: Create and Adjust modes. These are easily interchangeable and the toolbars
DESIGN A WEB SITE USING PUBLISHER Before you begin, plan your Web site
 Page 1 of 22 DESIGN A WEB SITE USING PUBLISHER Before you begin, plan your Web site Before you create your Web site, ask yourself these questions: What do I want the site to do? Whom do I want to visit
Merging Labels, Letters, and Envelopes Word 2013
 Merging Labels, Letters, and Envelopes Word 2013 Merging... 1 Types of Merges... 1 The Merging Process... 2 Labels - A Page of the Same... 2 Labels - A Blank Page... 3 Creating Custom Labels... 3 Merged
GUIDELINES FOR PREPARING POSTERS USING POWERPOINT PRESENTATION SOFTWARE
 Society for the Teaching of Psychology (APA Division 2) OFFICE OF TEACHING RESOURCES IN PSYCHOLOGY (OTRP) Department of Psychology, Georgia Southern University, P. O. Box 8041, Statesboro, GA 30460-8041
Extracting Aerial Images From GIS Based Ortho Photos Using ArcMap 9
 Extracting Aerial Images From GIS Based Ortho Photos Using ArcMap 9 Tutorial Updated August 2006 CP-208 Plan Preparation Studio - Prof. Elizabeth Macdonald 2 In this tutorial we will learn to extract aerial
Basic Pivot Tables. To begin your pivot table, choose Data, Pivot Table and Pivot Chart Report. 1 of 18
 Basic Pivot Tables Pivot tables summarize data in a quick and easy way. In your job, you could use pivot tables to summarize actual expenses by fund type by object or total amounts. Make sure you do not
Tutorial 3 - Map Symbology in ArcGIS
 Tutorial 3 - Map Symbology in ArcGIS Introduction ArcGIS provides many ways to display and analyze map features. Although not specifically a map-making or cartographic program, ArcGIS does feature a wide
Symbolizing your data
 Symbolizing your data 6 IN THIS CHAPTER A map gallery Drawing all features with one symbol Drawing features to show categories like names or types Managing categories Ways to map quantitative data Standard
Tutorials. If you have any questions, comments, or suggestions about these lessons, don't hesitate to contact us at support@kidasa.com.
 Tutorials The lesson schedules for these tutorials were installed when you installed Milestones Professional 2010. They can be accessed under File Open a File Lesson Chart. If you have any questions, comments,
Excel 2003 Tutorial I
 This tutorial was adapted from a tutorial by see its complete version at http://www.fgcu.edu/support/office2000/excel/index.html Excel 2003 Tutorial I Spreadsheet Basics Screen Layout Title bar Menu bar
Introduction to Microsoft Word 2003
 Introduction to Microsoft Word 2003 Sabeera Kulkarni Information Technology Lab School of Information University of Texas at Austin Fall 2004 1. Objective This tutorial is designed for users who are new
Microsoft Word 2010. Quick Reference Guide. Union Institute & University
 Microsoft Word 2010 Quick Reference Guide Union Institute & University Contents Using Word Help (F1)... 4 Window Contents:... 4 File tab... 4 Quick Access Toolbar... 5 Backstage View... 5 The Ribbon...
Advanced Presentation Features and Animation
 There are three features that you should remember as you work within PowerPoint 2007: the Microsoft Office Button, the Quick Access Toolbar, and the Ribbon. The function of these features will be more
WHAT S NEW IN WORD 2010 & HOW TO CUSTOMIZE IT
 WHAT S NEW IN WORD 2010 & HOW TO CUSTOMIZE IT The Ribbon... 2 Default Tabs... 2 Contextual Tabs... 2 Minimizing and Restoring the Ribbon... 3 Customizing the Ribbon... 3 A New Graphic Interface... 5 Live
Using Microsoft Word. Working With Objects
 Using Microsoft Word Many Word documents will require elements that were created in programs other than Word, such as the picture to the right. Nontext elements in a document are referred to as Objects
Microsoft Word 2010 Prepared by Computing Services at the Eastman School of Music July 2010
 Microsoft Word 2010 Prepared by Computing Services at the Eastman School of Music July 2010 Contents Microsoft Office Interface... 4 File Ribbon Tab... 5 Microsoft Office Quick Access Toolbar... 6 Appearance
Prism 6 Step-by-Step Example Linear Standard Curves Interpolating from a standard curve is a common way of quantifying the concentration of a sample.
 Prism 6 Step-by-Step Example Linear Standard Curves Interpolating from a standard curve is a common way of quantifying the concentration of a sample. Step 1 is to construct a standard curve that defines
MetroBoston DataCommon Training
 MetroBoston DataCommon Training Whether you are a data novice or an expert researcher, the MetroBoston DataCommon can help you get the information you need to learn more about your community, understand
WFP Liberia Country Office
 1 Oscar Gobbato oscar.gobbato@wfp.org oscar.gobbato@libero.it WFP Liberia Country Office GIS training - Summary Objectives 1 To introduce to participants the basic concepts and techniques in using Geographic
Government 1008: Introduction to Geographic Information Systems. LAB EXERCISE 4: Got Database?
 Government 1008: Introduction to Geographic Information Systems Objectives: Creating geodatabases Joining attribute tables Attribute and location based queries Spatial joins Creating spatial and attribute
Intro to Excel spreadsheets
 Intro to Excel spreadsheets What are the objectives of this document? The objectives of document are: 1. Familiarize you with what a spreadsheet is, how it works, and what its capabilities are; 2. Using
Getting Started with Excel 2008. Table of Contents
 Table of Contents Elements of An Excel Document... 2 Resizing and Hiding Columns and Rows... 3 Using Panes to Create Spreadsheet Headers... 3 Using the AutoFill Command... 4 Using AutoFill for Sequences...
Getting Started With Mortgage MarketSmart
 Getting Started With Mortgage MarketSmart We are excited that you are using Mortgage MarketSmart and hope that you will enjoy being one of its first users. This Getting Started guide is a work in progress,
Basic Microsoft Excel 2007
 Basic Microsoft Excel 2007 The biggest difference between Excel 2007 and its predecessors is the new layout. All of the old functions are still there (with some new additions), but they are now located
Basic Excel Handbook
 2 5 2 7 1 1 0 4 3 9 8 1 Basic Excel Handbook Version 3.6 May 6, 2008 Contents Contents... 1 Part I: Background Information...3 About This Handbook... 4 Excel Terminology... 5 Excel Terminology (cont.)...
DIRECTIONS FOR SETTING UP LABELS FOR MARCO S INSERT STOCK IN WORD PERFECT, MS WORD AND ACCESS
 DIRECTIONS FOR SETTING UP LABELS FOR MARCO S INSERT STOCK IN WORD PERFECT, MS WORD AND ACCESS WORD PERFECT FORMAT MARCO ITEM #A-3LI - 2.25 H x 3W Inserts First create a new document. From the main page
DOING MORE WITH WORD: MICROSOFT OFFICE 2010
 University of North Carolina at Chapel Hill Libraries Carrboro Cybrary Chapel Hill Public Library Durham County Public Library DOING MORE WITH WORD: MICROSOFT OFFICE 2010 GETTING STARTED PAGE 02 Prerequisites
ArcGIS online Introduction... 2. Module 1: How to create a basic map on ArcGIS online... 3. Creating a public account with ArcGIS online...
 Table of Contents ArcGIS online Introduction... 2 Module 1: How to create a basic map on ArcGIS online... 3 Creating a public account with ArcGIS online... 3 Opening a Map, Adding a Basemap and then Saving
MS Word 2007 practical notes
 MS Word 2007 practical notes Contents Opening Microsoft Word 2007 in the practical room... 4 Screen Layout... 4 The Microsoft Office Button... 4 The Ribbon... 5 Quick Access Toolbar... 5 Moving in the
Spotfire v6 New Features. TIBCO Spotfire Delta Training Jumpstart
 Spotfire v6 New Features TIBCO Spotfire Delta Training Jumpstart Map charts New map chart Layers control Navigation control Interaction mode control Scale Web map Creating a map chart Layers are added
Excel 2007 Basic knowledge
 Ribbon menu The Ribbon menu system with tabs for various Excel commands. This Ribbon system replaces the traditional menus used with Excel 2003. Above the Ribbon in the upper-left corner is the Microsoft
Spatial Adjustment Tools: The Tutorial
 Spatial Adjustment Tools: The Tutorial By Peter Kasianchuk, ESRI Educational Services In this exercise, you will perform some spatial adjustment and data management operations data to be used in analysis
Creating Figure Ground Maps in ArcMap 10.x: Basic procedures to download, open, manipulate and print spatial data
 Creating Figure Ground Maps in ArcMap 10.x: Basic procedures to download, open, manipulate and print spatial data These procedures outline: A. Retrieving Property Data B. Uncompressing the Downloaded Files
Creating and Using Links and Bookmarks in PDF Documents
 Creating and Using Links and Bookmarks in PDF Documents After making a document into a PDF, there may be times when you will need to make links or bookmarks within that PDF to aid navigation through the
CREATING EXCEL PIVOT TABLES AND PIVOT CHARTS FOR LIBRARY QUESTIONNAIRE RESULTS
 CREATING EXCEL PIVOT TABLES AND PIVOT CHARTS FOR LIBRARY QUESTIONNAIRE RESULTS An Excel Pivot Table is an interactive table that summarizes large amounts of data. It allows the user to view and manipulate
Ohio University Computer Services Center August, 2002 Crystal Reports Introduction Quick Reference Guide
 Open Crystal Reports From the Windows Start menu choose Programs and then Crystal Reports. Creating a Blank Report Ohio University Computer Services Center August, 2002 Crystal Reports Introduction Quick
Making Visio Diagrams Come Alive with Data
 Making Visio Diagrams Come Alive with Data An Information Commons Workshop Making Visio Diagrams Come Alive with Data Page Workshop Why Add Data to A Diagram? Here are comparisons of a flow chart with
Petrel TIPS&TRICKS from SCM
 Petrel TIPS&TRICKS from SCM Knowledge Worth Sharing Building Montages in Petrel Most Petrel projects require display maps to be made for presentations; either for partners or peers. This TIPS&TRICKS provides
Week 5 Cookbook: GIS Tutorial Chapter 2 GIS Map Design: Choropleth Maps
 Week 5 Cookbook: GIS Tutorial Chapter 2 GIS Map Design: Choropleth Maps Week 5 Overview 1. Introducing Choropleth Maps 2. Introducing Map Elements 3. First Hands-On Example 4. Your Turn: GIS Tutorial Chapter
To Begin Customize Office
 To Begin Customize Office Each of us needs to set up a work environment that is comfortable and meets our individual needs. As you work with Office 2007, you may choose to modify the options that are available.
Introduction to Visio 2003 By Kristin Davis Information Technology Lab School of Information The University of Texas at Austin Summer 2005
 Introduction to Visio 2003 By Kristin Davis Information Technology Lab School of Information The University of Texas at Austin Summer 2005 Introduction This tutorial is designed for people who are new
Word basics. Before you begin. What you'll learn. Requirements. Estimated time to complete:
 Word basics Word is a powerful word processing and layout application, but to use it most effectively, you first have to understand the basics. This tutorial introduces some of the tasks and features that
ITS Training Class Charts and PivotTables Using Excel 2007
 When you have a large amount of data and you need to get summary information and graph it, the PivotTable and PivotChart tools in Microsoft Excel will be the answer. The data does not need to be in one
Microsoft Publisher 2010 What s New!
 Microsoft Publisher 2010 What s New! INTRODUCTION Microsoft Publisher 2010 is a desktop publishing program used to create professional looking publications and communication materials for print. A new
Scientific Graphing in Excel 2010
 Scientific Graphing in Excel 2010 When you start Excel, you will see the screen below. Various parts of the display are labelled in red, with arrows, to define the terms used in the remainder of this overview.
In this session, we will explain some of the basics of word processing. 1. Start Microsoft Word 11. Edit the Document cut & move
 WORD PROCESSING In this session, we will explain some of the basics of word processing. The following are the outlines: 1. Start Microsoft Word 11. Edit the Document cut & move 2. Describe the Word Screen
Microsoft Excel 2010 Tutorial
 1 Microsoft Excel 2010 Tutorial Excel is a spreadsheet program in the Microsoft Office system. You can use Excel to create and format workbooks (a collection of spreadsheets) in order to analyze data and
Microsoft Word defaults to left justified (aligned) paragraphs. This means that new lines automatically line up with the left margin.
 paragraphs. This means that new lines automatically line up with the left margin.") Microsoft Word Part 2 Office 2007 Microsoft Word 2007 Part 2 Alignment Microsoft Word defaults to left justified (aligned) paragraphs. This means that new lines automatically line up with the left margin.
Microsoft Word Part 2 Office 2007 Microsoft Word 2007 Part 2 Alignment Microsoft Word defaults to left justified (aligned) paragraphs. This means that new lines automatically line up with the left margin.
PowerPoint 2007: Basics Learning Guide
 PowerPoint 2007: Basics Learning Guide What s a PowerPoint Slide? PowerPoint presentations are composed of slides, just like conventional presentations. Like a 35mm film-based slide, each PowerPoint slide
Entering the example employee satisfaction survey in Survey Crafter Professional s Survey Designer window
 Survey Crafter, Inc. Survey Crafter Walkthrough Summary: Walkthrough: Applies to: Topic: Synopsis This tutorial walks you through entering the example employee satisfaction survey in Survey Crafter Professional
Create a folder on your network drive called DEM. This is where data for the first part of this lesson will be stored.
 In this lesson you will create a Digital Elevation Model (DEM). A DEM is a gridded array of elevations. In its raw form it is an ASCII, or text, file. First, you will interpolate elevations on a topographic
Microsoft Excel 2010 Charts and Graphs
 Microsoft Excel 2010 Charts and Graphs Email: training@health.ufl.edu Web Page: http://training.health.ufl.edu Microsoft Excel 2010: Charts and Graphs 2.0 hours Topics include data groupings; creating
MicroStrategy Analytics Express User Guide
 MicroStrategy Analytics Express User Guide Analyzing Data with MicroStrategy Analytics Express Version: 4.0 Document Number: 09770040 CONTENTS 1. Getting Started with MicroStrategy Analytics Express Introduction...
PowerPoint 2013: Basic Skills
 PowerPoint 2013: Basic Skills Information Technology September 1, 2014 1 P a g e Getting Started There are a variety of ways to start using PowerPoint software. You can click on a shortcut on your desktop
Computer Training Centre University College Cork. Excel 2013 Pivot Tables
 Computer Training Centre University College Cork Excel 2013 Pivot Tables Table of Contents Pivot Tables... 1 Changing the Value Field Settings... 2 Refreshing the Data... 3 Refresh Data when opening a
Handout: Word 2010 Tips and Shortcuts
 Word 2010: Tips and Shortcuts Table of Contents EXPORT A CUSTOMIZED QUICK ACCESS TOOLBAR... 2 IMPORT A CUSTOMIZED QUICK ACCESS TOOLBAR... 2 USE THE FORMAT PAINTER... 3 REPEAT THE LAST ACTION... 3 SHOW
NetCDF Tutorial. Copyright 1995-2010 Esri All rights reserved.
 Copyright 1995-2010 Esri All rights reserved. Table of Contents About the netcdf Tutorial............................... 3 Exercise 1: Displaying a raster layer from a netcdf file................... 4
Making Your Computer Work for You Tips for Windows 7, Laptops, Internet Explorer, MS Office and Adobe Acrobat
 Making Your Computer Work for You Tips for Windows 7, Laptops, Internet Explorer, MS Office and Adobe Acrobat By Drew Kottke Bureau of Technical Services Division of Transportation Systems Development
Microsoft Excel 2013 Tutorial
 Microsoft Excel 2013 Tutorial TABLE OF CONTENTS 1. Getting Started Pg. 3 2. Creating A New Document Pg. 3 3. Saving Your Document Pg. 4 4. Toolbars Pg. 4 5. Formatting Pg. 6 Working With Cells Pg. 6 Changing
Google Docs Basics Website: http://etc.usf.edu/te/
 Website: http://etc.usf.edu/te/ Google Docs is a free web-based office suite that allows you to store documents online so you can access them from any computer with an internet connection. With Google
Geodatabase Tutorial. Copyright 1995-2010 Esri All rights reserved.
 Copyright 1995-2010 Esri All rights reserved. Table of Contents A quick tour of the Building a geodatabase tutorial..................... 3 Exercise 1: Organizing your data in the Catalog......................
Custom Reporting System User Guide
 Citibank Custom Reporting System User Guide April 2012 Version 8.1.1 Transaction Services Citibank Custom Reporting System User Guide Table of Contents Table of Contents User Guide Overview...2 Subscribe
JustClust User Manual
 JustClust User Manual Contents 1. Installing JustClust 2. Running JustClust 3. Basic Usage of JustClust 3.1. Creating a Network 3.2. Clustering a Network 3.3. Applying a Layout 3.4. Saving and Loading
CONSTRUCTING SINGLE-SUBJECT REVERSAL DESIGN GRAPHS USING MICROSOFT WORD : A COMPREHENSIVE TUTORIAL
 CONSTRUCTING SINGLE-SUBJECT REVERSAL DESIGN GRAPHS USING MICROSOFT WORD : A COMPREHENSIVE TUTORIAL PATRICK GREHAN ADELPHI UNIVERSITY DANIEL J. MORAN MIDAMERICAN PSYCHOLOGICAL INSTITUTE This document is
Workspaces Creating and Opening Pages Creating Ticker Lists Looking up Ticker Symbols Ticker Sync Groups Market Summary Snap Quote Key Statistics
 Getting Started Workspaces Creating and Opening Pages Creating Ticker Lists Looking up Ticker Symbols Ticker Sync Groups Market Summary Snap Quote Key Statistics Snap Report Price Charts Comparing Price
Computer Skills Microsoft Excel Creating Pie & Column Charts
 Computer Skills Microsoft Excel Creating Pie & Column Charts In this exercise, we will learn how to display data using a pie chart and a column chart, color-code the charts, and label the charts. Part
MicroStrategy Quick Guide: Running the PI Report ITU Data Mart Support Group Go to reporting.gmu.edu and click on Login to Microstrategy
 MicroStrategy Quick Guide: Running the PI Report ITU Data Mart Support Group Go to reporting.gmu.edu and click on Login to Microstrategy ACTION Enter User name and Password. Keep default selection of LDAP
Presentation of results
 CHAPTER 13 Presentation of results Data presentation is the procedure by which information from a GIS is presented in a form suitable for the user. Remember that the results of a GIS analysis are used
Creating Forms with Acrobat 10
 Creating Forms with Acrobat 10 Copyright 2013, Software Application Training, West Chester University. A member of the Pennsylvania State Systems of Higher Education. No portion of this document may be
Create Charts in Excel
 Create Charts in Excel Table of Contents OVERVIEW OF CHARTING... 1 AVAILABLE CHART TYPES... 2 PIE CHARTS... 2 BAR CHARTS... 3 CREATING CHARTS IN EXCEL... 3 CREATE A CHART... 3 HOW TO CHANGE THE LOCATION
All V7 registers support barcode printing, except the Sharp 410/420 1A ROM and that limitation is based upon the register.
 Tools Section Barcode Printing These are basic instructions for Version 7 Polling barcode printing. Users will need to have a PLU/UPC file containing either UPC-A, UPC-E, EAN 13 or EAN 8 numbers, label
Enhanced Formatting and Document Management. Word 2010. Unit 3 Module 3. Diocese of St. Petersburg Office of Training Training@dosp.
 Enhanced Formatting and Document Management Word 2010 Unit 3 Module 3 Diocese of St. Petersburg Office of Training Training@dosp.org This Page Left Intentionally Blank Diocese of St. Petersburg 9/5/2014
Excel for Data Cleaning and Management
 Excel for Data Cleaning and Management Background Information This workshop is designed to teach skills in Excel that will help you manage data from large imports and save them for further use in SPSS
Getting Started with the ArcGIS Predictive Analysis Add-In
 Getting Started with the ArcGIS Predictive Analysis Add-In Table of Contents ArcGIS Predictive Analysis Add-In....................................... 3 Getting Started 4..............................................
Microsoft Access 2000
 Microsoft Access 2000 Level 1 Region 4 Teaching, Learning and Technology Center Kaplan, LA Activity 1 Creating a Database 1. Open Microsoft Access 2000 a. Click on START, highlight Programs, point and
Linear Referencing Tutorial
 Copyright 1995-2010 Esri All rights reserved. Table of Contents An overview of the linear referencing tutorial........................ 3 Exercise 1: Organizing your linear referencing data in ArcCatalog...............
Introduction to Microsoft Excel 2007/2010
 to Microsoft Excel 2007/2010 Abstract: Microsoft Excel is one of the most powerful and widely used spreadsheet applications available today. Excel's functionality and popularity have made it an essential
Click on various options: Publications by Wizard Publications by Design Blank Publication
 Click on various options: Publications by Wizard Publications by Design Blank Publication Select the Blank Publications Tab: Choose a blank full page Click on Create New Page Insert > Page Select the number
9 CREATING REPORTS WITH REPORT WIZARD AND REPORT DESIGNER
 9 CREATING REPORTS WITH REPORT WIZARD AND REPORT DESIGNER 9.1 INTRODUCTION Till now you have learned about creating Table, Query and Form using the respective Wizard and Designer mode. Every application
Maplex Tutorial. Copyright 1995-2010 Esri All rights reserved.
 Copyright 1995-2010 Esri All rights reserved. Table of Contents Introduction to the Maplex tutorial............................ 3 Exercise 1: Enabling Maplex for ArcGIS and adding the Labeling toolbar............
SMART Ink 1.5. Windows operating systems. Scan the following QR code to view the SMART Ink Help on your smart phone or other mobile device.
 SMART Ink 1.5 Windows operating systems User s guide Scan the following QR code to view the SMART Ink Help on your smart phone or other mobile device. Trademark notice SMART Ink, SMART Notebook, SMART
EXCEL 2007. Using Excel for Data Query & Management. Information Technology. MS Office Excel 2007 Users Guide. IT Training & Development
 Information Technology MS Office Excel 2007 Users Guide EXCEL 2007 Using Excel for Data Query & Management IT Training & Development (818) 677-1700 Training@csun.edu http://www.csun.edu/training TABLE
Pivot Tables & Pivot Charts
 Pivot Tables & Pivot Charts Pivot tables... 2 Creating pivot table using the wizard...2 The pivot table toolbar...5 Analysing data in a pivot table...5 Pivot Charts... 6 Creating a pivot chart using the
Microsoft Access Basics
 Microsoft Access Basics 2006 ipic Development Group, LLC Authored by James D Ballotti Microsoft, Access, Excel, Word, and Office are registered trademarks of the Microsoft Corporation Version 1 - Revision
Access II 2007 Workshop
 Access II 2007 Workshop Query & Report I. Review Tables/Forms Ways to create tables: tables, templates & design Edit tables: new fields & table properties Import option Link tables: Relationship Forms