Climate change induced drought effects on
|
|
|
- Archibald White
- 7 years ago
- Views:
Transcription


1 Climate change induced drought effects on forest growth and vulnerability Climforisk Mikko Peltoniemi, Sanna Härkönen, Aleksi Lehtonen, and rest of the research group at Metla At FAO e/c LIFE09 ENV/FI/ Climate change induced drought effects on forest growth and vulnerability (Climforisk,
2 Contents Introduction Climate change in Finland Climate change and Finnish forests Aims of Climforisk project Materials and Methodology Data model approach in Climforisk Model development Pest/Pathogen modelling Methodology premiers in test regions (Sanna Härkönen) Few words about broad scale applicability of the method (Aleksi Lehtonen)
![Climate change in Finland Temperatures Climate has already changed + 1 C in Finland in past 100 a [1] More extreme temperatures [2] + 5](/docs-images/61/46159844/images/3-1.png "6 C increase expected td[3] Less extreme frost More heat waves [1] Tietäväinen, H, Tuomenvirta, H, Venäläinen, A., 2010.")

3 Climate change in Finland Temperatures Climate has already changed + 1 C in Finland in past 100 a [1] More extreme temperatures [2] C increase expected td[3] Less extreme frost More heat waves [1] Tietäväinen, H, Tuomenvirta, H, Venäläinen, A., Annual and seasonal mean temperatures in Finland during the last 160 years based on gridded temperature data. Int. J. Climatol.30: 15, [2] Räisänen, J. ja L. Ruokolainen, 2008a, Estimating present climate in a warming world: a model-based approach. Climate Dynamics, 31,


 Growing Go gseason")


![DECR REASE BY END OF CENTURY [3]](/docs-images/61/46159844/images/4-5.png "Jylhä, K., Ruosteenoja, K.")


4 Climate change in Finland seasons FEBRUARY, MEAN TEMPERATURE CHANGE North: considerable winter warming Snow cover reduces by 20% (north) 60% (south) Growing Go gseason lengthtens throughout the country by days MAX. SNOW WATER CONTE ENT DECREASE BY END OF CENTURY GROWING G SEASON DECR REASE BY END OF CENTURY [3] Jylhä, K., Ruosteenoja, K., Räisänen, J., Venäläinen, A., Ruokolainen, L., Saku, S. ja Seitola, T., Arvioita Suomen muuttuvasta ilmastosta sopeutumistutkimuksia varten, ACCLIM-hankkeen raportti 2009.
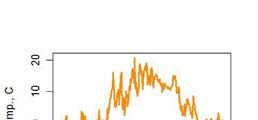
5 Climate change in Finland water Precipitation increases distribution changes little RH% remains same [4] VPD increases Evapotranspiration increases Soil water is uncertain CHANGE-% RELATIVE TO CURRET RAINFALL [4] Dressler and Sherwood, 2009, A Matter of Humidity, Science, vol 323,
6 Climate change and (Finnish) forests CO 2 and T changes promote photosynthesis Season changes allow longer growth periods Increased growth and biomass Soils: Soil ΔC Increasing T promotes soil respiration Increased growth and biomass infers more C to soil
7 Finnish forests get denser: management effect milj. m³ GROWING STOCK IN FOREST LAND Puuston tilavuus metsä- ja kitumaalla Kokonaistilavuus TOTAL VOLUME Manty Scots pine Kuusi Norway Spruce Lehtipuu Deciduous Fig: Salminen, 2008, MELA-estimates


8 Forest damages Driven by climate and forest structure Most pests/pathogens benefit from longer seasons Many insects benefit from drought and temperature increases Abiotic: weather extremes New species from south, e.g. Acantholyda posticalis Dothistroma septosporum Fig: Michael Müller, Metla Fig: Antti Pouttu, Metla
9 Topical questions How will climate change influence forests in Finland? Information to support decision making needed How changes in carbon balances and forest How changes in carbon balances and forest vulnerabilities to pest/pathogen are distributed in Finland?
10 Climforisk Aims Providing tools for climate assessments of forests Collect and merge forest related data sources and models together Evaluates how climate and climate change influence: forest carbon sinks pest/pathogen vulnerability Evaluate lacks in current data and models what more/else is needed? Disseminates results to the public
 NFI plot data")


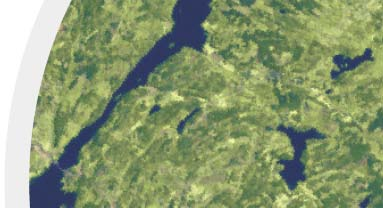
11 Forest structure data (Fig, E. Oksanen n/metla) NFI plot data NFI plot level data Plot level level predictions of biomass, LAI NFI plot level data provides the basis for knngeneralization of data to wall to wall maps LANDSAT + CLC (Fig. NFI)
 Digital soil map:")


12 Soil data Topographical map + DEM (Fig. Paikkatietoikkuna) Digital soil map: variable sized polygons > 6.25 ha; mean soil depth, texture Topographical map and DEM, resolution ~ 25 m Bring high resolution elements from topo map to soil map Drought index, shallow soils Soil map + elements from topgraphical map


13 Modelling GPP and water balance Predicting GPP, ET and soil water Additionally: soil C model growth allocation submodel Droughteffect proxies? Predictions will be made for NFI sampleplotsandscaled plots and scaled wall to wall Finland knn vs. direct prediction on map cells. Use soil map + DEM


14 Modelling GPP and water balance An ecosystem model that links carbon and water balances Model inputs are minimal: Climate data LAI from NFI plots Soil depth from NFI plots (shallow, medium, deep)
15 Submodel: GPP Model based on LUE appoarch (Mäkelä et al 2008, GCB) Transparent and easy to calibrate! P = βf appfd φf L f T min{f D, f W } P = GPP β = potential ti llue Φ = PPFD f appfd for fraction of PPFD absorbed bed f L = for ligth saturation of photosynthesis f T for season and temperature f D for vapour pressure deficit, VPD f W for soil water (estimated from REW) Environmental modifiers [0,1] Account for suboptimal Growing conditions -Simple empirical functions -
16 Submodel: ET P E = β D + α (1- f ) f φ βe κ appfd W, E D Transpiration Driven by VPD Evaporation Driven by PPFD reaching soil Predictive power equals to Penman-Monteith at two forested eddy-covariance sites (south and north Finland) Does not need Rnet or windspeed as Penman-Monteith Will provide basis for drought index in the project


17 Model s other water balance components Rainfillssmallcanopy small water storage until it pours over to soil Single layer model for soil water Rain is snow in winter Snow melts according to temperature coeff. Evapotranspiration empties: 1. CW 2. snow 3. soil water
18 Model calibration Two forested eddy covariance sites (Hyytiälä and Sodankylä) Bayesian calibration assimilates different data Adaptive Markov Chain Monte Carlo Allows calibration of the GPP, ET and Soil water components at the same time Joint likelihood of all predictions and measurements used Non informative prior distributions of parameters


19 Calibration study (poster* at Joint calibration Atrium) All 16 parameters calibrated in one long MCMC run Separate calibration Submodels calibrated separately against measurements (GPP: 8, ET: 5, SW: 3 parameters) Model performance tested in application case: no measurements of GPP, ET and SW as inputs * Peltoniemi, M., Pulkkinen, M., Mäkelä, A.: Joint vs. separate calibration of GPP, ET and soil water model.
20 Soil water
21 GPP and ET Joint calibration of model: GPP and ET predictions as good as they get Separate calibration of submodels: GPP and ET predictions suffer from poor SW predictions. Jointcalibrationprovides better predictive power, especially for cases where the effect of soil water gets important (= under drought)


22 PESTS AND PATHOGENS
23 Pest/Pathogen observations ICP level I plots, N~3000 Permanently monitored Tree and site properties as in NFI Forest health measurements on > 600 plots Pest/pathogens identified ifi d NFI plot data
24 Life cycle of a pest: D. sertifer Predators Birds, mammals, ants, etc. Egg parasites eggs Winter N. sertifer N. Summer Climate factors Winter minimum T Summer T Rainfall Parasites Diseases SURROUNDING LANDSCAPE N Resin Phenological changes Needle quality /tree vitality Scots pine tree / stand Soil factors
25 Life cycle of a pest: D. sertifer Predators Birds, mammals, ants, etc. Egg parasites Pest damage caused N. sertifer by adult D. sertifer Climate factors Winter minimum T Summer T Rainfall Parasites Diseases SURROUNDING LANDSCAPE N Resin Phenological changes Needle quality /tree vitality Scots pine tree/stand Soil factors


26 Predicting pests/pathogens vulnerability Identify key variables influencing life cycle of specific pests/pathogens Formulate prediction models based on collected data SOIL VARIABILITY SNOW, mmh 2 O GPP


27 Feasibility test: Model predictions and pests/pathogens t/ th FIG: Model predictions of drought days vs. drought damage observations at ICP I level plots (fig. P. Muukkonen, T. Linkosalo) Correlating modelled drought and measured drought damages show positive relationship between the years Spatial correlations within ihi a year marginal or non existent Soil type seems to be decisive

28 Research group: Mikko Peltoniemi, Aleksi Lehtonen, Seppo Neuvonen, Eeva Karjalainen, Sanna Härkönen, Petteri Muukkonen, Kalle Eerikäinen, Heikki Parikka, Sakari Tuominen, Martti Lindgren, Pekka Tamminen, Jukka Pöntinen, Seppo Nevalainen, Juha Heikkinen, Paula Puolakka, Tapio Linkosalo, Risto Sievänen, Minna Pulkkinen (UH), Eero Nikinmaa (UH), Annikki Mäkelä (UH) Contacts: Mikko Peltoniemi (Metla) p Aleksi Lehtonen, (Metla) p Annikki Mäkelä (University of Helsinki) LIFE09 ENV/FI/ Climate change induced drought effects on forest growth and vulnerability (Climforisk)
29 Thank you LIFE09 ENV/FI/ Climate change induced d drought effects on forest growth and vulnerability (Climforisk,
Testing steady states carbon stocks of Yasso07 and ROMUL models against soil inventory data in Finland
 Testing steady states carbon stocks of Yasso07 and ROMUL models against soil inventory data in Finland A. Lehtonen 1, T. Linkosalo 2, J. Heikkinen 1, M. Peltoniemi 1, R. Sievänen 1, R. Mäkipää 1, P. Tamminen
THE ECOSYSTEM - Biomes
 Biomes The Ecosystem - Biomes Side 2 THE ECOSYSTEM - Biomes By the end of this topic you should be able to:- SYLLABUS STATEMENT ASSESSMENT STATEMENT CHECK NOTES 2.4 BIOMES 2.4.1 Define the term biome.
Climate change induced drought effects on forest growth and vulnerability
 LIFE Project Number LIFE09 ENV / FI/000571 Midterm Report Covering the project activities from 1/1/2011 to 31/12/2012 Project location Reporting Date 30/1/2013 CLIMFORISK Climate change induced drought
Uncertainty assessment of forest carbon balance. HMS seminaari 2.9 Vantaa
 Uncertainty assessment of forest carbon balance Research Team Finnish Forest Research Institute Raisa Mäkipää, Mikko Peltoniemi, Aleksi Lehtonen European Forest Institute (EFI) Taru Palosuo, Terhi Kaipainen
LIFE Project Number LIFE09 ENV / FI/000571 Action 4 synthesis report. Reporting Date 31/12/2014
 Project location LIFE Project Number LIFE09 ENV / FI/000571 Action 4 synthesis report Reporting Date 31/12/2014 CLIMFORISK Climate change induced drought effects on forest growth and vulnerability Project
6.4 Taigas and Tundras
 6.4 Taigas and Tundras In this section, you will learn about the largest and coldest biomes on Earth. The taiga is the largest land biome and the tundra is the coldest. The taiga The largest land biome
Measuring spatial structure and its effects on biodiversity in Finland
 Measuring spatial structure and its effects on biodiversity in Finland Raisa Mäkipää Finnish Forest Research Institute Nordic workshop on habitat structure and nature quality May 14-15, 2008, Roskilde,
Changes of coniferous timber and tree lines in Finnish Lapland during 1983-2009
 Workshop Silviculture in Changing Environment November 24-25, 2014 Kirkkonummi, Finland Changes of coniferous timber and tree lines in Finnish Lapland during 1983-2009 Anna Franke, Pasi Aatsinki, Ville
Ecosystems. The two main ecosystem processes: Energy flow and Chemical cycling
 Ecosystems THE REALM OF ECOLOGY Biosphere An island ecosystem A desert spring ecosystem Biosphere Ecosystem Ecology: Interactions between the species in a given habitat and their physical environment.
Key Idea 2: Ecosystems
 Key Idea 2: Ecosystems Ecosystems An ecosystem is a living community of plants and animals sharing an environment with non-living elements such as climate and soil. An example of a small scale ecosystem
Finnish Meteorological Institute, P.O. Box 503, FI-00101 Helsinki 2. University of Joensuu, Faculty of Forest Sciences, P.O. Box 111, FI-80101 Joensuu
 Storm risks on forestry in Finland - occurrence and risk management Ari Venäläinen 1, Hilppa Gregow 1, Heli Peltola 2, Veli-Pekka Ikonen 2 and Seppo Kellomäki 2 1 Finnish Meteorological Institute, P.O.
Current climate change scenarios and risks of extreme events for Northern Europe
 Current climate change scenarios and risks of extreme events for Northern Europe Kirsti Jylhä Climate Research Finnish Meteorological Institute (FMI) Network of Climate Change Risks on Forests (FoRisk)
COTTON WATER RELATIONS
 COTTON WATER RELATIONS Dan R. Krieg 1 INTRODUCTION Water is the most abundant substance on the Earth s surface and yet is the most limiting to maximum productivity of nearly all crop plants. Land plants,
Forest carbon sequestration and climate change. Dr Brian Tobin University College Dublin
 Forest carbon sequestration and climate change Dr Brian Tobin University College Dublin Overview Sequestration what is it & why important? Role of forests in climate change CARBiFOR research project Forest
Climate Futures Evaluation and Synthesis Tool
 Climate Futures Evaluation and Synthesis Tool September 2015 Alexander Epstein, Ben Rasmussen, and Chris Cutler The National Transportation Systems Center Advancing transportation innovation for the public
Consistent estimates of gross primary production of Finnish forests comparison of estimates of two process models
 Boreal Environment Research 20: 196 212 2015 ISSN 1239-6095 (print) ISSN 1797-2469 (online) helsinki 30 April 2015 Consistent estimates of gross primary production of Finnish forests comparison of estimates
Nature Values Screening Using Object-Based Image Analysis of Very High Resolution Remote Sensing Data
 Nature Values Screening Using Object-Based Image Analysis of Very High Resolution Remote Sensing Data Aleksi Räsänen*, Anssi Lensu, Markku Kuitunen Environmental Science and Technology Dept. of Biological
Heikki Turtiainen *, Pauli Nylander and Pekka Puura Vaisala Oyj, Helsinki, Finland. Risto Hölttä Vaisala Inc, Boulder, Colorado
 4.1 A NEW HIGH ACCURACY, LOW MAINTENANCE ALL WEATHER PRECIPITATION GAUGE FOR METEOROLOGICAL, HYDROLOGICAL AND CLIMATOLOGICAL APPLICATIONS Heikki Turtiainen *, Pauli Nylander and Pekka Puura Vaisala Oyj,
http://store.elsevier.com/forest-monitoring/ isbn-9780080982229/ Recommended citation for the full chapter:
 330 V Monitoring Methods for Atmosphere-Related Variables This is a publisher-agreed excerpt of a book chapter from a book published by Elsevier. The full content can be accessed via the following link:
Projections, Predictions, or Trends?
 Projections, Predictions, or Trends? The challenges of projecting changes to fire regimes under climate change Bec Harris 9-11 th October, 2013 What are we looking for? Aims differ, and are more or less
Multi-scale upscaling approaches of soil properties from soil monitoring data
 local scale landscape scale forest stand/ site level (management unit) Multi-scale upscaling approaches of soil properties from soil monitoring data sampling plot level Motivation: The Need for Regionalization
Biology Keystone (PA Core) Quiz Ecology - (BIO.B.4.1.1 ) Ecological Organization, (BIO.B.4.1.2 ) Ecosystem Characteristics, (BIO.B.4.2.
 Quiz Ecology - (BIO.B.4.1.1 ) Ecological Organization, (BIO.B.4.1.2 ) Ecosystem Characteristics, (BIO.B.4.2.") Biology Keystone (PA Core) Quiz Ecology - (BIO.B.4.1.1 ) Ecological Organization, (BIO.B.4.1.2 ) Ecosystem Characteristics, (BIO.B.4.2.1 ) Energy Flow 1) Student Name: Teacher Name: Jared George Date:
Biology Keystone (PA Core) Quiz Ecology - (BIO.B.4.1.1 ) Ecological Organization, (BIO.B.4.1.2 ) Ecosystem Characteristics, (BIO.B.4.2.1 ) Energy Flow 1) Student Name: Teacher Name: Jared George Date:
THE PLANT KINGDOM: THE WATER CYCLE
 THE PLANT KINGDOM: THE WATER CYCLE Material: The Water Cycle Nomenclature The Water cycle Model Water Ice Heat Source (lamp with a clamp) Tables Presentation 1: Key Experience 1. Say, Today we are going
Summary This lesson will introduce the concept of the water cycle by using a simple demonstration.
 Partnerships Implementing Engineering Education Worcester Polytechnic Institute Worcester Public Schools Supported by: National Science Foundation Weather: 4.H.3 Water Cycle Grade Level 4 Sessions Seasonality
Climate, Vegetation, and Landforms
 Climate, Vegetation, and Landforms Definitions Climate is the average weather of a place over many years Geographers discuss five broad types of climates Moderate, dry, tropical, continental, polar Vegetation:
Plants, like all other living organisms have basic needs: a source of nutrition (food),
,") LEARNING FROM LEAVES: A LOOK AT LEAF SIZE Grades 3 6 I. Introduction Plants, like all other living organisms have basic needs: a source of nutrition (food), water, space in which to live, air, and optimal
LEARNING FROM LEAVES: A LOOK AT LEAF SIZE Grades 3 6 I. Introduction Plants, like all other living organisms have basic needs: a source of nutrition (food), water, space in which to live, air, and optimal
GEOGG142 GMES Calibration & validation of EO products
 GEOGG142 GMES Calibration & validation of EO products Dr. Mat Disney mdisney@geog.ucl.ac.uk Pearson Building room 113 020 7679 0592 www.geog.ucl.ac.uk/~mdisney Outline Calibration & validation Example:
Drought in the Czech Republic in 2015 A preliminary summary
 Drought in the Czech Republic in 2015 A preliminary summary October 2015, Prague DISCLAIMER All data used in this preliminary report are operational and might be a subject of change during quality control.
Ecology Module B, Anchor 4
 Ecology Module B, Anchor 4 Key Concepts: - The biological influences on organisms are called biotic factors. The physical components of an ecosystem are called abiotic factors. - Primary producers are
dynamic vegetation model to a semi-arid
 Application of a conceptual distributed dynamic vegetation model to a semi-arid basin, SE of Spain By: M. Pasquato, C. Medici and F. Francés Universidad Politécnica de Valencia - Spain Research Institute
Fire Weather Index: from high resolution climatology to Climate Change impact study
 Fire Weather Index: from high resolution climatology to Climate Change impact study International Conference on current knowledge of Climate Change Impacts on Agriculture and Forestry in Europe COST-WMO
Technology For Adaptation. Forestry Conservation Management. Dr. Javier Aliaga Lordemann
 Technology For Adaptation. Forestry Conservation Management Dr. Javier Aliaga Lordemann Forests has more carbon store than the currently carbon free atmosphere. By contrast, are important sources of emissions
Operational methodology to assess flood damages in Europe
 IIASA-DPRI 2008 Operational methodology to assess flood damages in Europe Contributors: Nicola Lugeri, Carlo Lavalle, Elisabetta Genovese 1 Focus of ADAM work on extremes Types Floods, Heat-wave, Drought
Ecosystem change and landsurface-cloud
 Ecosystem change and landsurface-cloud coupling Alan K. Betts Atmospheric Research, akbetts@aol.com Congress on Climate Change 8)Earth System Feedbacks and Carbon Sequestration Copenhagen, March 10, 2009
Ecosystem-land-surface-BL-cloud coupling as climate changes
 Ecosystem-land-surface-BL-cloud coupling as climate changes Alan K. Betts Atmospheric Research, akbetts@aol.com CMMAP August 19, 2009 Outline of Talk Land-surface climate: - surface, BL & cloud coupling
Biodiversity and Ecosystem Services: Arguments for our Future Environment
 Biodiversity and Ecosystem Services: Arguments for our Future Environment How have we advanced our understanding of the links between biodiversity, ecosystem functions and ecosystem services? The issue
Climate Extremes Research: Recent Findings and New Direc8ons
 Climate Extremes Research: Recent Findings and New Direc8ons Kenneth Kunkel NOAA Cooperative Institute for Climate and Satellites North Carolina State University and National Climatic Data Center h#p://assessment.globalchange.gov
GENERAL WATERING & CARE GUIDE
 GENERAL WATERING & CARE GUIDE Between 30-60 percent of water applied to lawns and gardens is never absorbed by the plants. Water is often wasted because it is applied too quickly and runs off, evaporates
Energy Flow Through an Ecosystem. Food Chains, Food Webs, and Ecological Pyramids
 Energy Flow Through an Ecosystem Food Chains, Food Webs, and Ecological Pyramids What is Ecology? ECOLOGY is a branch of biology that studies ecosystems. Ecological Terminology Environment Ecology Biotic
Matter and Energy in Ecosystems
 Matter and Energy in Ecosystems The interactions that take place among biotic and abiotic factors lead to transfers of energy and matter. Every species has a particular role, or niche, in an ecosystem.
Assessment of cork production in new Quercus suber plantations under future climate. Joana A Paulo Margarida Tomé João HN Palma
 Assessment of cork production in new Quercus suber plantations under future climate Joana A Paulo Margarida Tomé João HN Palma 22 May 2012 1 Introduction Climate is related to several variables that affect
In this lesson, students will identify a local plant community and make a variety of
 MAKING COMMUNITY MEASUREMENTS: ABIOTIC FACTORS Grades 3 6 I. Introduction In this lesson, students will identify a local plant community and make a variety of measurements, preferably during two different
DESCRIBING DESERT, TAIGA, AND TUNDRA BIOMES
 Lesson B5 1 DESCRIBING DESERT, TAIGA, AND TUNDRA BIOMES Unit B. Science and Technology in Wildlife Management Problem Area 5. Desert, Taiga, and Tundra Biomes National Academic Standard. NS.9-12.1 Science
Central Oregon Climate and how it relates to gardening
 Central Oregon Climate and how it relates to gardening Garden Note #1 Amy Jo Detweiler Horticulture Faculty Rev. July 2009 Behind the beauty of the High Desert landscape lies many factors that create challenges
Influence of pests* - contribution of Horst Delb
 Comparative assessment of the suitability of the tree species Sessile Oak, Common Beech, Scots Pine and Douglas-Fir on Triassic Sandstone locations at different climate scenarios as a contribution to the
through NFIs CO 2 Biodiversity request Need for common reporting at the international level (Kyoto protocol, MCPFE, FAO reports, etc.
 Partnership between ENFIN and the European Commission Need for Harmonized Forest Information 1/2 Industrial use Forest information collected through NFIs CO 2 Biodiversity request Need for common reporting
Summer School Greenhouse Horticulture
 Programme Summer School Greenhouse Horticulture Campus Wageningen UR Course leader: Dr Cecilia Stanghellini Date: 24 August 4 September 2015 Lecturers Chris Blok MSc, rooting media and water quality, Wageningen
GLOBAL CIRCULATION OF WATER
 Global Circulation of Water MODULE - 8A 27 GLOBAL CIRCULATION OF WATER More than three-fourths of the earth s surface is covered by water. Water is an odorless, tasteless, substance than can naturally
Communities, Biomes, and Ecosystems
 Communities, Biomes, and Ecosystems Before You Read Before you read the chapter, respond to these statements. 1. Write an A if you agree with the statement. 2. Write a D if you disagree with the statement.
Model-based Synthesis. Tony O Hagan
 Model-based Synthesis Tony O Hagan Stochastic models Synthesising evidence through a statistical model 2 Evidence Synthesis (Session 3), Helsinki, 28/10/11 Graphical modelling The kinds of models that
MONITORING OF DROUGHT ON THE CHMI WEBSITE
 MONITORING OF DROUGHT ON THE CHMI WEBSITE Richterová D. 1, 2, Kohut M. 3 1 Department of Applied and Land scape Ecology, Faculty of Agronomy, Mendel University in Brno, Zemedelska 1, 613 00 Brno, Czech
Summer School Greenhouse Horticulture
 Programme Summer School Greenhouse Horticulture Wageningen University Campus Course leader: Date: 24 August 4 September 2015 Lecturers Dr Sjaak Bakker, General Manager, Wageningen University, Greenhouse
Irrigation - How Best to Water Your Desert Trees
 Irrigation - How Best to Water Your Desert Trees John Eisenhower, ISA Certified Arborist WE-5213A Integrity Tree Service, Inc. 602-788-0005 www.itreeservice.com How much water do my trees need? How much
Biology 3998 Seminar II. How To Give a TERRIBLE PowerPoint Presentation
 Biology 3998 Seminar II How To Give a TERRIBLE PowerPoint Presentation How to Give a TERRIBLE PowerPoint Presentation [Don t use a summary slide to keep the audience oriented throughout the presentation]
Midwest. Climate on the Move: Changing Summers in the Midwest
 Regional Climate Impacts: Midwest Midwest The Midwest s climate is shaped by the presence of the Great Lakes and the region s location in the middle of the North American continent. This location, far
World Water and Climate Atlas
 International Water Management Institute World Water and Climate Atlas Direct access to water and climate data improves agricultural planning The IWMI World Water and Climate Atlas provides rapid access
Sea level scenarios and extreme weather events
 Extreme weather and nuclear power plants (EXWE) Sea level scenarios and extreme weather events Milla Johansson, Kimmo Kahma, Hilkka Pellikka, Hanna Tietäväinen, Seppo Saku and Kirsti Jylhä Finnish Meteorological
Hands on an infrared gas analyzer (IRGA) to measure photosynthesis
 to measure photosynthesis") University of Toledo - Dept of Envir. Sci., EEES 6660/8960: Biophysical Processes of Ecosystems, Spring 2010 Hands on an infrared gas analyzer (IRGA) to measure photosynthesis Burkhard Wilske for Jiquan
University of Toledo - Dept of Envir. Sci., EEES 6660/8960: Biophysical Processes of Ecosystems, Spring 2010 Hands on an infrared gas analyzer (IRGA) to measure photosynthesis Burkhard Wilske for Jiquan
What is a Terrarium? Supplies Choosing your container Choosing your plants Building Your Terrarium
 What is a Terrarium? A terrarium is a collection of small plants growing in a transparent, sealed container. A terrarium is a closed environment, and can actually be used to illustrate how an ecosystem
Pond Ecosystem Field Study MOLS
 This multi-week lab involves field studies comparing ecosystem-level ecology between 2 freshwater ponds in Marshfield Outdoor Learning Sanctuary. We will be investigating a correlation between weather
Long Term Challenges for Tidal Estuaries
 A view from a former tidal river manager expert with experience from 6 decades living at, with and from the Tidal River Elbe chairman of the European Interreg Project TIDE (Tidal River Development) Land
North American Weather & Climate Extremes: Progress in Monitoring and Research
 North American Weather & Climate Extremes: Progress in Monitoring and Research July 15-21, 2005 Aspen Global Change Institute Aspen, Colorado Shaun McGrath Western Governors Association WGA Drought Report
Climate Change Long Term Trends and their Implications for Emergency Management August 2011
 Climate Change Long Term Trends and their Implications for Emergency Management August 2011 Overview A significant amount of existing research indicates that the world s climate is changing. Emergency
The atmosphere has a number of gases, often in tiny amounts, which trap the heat given out by the Earth.
 The Earth is wrapped in a blanket of air called the atmosphere, which is made up of several layers of gases. The sun is much hotter than the Earth and it gives off rays of heat (radiation) that travel
Climate, water and renewable energy in the Nordic countries
 102 Regional Hydrological Impacts of Climatic Change Hydroclimatic Variability (Proceedings of symposium S6 held during the Seventh IAHS Scientific Assembly at Foz do Iguaçu, Brazil, April 2005). IAHS
Australia s National Carbon Accounting System. Dr Gary Richards Director and Principal Scientist
 Australia s National Carbon Accounting System Dr Gary Richards Director and Principal Scientist Government Commitment The Australian Government has committed to a 10 year, 3 phase, ~$35M program for a
Interactions between rodent borne diseases and climate, and the risks for public and animal health
 Interactions between rodent borne diseases and climate, and the risks for public and animal health Mare Lõhmus Climate centrum / SMS / KMF National Veterinary Institute Uppsala, Sweden The source of many
5 th Grade Science Vocabulary Words
 5 th Grade Science Vocabulary Words abiotic factor A nonliving part of an ecosystem. acceleration Change in velocity with respect to time. action The force one object applies to a second, as in Newton
2. What kind of energy is stored in food? A. chemical energy B. heat energy C. kinetic energy D. light energy
 Assessment Bank Matter and Energy in Living Things SC.8.L.18.4 1. What is energy? A. anything that takes up space B. anything that has mass C. the ability to conduct current D. the ability to do work 2.
Section 5 CLIMATE TABLES
 Section Section CLIMATE SOURCES OF DATA... -1 HISTORICAL CONTEXT... -1 PRECIPITATION... -2 TEMPERATURES... -3 EVAPOTRANSPIRATION... -3 WIND SPEED AND DIRECTION... -4 DEGREE DAYS...-4 CONCLUSIONS AND RECOMMENDATIONS...
Natural Resources and Landscape Survey
 Landscape Info Property Name Address Information Contact Person Relationship to Landscape Email address Phone / Fax Website Address Landscape Type (private/muni/resort, etc.) Former Land Use (if known)
6. Base your answer to the following question on the graph below, which shows the average monthly temperature of two cities A and B.
 1. Which single factor generally has the greatest effect on the climate of an area on the Earth's surface? 1) the distance from the Equator 2) the extent of vegetative cover 3) the degrees of longitude
Climate Change on the Prairie:
 Climate Change on the Prairie: A Basic Guide to Climate Change in the High Plains Region - UPDATE Global Climate Change Why does the climate change? The Earth s climate has changed throughout history and
William Northcott Department of Biosystems and Agricultural Engineering Michigan State University. NRCS Irrigation Training Feb 2-3 and 9-10, 2010
 William Northcott Department of Biosystems and Agricultural Engineering Michigan State University NRCS Irrigation Training Feb 2-3 and 9-10, 2010 Irrigation Scheduling Process of maintaining an optimum
Deciduous Forest. Courtesy of Wayne Herron and Cindy Brady, U.S. Department of Agriculture Forest Service
 Deciduous Forest INTRODUCTION Temperate deciduous forests are found in middle latitudes with temperate climates. Deciduous means that the trees in this forest change with the seasons. In fall, the leaves
Lecture Series in Water, Soil and Atmosphere (315.340) Unit 1: Interaction Soil / Vegetation / Atmosphere
 Unit 1: Interaction Soil / Vegetation / Atmosphere") Dept. Water, Soil & Atmosphere Institute of Hydraulics and Rural Water Management University of Natural Resources and Life Sciences Vienna Lecture Series in Water, Soil and Atmosphere (315.340) Unit 1:
Dept. Water, Soil & Atmosphere Institute of Hydraulics and Rural Water Management University of Natural Resources and Life Sciences Vienna Lecture Series in Water, Soil and Atmosphere (315.340) Unit 1:
JUNIPER TREE NURSERY. Growing The Future Forest Today. A Promise We ve Been Keeping Since 1957.
 JUNIPER TREE NURSERY Growing The Future Forest Today. A Promise We ve Been Keeping Since 1957. JUNIPER TREE NURSERY J.D. Irving, Limited has had an active tree growing program since 1957 as part of our
Titelmasterformat durch Klicken. bearbeiten
 Evaluation of a Fully Coupled Atmospheric Hydrological Modeling System for the Sissili Watershed in the West African Sudanian Savannah Titelmasterformat durch Klicken June, 11, 2014 1 st European Fully
Modelling climate change impacts on forest: an overview. Heleen Graafstal Peter Droogers
 Modelling climate change impacts on forest: an overview Heleen Graafstal Peter Droogers Modelling climate change impact on forests: an overview Heleen Graafstal Peter Droogers Generaal Foulkesweg 28 6703
Development of an Object-oriented Framework for Environmental Information Management Systems in Horticulture
 Development of an Object-oriented Framework for Environmental Information Management Systems in Horticulture Hagen Bauersachs, Heike Mempel and Joachim Meyer Technische Universität München Department of
Overview. Suggested Lesson Please see the Greenlinks Module description.
 Overview Plants interact with their environment in many ways that we cannot see. Children often enjoy learning about these hidden secrets of plant life. In this lesson, children will learn about role of
NOTE TO TEACHER: It is appropriate to introduce the mitochondria (where energy is made) as a major structure common to all cells.
 as a major structure common to all cells.") 5.2.1 Recall the cell as the smallest unit of life and identify its major structures (including cell membrane, cytoplasm, nucleus, and vacuole). Taxonomy level: 1.1 and 1.2-A Remember Factual Knowledge
5.2.1 Recall the cell as the smallest unit of life and identify its major structures (including cell membrane, cytoplasm, nucleus, and vacuole). Taxonomy level: 1.1 and 1.2-A Remember Factual Knowledge
Lesson Overview. Biodiversity. Lesson Overview. 6.3 Biodiversity
 Lesson Overview 6.3 6.3 Objectives Define biodiversity and explain its value. Identify current threats to biodiversity. Describe how biodiversity can be preserved. THINK ABOUT IT From multicolored coral
STUDY GUIDE ECOLOGY. CHAPTER 21: Populations 1. An overview of ecology. Ecology is the study of interactions between organisms and their environment.
 STUDY GUIDE ECOLOGY CHAPTER 21: Populations 1. An overview of ecology. Ecology is the study of interactions between organisms and their environment. 2. A Hierarchy of interactions: cells tissues organs
Knowledge transfer of climate-ecosystem-interactions between science and society Introducing the Climate Whirl concept
 Boreal Environment Research 19 (suppl. B): 406 411 2014 ISSN 1239-6095 (print) ISSN 1797-2469 (online) helsinki 30 September 2014 Knowledge transfer of climate-ecosystem-interactions between science and
Section 5.1 Food chains and food webs
 Section 5.1 Food chains and food webs The ultimate source of energy in an ecosystem comes from sunlight This energy is converted to an organic form using photosynthesis which is then passed between organisms
Welcome to NASA Applied Remote Sensing Training (ARSET) Webinar Series
 Webinar Series") Welcome to NASA Applied Remote Sensing Training (ARSET) Webinar Series Introduction to Remote Sensing Data for Water Resources Management Course Dates: October 17, 24, 31 November 7, 14 Time: 8-9 a.m.
Welcome to NASA Applied Remote Sensing Training (ARSET) Webinar Series Introduction to Remote Sensing Data for Water Resources Management Course Dates: October 17, 24, 31 November 7, 14 Time: 8-9 a.m.
Climate Adaptation and Preparedness
 Climate Adaptation and Preparedness Aaron Durnbaugh, Adaptation Coordinator & Deputy Commissioner, City of Chicago Department of Environment Rahm Emanuel, Mayor Climate Impact: Lake Michigan Decreased
4. Which choice below lists the biomes in order from lowest precipitation amounts to highest precipitation amounts?
 Ecosystems and Biomes 1. All of the living organisms in a forest plus their environment is an example of A. a biome. B. a community. C. a population. D. an ecosystem. 2. Which of the following best describes
How does snow melt? Principles of snow melt. Energy balance. GEO4430 snow hydrology 21.03.2006. Energy flux onto a unit surface:
 Principles of snow melt How does snow melt? We need energy to melt snow/ ice. GEO443 snow hydrology 21.3.26 E = m L h we s K = ρ h = w w we f E ρ L L f f Thomas V. Schuler t.v.schuler@geo.uio.no E energy
Regional Parks Botanic Garden Plant Adaptations to Habitat Tour: Selected Plant Adaptations by Garden Section
 INTRO Regional Parks Botanic Garden Plant Adaptations to Habitat Tour: Selected Plant Adaptations by Garden Section Tools (optional, but nice to use): -Discovery Scope -Spray bottle of water--from the
A cool CAP post-2013: What measures could help adapt Cyprus farming and biodiversity to the consequences of climate change?
 A cool CAP post-2013: What measures could help adapt Cyprus farming and biodiversity to the consequences of climate change? 26 September 2012: IFOAM EU Conference Future farming in times of climate change
Current capabilities in the analysis of climate risks and adaptation strategies in critical areas
 Current capabilities in the analysis of climate risks and adaptation strategies in critical areas M. Arif Goheer Global Change Impact Studies Centre (GCISC) Islamabad- 44000, Pakistan Symposium on Climate
Climate Change: A Local Focus on a Global Issue Newfoundland and Labrador Curriculum Links 2010-2011
 Climate Change: A Local Focus on a Global Issue Newfoundland and Labrador Curriculum Links 2010-2011 HEALTH Kindergarten: Grade 1: Grade 2: Know that litter can spoil the environment. Grade 3: Grade 4:
Chapter 1 FAO cropwater productivity model to simulate yield response to water
 Chapter 1 FAO cropwater productivity model to simulate yield response to water AquaCrop Version 3.1plus Reference Manual January 2011 Developed by Dirk RAES, Pasquale STEDUTO, Theodore C. HSIAO, and Elias
Impact of water harvesting dam on the Wadi s morphology using digital elevation model Study case: Wadi Al-kanger, Sudan
 Impact of water harvesting dam on the Wadi s morphology using digital elevation model Study case: Wadi Al-kanger, Sudan H. S. M. Hilmi 1, M.Y. Mohamed 2, E. S. Ganawa 3 1 Faculty of agriculture, Alzaiem
Use this diagram of a food web to answer questions 1 through 5.
 North arolina Testing Program EO iology Sample Items Goal 4 Use this diagram of a food web to answer questions 1 through 5. coyotes 3. If these organisms were arranged in a food pyramid, which organism
Forestry Department Food and Agriculture Organization of the United Nations GLOBAL FOREST RESOURCES ASSESSMENT 2005 FINLAND COUNTRY REPORT
 Forestry Department Food and Agriculture Organization of the United Nations GLOBAL FOREST RESOURCES ASSESSMENT 2005 COUNTRY REPORT Global Forest Resources Assessment 2005 Country Report 054 Rome, 2005
PLANET EARTH: Seasonal Forests
 PLANET EARTH: Seasonal Forests Teacher s Guide Grade Level: 6-8 Running Time: 42 minutes Program Description Investigate temperate forests and find some of the most elusive creatures and welladapted plant
Environmental impacts of harvesting biomass from the Nordic forests. Nicholas Clarke Norwegian Forest and Landscape Institute
 1 Environmental impacts of harvesting biomass from the Nordic forests Nicholas Clarke Norwegian Forest and Landscape Institute Background 2 Increased use of forest biomass for energy might lead to conflict