U.S. Census Bureau. Vital Statistics About Your Community. Armando Mendoza Partnership and Data Services U.S. Census Bureau Los Angeles Region
|
|
|
- Anthony York
- 7 years ago
- Views:
Transcription
1 U.S. Census Bureau Vital Statistics About Your Community Armando Mendoza Partnership and Data Services U.S. Census Bureau Los Angeles Region September 23, 2014
2 Agenda Importance of Census Bureau Data Censuses, Surveys and Estimates Decennial Census and the American Community Survey (ACS) Statistics Selected ACS Characteristics: Census Tract, Census Designated Place (CDP), County, and Zip Code Tabulation Area (ZCTA) Accessing Census Bureau Data


3 Decennial Census Constitutional Mandate Article 1, Section 2 23 Censuses since 1790 Congressional Reapportionment Redistricting Data is used to distribute federal funds
4 70.00% California Resident Population Percent Change 60.00% 50.00% 40.00% 30.00% 20.00% 10.00% 0.00% % Change
5 California Congressional Apportionment (Existing) California (53)

6 Congressional Seats Apportionment Massachusett s Illinois Ohio Texas California Florida Louisiana New York Pennsylvania

7

8
9 Overview Importance of Census Bureau Data Censuses, Surveys and Estimates Decennial Census and the American Community Survey (ACS) Statistics Selected ACS Characteristics: Census Tract, Census Designated Place (CDP), County, and Zip Code Tabulation Area (ZCTA) Accessing Census Bureau Data
10 Censuses, Surveys and Estimates Current Population Survey Major component of national unemployment data National Health Interview Survey Sponsored by National Health Statistics National Crime and Victimization Survey For the Bureau of Justice Statistics Collects more detailed data than police reports Consumer Expenditure Survey Data collected contributes 80% of CPI

11 Population Estimates Population totals available for the United States, states, counties, places and Puerto Rico Components of change available for nation, states and counties Based on births, deaths and migration
12 Population Estimates 3,500,000 3,000,000 2,500,000 2,000,000 1,500,000 1,000, ,000 0 Census Riverside County 4.5% Change 2,189,641 2,202,361 2,237,330 2,268,783 2,292,507 Orange County 3.3% Change 3,010,232 3,018,026 3,053,932 3,085,355 3,114,363 San Diego County 3.6% Change 3,095,313 3,104,182 3,138,550 3,176,138 3,211,252 San Bernardino County 2.5% Change 2,035,210 2,041,647 2,063,143 2,077,453 2,088,371 Source: Census 2010 and Population Estimates 2013

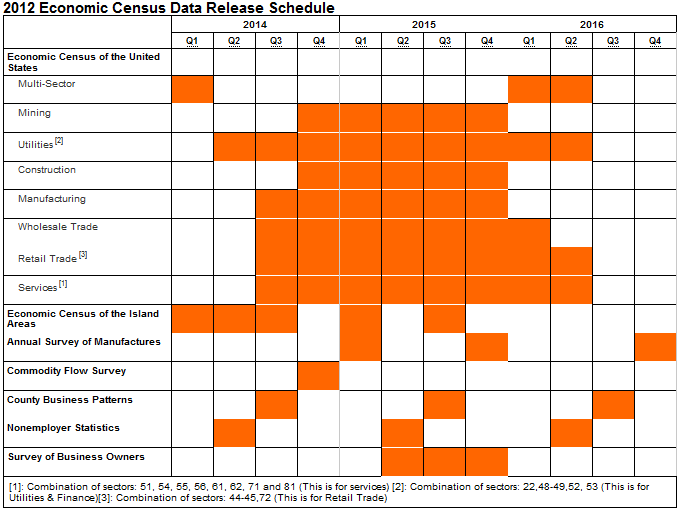
13 Economic Census Conducted every five years (years ending in 2 and 7) Provides information economic information down to the zip code level

14 Link: Economic Census Webpage
15
16 Overview Importance of Census Bureau Data Census, Surveys and Estimates Decennial Census and the American Community Survey (ACS) Statistics Selected ACS Characteristics: Census Tract, Census Designated Place (CDP), County, and Zip Code Tabulation Area (ZCTA) Accessing Census Bureau Data

17 ACS History Decennial Census: Short Form & Long Form American Community Survey Replaces Decennial Long Form Decennial Census: Short Form Only
18 Differences Between Decennial Census and ACS Census Every 10 Years 100 Percent Data Official Count Point In Time (April 1 st ) ACS Yearly Sample Data (3.5 million year/291k monthly) Estimates (trends/comparisons) Period of Time (1yr, 3yr, 5yr)

19 ACS Period Estimates 1-Year Estimates 3-Year Estimates 5-Year Estimates Geographies of 65,000 or more Geographies of 20,000 or more All geographies

20 American Community Survey Demographic Characteristics Age Race Sex Hispanic Origin 20

21 American Community Survey Social Characteristics Education Marital Status Fertility Grandparent/ Caregivers Veterans Disability Status Place of Birth Citizenship Year of Entry Language Spoken at Home Ancestry / Tribal Affiliation 21 21

22 American Community Survey Economic Characteristics Income o Social Security Income o Retirement Income Employment Status Occupation Industry Commuting to Work Place of Work Health Insurance o Medicare o Medicaid 22 22

23 American Community Survey Housing Characteristics Tenure Occupancy & Structure Housing Value Taxes & Insurance Utilities Mortgage/Monthly Rent 23 23
24 Margin of Error (MOE) Margin of Error Definition: A measure of the precision of an estimate at a given level of confidence (90%, 95%, 99%) -- MOEs at the 90% confidence level for all published ACS estimates Confidence Interval Definition: A range that is expected to contain the population value of the characteristic with a known probability
25 Overview Importance of Census Bureau Data Census, Surveys and Estimates Decennial Census and the American Community Survey (ACS) Statistics Selected ACS Characteristics: Census Tract, Census Designated Place (CDP), County, and Zip Code Tabulation Area (ZCTA) Accessing Census Bureau Data
26
27
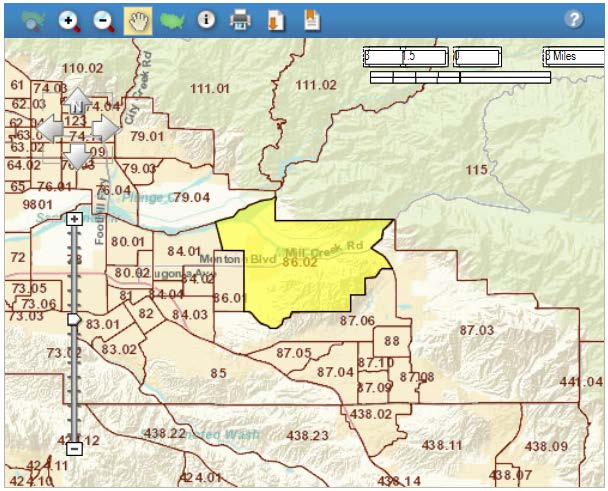
28 Households 221,676 1,291 2,994 12,750 San Bernardino County Census Tract Mentone CDP ZCTA Source: U.S. Census Bureau American Community Survey
29 Average Family Size Persons San Bernardino County Census Tract Mentone CDP ZCTA Source: U.S. Census Bureau American Community Survey
30 Married Couples 51.2% 51.2% 51.3% 48.1% San Bernardino County Census Tract Mentone CDP ZCTA Source: U.S. Census Bureau American Community Survey
31 27.9% Households with Children <18 yrs. Old 19.4% 20.5% 22.1% San Bernardino County Census Tract Mentone CDP ZCTA Source: U.S. Census Bureau American Community Survey
32 Place of Birth US Native Population Foreign Born 86.1% 83.6% 84.3% 74.5% 25.5% 13.9% 16.4% 15.7% San Bernardino County Census Tract Mentone CDP ZCTA Source: U.S. Census Bureau American Community Survey
33 60.8% Citizenship Naturalized Citizens Not a US Citizen 74.6% 63.7% 55.1% 39.2% 36.3% 44.9% 25.4% San Bernardino County Census Tract Mentone CDP ZCTA Source: U.S. Census Bureau American Community Survey
34 Language Spoken at Home Speak other than English at Home 60.3% 19.7% 23.7% 30.3% San Bernardino County Census Tract Mentone CDP ZCTA Source: U.S. Census Bureau American Community Survey
35 Language Spoken At Home Spanish Another Language 86% 83% 79% 56% 44% 14% 17% 21% San Bernardino County Census Tract Mentone CDP ZCTA Source: U.S. Census Bureau American Community Survey
36 Less Than High School Diploma 28.8% 22.2% 15.2% 13.7% San Bernardino County Census Tract Mentone CDP ZCTA Source: U.S. Census Bureau American Community Survey
37 25.7% High School Diploma or Equivalent 22.2% 28.0% 24.2% San Bernardino County Census Tract Mentone CDP ZCTA Source: U.S. Census Bureau American Community Survey
38 Some College - No Degree 27.7% 25.7% 26.2% 22.2% San Bernardino County Census Tract Mentone CDP ZCTA Source: U.S. Census Bureau American Community Survey
39 Associate's Degree 12.1% 7.3% 8.5% 9.0% San Bernardino County Census Tract Mentone CDP ZCTA Source: U.S. Census Bureau American Community Survey
40 Bachelor's Degree 16.5% 10.3% 11.9% 9.4% San Bernardino County Census Tract Mentone CDP ZCTA Source: U.S. Census Bureau American Community Survey
41 Graduate or Professional Degree 9.5% 10.3% 7.5% 5.6% San Bernardino County Census Tract Mentone CDP ZCTA Source: U.S. Census Bureau American Community Survey
42 High School or higher 71.1% 77.8% 84.7% 86.2% San Bernardino County Census Tract Mentone CDP ZCTA Source: U.S. Census Bureau American Community Survey
43 Commuting to Work (Mean Travel Time - minutes) San Bernardino County Census Tract Mentone CDP ZCTA Source: U.S. Census Bureau American Community Survey
44 Median Household Income $50,371 $49,984 $56,333 $63,300 San Bernardino County Census Tract Mentone CDP ZCTA Source: U.S. Census Bureau American Community Survey
45 Families below Proverty Level 17.5% 10.7% 6.8% 4.5% San Bernardino County Census Tract Mentone CDP ZCTA Source: U.S. Census Bureau American Community Survey
46 Female Householder (no husband) below Poverty Level 33.9% 23.1% 13.0% 0.0% San Bernardino County Census Tract Mentone CDP ZCTA Source: U.S. Census Bureau American Community Survey
47 76% Insurance Coverage With Health Insurance No Health Insurance 84% 82% 87% 24% 16% 18% 14% San Bernardino County Census Tract Mentone CDP ZCTA Source: U.S. Census Bureau American Community Survey
48 Tenure Owner Occupied Renters 56.2% 66.8% 56.8% 64.5% 43.8% 33.2% 43.2% 35.5% San Bernardino County Census Tract Mentone CDP ZCTA Source: U.S. Census Bureau American Community Survey
49 Overview Importance of Census Bureau Data Censuses, Surveys and Estimates Decennial Census and the American Community Survey (ACS) Statistics Selected ACS Characteristics: Census Tract, Census Designated Place (CDP), County, and Zip Code Tabulation Area (ZCTA) Accessing Census Bureau Data

50 Mobile Apps census.gov/mobile


, Producer Price Index (PPI)")
51 America s Economy Provides the latest data for the principal federal economic indicators, including BEA and BLS; 20 indicators Allows businesses to have this information at their finger tips when making important decisions everyday. Added BLS s Consumer Price Index (CPI), Producer Price Index (PPI) and Non-farm Payroll; Rental Vacancy Rates 51


52 dwellr Uses your preferences to create a list of top 25 places and gives you information about each one. Uses the GPS feature in your phone to provide you with statistics for your current location. Uses statistics that are powered by the American Community Survey, 52

53 POP QUIZ This new mobile app from the Census Bureau challenges a user's knowledge of the 50 states and the District of Columbia. Census PoP Quiz is available for download to Android and Apple products. 53
54 Census Data Products Population Finder Quick Facts Easy Stats Census Explorer Community Facts in AFF Narrative Profiles Address Search & Census Tract Data

55 Contact Information: Armando Mendoza Los Angeles Regional Office Partnership and Data Services Telephone:
Demographic and Business
 Introduction to Demographic and Business Data Products and Sources Fundamentals of Census Geographies Census Geographic Entities Nation Regions Divisions States Counties Census Tracts Block Groups Blocks
The American Community Survey. A Critical Change in the Re-engineering of Census 2010
 The American Community Survey A Critical Change in the Re-engineering of Census 2010 First, a quiz!! What is the difference between short form and long form data on the Decennial Census questionnaire?
Demography. Focus on the three contributors to population change: Fertility, mortality, and migration
 1 Formal Demography Demography Focus on the three contributors to population change: Fertility, mortality, and migration Social Demography Focus on relationship between social, economic, and demographic
Introduction to Veteran Statistics: Market Research Tools for Veteran Small Businesses
 Introduction to Veteran Statistics: Market Research Tools for Veteran Small Businesses Kelly Ann Holder Social, Economic, and Housing Statistics Division December 2015 1 Finding the Right Data The Census
Population, by Race and Ethnicity: 2000 and 2011
 Table 1 Population, by Race and Ethnicity: 2000 and 2011 Universe: 2000 and 2011 resident population 2011 population 2000 population Percent, 2011 Percent, 2000 Hispanic 51,927,158 35,204,480 16.7 12.5
SELECTED POPULATION PROFILE IN THE UNITED STATES. 2013 American Community Survey 1-Year Estimates
 S0201 SELECTED POPULATION PROFILE IN THE UNITED STATES 2013 American Community Survey 1-Year Estimates Supporting documentation on code lists, subject definitions, data accuracy, and statistical testing
The Changing Population of Texas and San Antonio. Masters Leadership Program October 10, 2012 San Antonio, TX
 The Changing Population of Texas and San Antonio Masters Leadership Program October 10, 2012 San Antonio, TX Growing States, 2000-2010 2000 Population* 2010 Population* Numerical Change 2000-2010 Percent
Population, by Race and Ethnicity: 2000 and 2010
 Table 1 Population, by Race and Ethnicity: 2000 and 2010 Universe: 2000 and 2010 resident population 2010 population 2000 population Percent, 2010 Percent, 2000 Hispanic 50,729,570 35,204,480 16.4 12.5
SELECTED SOCIAL CHARACTERISTICS IN THE UNITED STATES. 2012 American Community Survey 1-Year Estimates
 DP02 SELECTED SOCIAL CHARACTERISTICS IN THE UNITED STATES 2012 American Community Survey 1-Year Estimates Supporting documentation on code lists, subject definitions, data accuracy, and statistical testing
Changes in Self-Employment: 2010 to 2011
 Changes in Self-Employment: 2010 to 2011 American Community Survey Briefs By China Layne Issued January 2013 ACSBR/11-21 INTRODUCTION From December 2007 to June 2009, the United States experienced an economic
Orange County PROFILES
 Orange County PROFILES VOLUME 10, NUMBER 1 MARCH 2005 CENTER FOR DEMOGRAPHIC RESEARCH ORANGE COUNTY MOVERS: 1995-2000 INTRODUCTION Three events change population size and composition in a particular area:
Selected Socio-Economic Data. Baker County, Florida
 Selected Socio-Economic Data African American and White, Not Hispanic www.fairvote2020.org www.fairdata2000.com 5-Feb-12 C03002. HISPANIC OR LATINO ORIGIN BY RACE - Universe: TOTAL POPULATION Population
Ali Modarres California State University, Los Angeles
 Ali Modarres California State University, Los Angeles Data Sources: U.S. Citizenship and Immigration Services and the California Department of Finance, Demographic Research Unit. Data Sources: U.S. Citizenship
DIY Exercises. Linda Clark Data Dissemination Specialist U.S. Census Bureau Alaska, Idaho, Oregon, Washington linda.clark@census.
 Grants Workshop October 21, 2015 Mount Vernon, Washington DIY Exercises Linda Clark Data Dissemination Specialist U.S. Census Bureau Alaska, Idaho, Oregon, Washington linda.clark@census.gov 206-446-8794
HEALTH INSURANCE COVERAGE STATUS. 2009-2013 American Community Survey 5-Year Estimates
 S2701 HEALTH INSURANCE COVERAGE STATUS 2009-2013 American Community Survey 5-Year Estimates Supporting documentation on code lists, subject definitions, data accuracy, and statistical testing can be found
Educational Attainment
 Educational Attainment Five Key Data Releases From the U.S. Census Bureau Media Webinar February 23, 2012 Webinar access information Toll free number: 888 790 3288 Passcode: CENSUS URL: https://www.mymeetings.com/nc/join/
The Foreign-Born Population in the United States: 2010
 The Foreign-Born Population in the United States: 2010 American Community Survey Reports Issued May 2012 ACS-19 INTRODUCTION This report presents a portrait of the foreign-born population in the United
The Non-English Speaking Population in Hawaii
 Data Report 2011 The Non-English Speaking Population in Hawaii Introduction The report examines social, economic and demographic characteristics of people in Hawaii who speak language other than English
American FactFinder (AFF) and The Equal Employment Opportunity Tabulation 2006-2010 Tutorial
 and The Equal Employment Opportunity Tabulation 2006-2010 Tutorial") American FactFinder (AFF) and The Equal Employment Opportunity Tabulation 2006-2010 Tutorial Prepared by: Industry and Occupation Statistics Branch Social, Economic, and Housing Statistics Division U.S.
American FactFinder (AFF) and The Equal Employment Opportunity Tabulation 2006-2010 Tutorial Prepared by: Industry and Occupation Statistics Branch Social, Economic, and Housing Statistics Division U.S.
EDUCATIONAL ATTAINMENT. 2011-2013 American Community Survey 3-Year Estimates
 S1501 EDUCATIONAL ATTAINMENT 2011-2013 American Community Survey 3-Year Estimates Supporting documentation on code lists, subject definitions, data accuracy, and statistical testing can be found on the
Demographic Analysis of the Salt River Pima-Maricopa Indian Community Using 2010 Census and 2010 American Community Survey Estimates
 Demographic Analysis of the Salt River Pima-Maricopa Indian Community Using 2010 Census and 2010 American Community Survey Estimates Completed for: Grants & Contract Office The Salt River Pima-Maricopa
Educational Attainment in the United States: 2003
 Educational Attainment in the United States: 2003 Population Characteristics Issued June 2004 P20-550 The population in the United States is becoming more educated, but significant differences in educational
Making Cents of All Those Numbers: Using Census Data Effectively
 Making Cents of All Those Numbers: Using Census Data Effectively Gary Krob, State Data Center Program Iowa Library Services/State Library www.iowadatacenter.org Goals for Today To have a general discussion
New Mexico. Comparison Profile prepared by the New Mexico Economic Development Department State Data Center. Page 1 of 5
 DEMOGRAPHICS Population estimates, July 1, 2014 2,085,572 Population, percent change - April 1, 2010 to July 1, 2014 1.4% Population estimates, July 1, 2013 2,085,287 Population, percent change - April
Comparison Profile prepared by the New Mexico Economic Development Department State Data Center. Page 1 of 5
 Comparing New Mexico to Colorado DEMOGRAPHICS Colorado New Mexico Population estimates, July 1, 2014 5,355,866 2,085,572 Population, percent change - April 1, 2010 to July 1, 2014 1.4% 1.4% Population
Lake County. Government Finance Study. Supplemental Material by Geography. Prepared by the Indiana Business Research Center
 County Government Finance Study Supplemental Material by Geography Prepared by the Indiana Business Research www.ibrc.indiana.edu for Sustainable Regional Vitality www.iun.edu/~csrv/index.shtml west Indiana
A Profile of Older Americans: 2011
 A Profile of Older Americans: 2011 Administration on Aging U.S. Department of Health and Human Services Table of Contents Highlights. 1 The Older Population. 2 Future Growth 3 Figure 1: Number of Persons
Using the American Community Survey Data
 Using the American Community Survey Data The ACS website is accessible from www.census.gov/acs. In the middle of the screen choose In-depth Data Go directly to the ACS Datasets Tab The ACS Datasets Tab
Time for a Shared Recovery
 Time for a Shared Recovery Using the Census Data to Show the Harmful and Needless Needless Persistence of Poverty August 19, 2008 1 PART III 21 Deborah Weinstein Executive Director, Coalition on Human
Using Census Data in your GIS. Craig Best Supervisory Geographer Kansas City Regional Office
 Using Census Data in your GIS Craig Best Supervisory Geographer Kansas City Regional Office 1 Objectives Understand Census Geographic Identifiers Understand how to obtain geographic files Understand how
KANKAKEE COUNTY ANALYSIS OF COMMUNITY HEALTH NEEDS
 ANALYSIS OF COMMUNITY HEALTH NEEDS March 2007 Prepared for Kankakee County Health Department Provena St. Mary s Hospital Riverside HealthCare Prepared by University of Illinois College of Medicine at Rockford
In 2013, 75.9 million workers age 16 and older in the. Characteristics of Minimum Wage Workers, 2013. Highlights CONTENTS
 U.S. BUREAU OF LABOR STATISTICS M A R C H 2 0 1 4 R E P O R T 1 0 4 8 Characteristics of Minimum Wage Workers, 2013 below the figure of 13.4 percent in 1979, when data were first collected on a regular
Educational Attainment of the Population 25 Years and Over, by Selected Characteristics: 2011
 of Eastern Oklahoma The U.S. Census Bureau created CICs to help make census information available to the public as a tool for better planning and action. Educational Attainment of the Population 25 Years
Racial and Ethnic Diversity in Anaheim
 Racial and Ethnic Diversity in Anaheim Anaheim s racial and ethnic demographics have changed dramatically in the last thirty years. Asian/Pacific Islander 4.1% Other 1.2% Hispanic/ Latino 1.1% Black/African
Broome County Community Health Assessment 2013-2017 1 APPENDIX A
 Community Health Assessment 2013-2017 1 APPENDIX A 2 Community Health Assessment 2013-2017 Table of Contents: Appendix A A Community Report Card will be developed based on identified strengths and opportunities
Iowa School District Profiles. Central City
 Iowa School District Profiles Overview This profile describes enrollment trends, student performance, income levels, population, and other characteristics of the Central City public school district. The
Moving to America Moving to Homeownership: 1994-2002
 Moving to America Moving to Homeownership: 1994-2002 Issued September 2003 H121/03-1 Introduction For many people, whether native or foreign born, homeownership is their American dream. This report examines
Health Insurance Coverage: Estimates from the National Health Interview Survey, 2004
 Health Insurance Coverage: Estimates from the National Health Interview Survey, 2004 by Robin A. Cohen, Ph.D., and Michael E. Martinez, M.P.H., Division of Health Interview Statistics, National Center
Educational Attainment in the United States: 2015
 Educational Attainment in the United States: 215 Population Characteristics Current Population Reports By Camille L. Ryan and Kurt Bauman March 216 P2-578 This report provides a portrait of educational
Demographic Characteristics and Trends in Texas and North Texas: Population and Infrastructure
 Demographic Characteristics and Trends in Texas and North Texas: Population and Infrastructure Plano Chamber of Commerce April 1, 2015 Austin, Texas Total Population and Components of Population Change
POVERTY IN THE SAN FRANCISCO BAY AREA
 Research Brief POVERTY IN THE SAN FRANCISCO BAY AREA March 2015 SILICON VALLEY INSTITUTE for REGIONAL STUDIES This publication is one in a series of research briefs published by the Silicon Valley Institute
Data in the UDS Mapper. www.udsmapper.org
 Data in the UDS Mapper Data 2 Data in the UDS Mapper Patient data in the UDS Mapper are derived from the Uniform Data System (UDS) count of patients by ZIP Code for all health centers UDS data are submitted
American Community Survey Design and Methodology (January 2014) Chapter 14: Data Dissemination
 Chapter 14: Data Dissemination") American Community Survey Design and Methodology (January 2014) Chapter 14: Data Dissemination Version 2.0 January 30, 2014 ACS Design and Methodology (January 2014) Chapter 14: Data Dissemination Page
American Community Survey Design and Methodology (January 2014) Chapter 14: Data Dissemination Version 2.0 January 30, 2014 ACS Design and Methodology (January 2014) Chapter 14: Data Dissemination Page
A Profile of Older Americans: 2012
 A Profile of Older Americans: 2012 Administration on Aging Administration for Community Living U.S. Department of Health and Human Services Table of Contents Highlights. 1 The Older Population. 2 Future
New Census Bureau Migration Data Detail Specific County-to-County Moves For Every County in Hawaii. Focus on Hawaii County
 FOR IMMEDIATE RELEASE: THURSDAY, FEB. 6, 2014 New Census Bureau Migration Data Detail Specific County-to-County Moves For Every County in Hawaii Focus on Hawaii County The U.S. Census Bureau reported today
Census Data on Uninsured Women and Children September 2009
 March of Dimes Foundation Office of Government Affairs 1146 19 th Street, NW, 6 th Floor Washington, DC 20036 Telephone (202) 659-1800 Fax (202) 296-2964 marchofdimes.com nacersano.org Census Data on Uninsured
Measuring America: An Overview of Women- Owned Business and Related Statistics. U.S. Census Bureau December 2014
 Measuring America: An Overview of Women- Owned Business and Related Statistics U.S. Census Bureau December 2014 1 Overview Highlights Search & Navigation Data Examples Data Tools Summary How I might use
San Francisco s Widening Income Inequality
 San Francisco s Widening Income Inequality May 2014 San Francisco Human Services Agency Economic Trends May 2014 San Francisco Human Services Agency San Francisco Human Services Agency 3 100% 90% 80% 70%
Variable Listing by Data Source
 Variable Listing by Data Source Source Name: US Census Femeld90 H006001_90 H006002_90 H006003_90 H007002_90 H007003_90 H020005_90 H020011_90 HHINCDISP_90 HHINCDISP_ELD_90 HOUSEDEN_90 Land_Area_00 LCOMMUTE_90
I. HEALTH ASSESSMENT B. SOCIOECONOMIC CHARACTERISTICS
 I. B. SOCIOECONOMIC CHARACTERISTICS 1. HOW FINANCIALLY SECURE ARE RESIDENTS OF DELAWARE? Delaware residents median household incomes are lower than comparison communities but higher than national norms.
The Changing Population of Texas. BP Business Leaders November 8, 2012 Austin, TX
 The Changing Population of Texas BP Business Leaders November 8, 2012 Austin, TX Growing States, 2000-2010 2000 Population* 2010 Population* Numerical Change 2000-2010 Percent Change 2000-2010 United States
Ohio County Profiles Prepared by the Office of Research
 Ohio County Profiles Prepared by the Office of Research Established: Act - May 1, 1803 2014 Population: 533,116 Land Area: 461.7 square miles County Seat: Dayton City Named for: General Richard Montgomery,
Inuvik - Statistical Profile
 Inuvik - Statistical Profile POPULATION Number of Births 2002 48 635 Population (2015) 2003 79 701 Total 3,265 44,088 2004 65 698 2005 67 712 Males 1,601 22,499 2006 63 687 Females 1,664 21,589 2007 68
A Profile of Older Americans: 2013. Administration on Aging Administration for Community Living U.S. Department of Health and Human Services
 A Profile of Older Americans: 2013 Administration on Aging Administration for Community Living U.S. Department of Health and Human Services Table of Contents Highlights. 1 The Older Population. 2 Future
2007-2011 County-to-County Migration Flows
 2007-2011 County-to-County Migration Flows Megan Benetsky Journey to Work and Migration Statistics Branch Social, Economic, and Housing Statistics Division Working Paper No. 2014-036 U.S. Census Bureau
Community Information Book Update October 2005. Social and Demographic Characteristics
 Community Information Book Update October 2005 Public Health Department Social and Demographic Characteristics The latest figures from Census 2000 show that 36,334 people lived in San Antonio, an increase
Demographic Profile For Seminole County 1
 Demographic Profile For County 1 AGRICULTURE... Farm Gate Value ($000), 2013 127,032 13,591,936 85,484 Farm Gate Value per Farm, Dollars, 2013 852,567 321,649 324,352 Farm Gate Value per Farm Acre, Dollars,
Health Insurance Coverage: Estimates from the National Health Interview Survey, 2005
 Health Insurance Coverage: Estimates from the National Health Interview Survey, 2005 by Robin A. Cohen, Ph.D., and Michael E. Martinez, M.P.H., Division of Health Interview Statistics, National Center
Ohio County Profiles Prepared by the Office of Research
 Ohio County Profiles Prepared by the Office of Research Established: Act - April 1, 182 214 Population: 28,462 Land Area: 41.1 square miles County Seat: Van Wert City Named for: Isaac Van Wert, Revolutionary
Population and Education in Texas: Implications of Population Change and Immigration for The United States and Texas in the 21 st Century
 Population and Education in Texas: Implications of Population Change and Immigration for The United States and Texas in the 21 st Century Taken from: Steve Murdock (2006) Institute for Demographic and
Educational Attainment. Five Key Data Releases From the U.S. Census Bureau
 Educational Attainment Five Key Data Releases From the U.S. Census Bureau 100% 90% 80% 70% Educational Attainment of the Population 25 Years and Older: 2011 30 percent 1% 2% 8% 19% Doctorate degree Professional
DEKALB COUNTY COMMUNITY ANALYSIS: 2012
 DEKALB COUNTY COMMUNITY ANALYSIS: 2012 September 2012 DeKalb County Health Department 2550 North Annie Glidden Road DeKalb, IL 60115 TABLE OF CONTENTS Page Chapter 1: Chapter 2: Chapter 3: Chapter 4: Chapter
Diversity in South Texas
 Diversity in South Texas James E. Bonson, MPAS, PA-C Assistant Professor/Clinical Coordinator School of Health Professions Department of Physician Assistant Studies UT Health Science Center - San Antonio
U.S. Population Projections: 2012 to 2060
 U.S. Population Projections: 2012 to 2060 Jennifer M. Ortman Population Division Presentation for the FFC/GW Brown Bag Seminar Series on Forecasting Washington, DC February 7, 2013 2012 National Projections
Hispanic Business Report California 2011
 IOTD Hispanic Research Center Hispanic Business Report California 2011 Documenting the Economic Impact Of Hispanics in California and in Los Angeles County Prepared by: IOTD Hispanic Research Center &
Ohio African Americans
 Ohio African Americans Ohio s African American community is comprised of nearly 1.6 million people, accounting for 13.7 percent of the state s total population. According to the 2013 American Community
Application for Free Home Repairs
 Application for Free Home Repairs Name of Homeowner: Date of Birth: Gender Male Female Is this a female headed household? Is this a grandparent headed household? Street Address: City: County: Zip Marital
Men in Nursing Occupations
 Men in Nursing Occupations American Community Survey Highlight Report Issued February 2013 Introduction Healthcare is one of the fastest growing industries. 1 The aging of our population fuels an increasing
IMMIGRATION FACTS. Health Insurance Coverage of the Foreign Born in the United States: Numbers and Trends
 The Migration Policy Institute is an independent, non-partisan, and non-profit think tank dedicated to the study of the movement of people worldwide. The institute provides analysis, development, and evaluation
Demographic Profile of ASHA Members Providing Bilingual Services March 2016
 Demographic Profile of ASHA Members Providing Bilingual Services March 2016 Introduction State data on the number of bilingual speech-language pathologists (SLPs) and audiologists are frequently requested
Texas and San Antonio. imaginesanantonio Livable San Antonio Conference November 9, 2012 San Antonio, TX
 The Changing Population of Texas and San Antonio imaginesanantonio Livable San Antonio Conference November 9, 2012 San Antonio, TX Growing States, 2000 2010 Numerical Percent 2000 2010 Change Change Population*
Who Could Afford to Buy a Home in 2009? Affordability of Buying a Home in the United States
 Who Could Afford to Buy a Home in 200? Affordability of Buying a Home in the United States Current Housing Reports Ellen Wilson and Robert R. Callis Issued May 203 H2/3-02 IntroductIon This is the seventh
Ohio Hispanic Americans
 Ohio Hispanic Americans Ohio s Hispanic community is comprised of more than 383,000 people, accounting for 3.3 percent of the state s total population. According to the 2013 American Community Survey by
King County s Changing Demographics
 King County s Changing Demographics A View of Our Increasing Diversity Chandler Felt, Demographer King County Office of Performance, Strategy and Budget King County Council, June 5, 2013 A note on sources
Working Beyond Retirement-Age
 Working Beyond Retirement-Age Kelly A. Holder and Sandra L. Clark U.S. Census Bureau Housing and Household Economics Division Labor Force Statistics Branch Presented at the American Sociological Association
Florida s Families and Children Below the Federal Poverty Level
 Florida s Families and Children Below the Federal Poverty Level Florida Senate Committee on Children, Families, and Elder Affairs Presented by: February 17, 2016 The Florida Legislature Office of Economic
A Geographic Profile of. Chicago Lawn, Gage Park, West Elsdon and West Lawn. Neighborhoods Served by. The Southwest Organizing Project
 A Geographic Profile of Chicago Lawn, Gage Park, West Elsdon and West Lawn Neighborhoods Served by The Southwest Organizing Project The Southwest Organizing Project (SWOP) is a broad based community organization
Field of Degree and Earnings by Selected Employment Characteristics: 2011
 Field of Degree and Earnings by Selected Employment Characteristics: 0 American Community Survey Briefs By Camille Ryan Issued October 0 ACSBR/-0 INTRODUCTION This brief provides information about the
Schuylkill County Demographics:
 Schuylkill County Demographics: Following is data collected specifically for Schuylkill County, Pennsylvania. The majority of the data below (without notation) has been obtained from the American Community
EASI Reseller Opportunities: Demographic Estimates and Forecasts; Life Stage Clusters; Major Merchandise Lines and Minor Store Groups
 EASI Reseller Opportunities: Demographic Estimates and Forecasts; Life Stage Clusters; Major Merchandise Lines and Minor Store Groups Introduction Easy Analytic Software, Inc. (EASI) is a New York-based
California Marijuana Arrests
 Working to Reform Marijuana Laws The NORML Almanac of Marijuana Arrest Statistics California Marijuana Arrests Marijuana Arrests 1995-2002 (Summary) Marijuana Possession Arrests-2002 (Demographics) Marijuana
2014 Demographics PROFILE OF THE MILITARY COMMUNITY
 Demographics PROFILE OF THE MILITARY COMMUNITY ACKNOWLEDGEMENTS This report is published by the Office of the Deputy Assistant Secretary of Defense (Military Community and Family Policy), under contract
Summary of Employment, Demographics, and Commuting Patterns for Marion County, Florida
 FLORIDA DEPARTMENT OF ECONOMIC OPPORTUNITY, BUREAU OF LABOR MARKET STATISTICS Summary of Employment, Demographics, and Commuting Patterns for Marion County, Florida March 2015 Contents Labor Shed Analysis...
2008-2012 American Community Survey Income Data for Gwinnett County by Census Tract
 2008-2012 American Community Survey Income Data for Gwinnett County by Census Tract The following maps depict 2008-2012 American Community Survey income and poverty data for Gwinnett County by census tract.
Enrollment under the Medicaid Expansion and Health Insurance Exchanges. A Focus on Those with Behavioral Health Conditions in Florida
 Enrollment under the Medicaid Expansion and Health Insurance Exchanges A Focus on Those with Behavioral Health Conditions in Florida Data Sources National Survey on Drug Use and Health Sponsored by SAMHSA
Changing Demographics of Colorado
 Changing Demographics of Colorado United States 250,000,000 200,000,000 150,000,000 100,000,000 50,000,000 White Black American Indian Asian Pacific Islander Other Race Hispanic 0 1990 2000 2010 2013 Colorado
A Profile of Older Americans: 2014
 A Profile of Older Americans: 2014 Administration on Aging Administration for Community Living U.S. partment of Health and Human Services Table of Contents HIGHLIGHTS... 1 THE OLDER POPULATION... 2 FUTURE
PUBLIC DISCLOSURE COMMUNITY REINVESTMENT ACT PERFORMANCE EVALUATION
 PUBLIC DISCLOSURE February 22, 2010 COMMUNITY REINVESTMENT ACT PERFORMANCE EVALUATION Community Bank of Bergen County RSSD No. 275509 18 Railroad Avenue Rochelle Park, New Jersey 07662 FEDERAL RESERVE
Health Insurance Coverage of Children Under Age 19: 2008 and 2009
 Health Insurance Coverage of Children Under Age 19: 2008 and 2009 American Community Survey Briefs Issued September 2010 ACSBR/09-11 IntroductIon Health insurance, whether private or public, improves children
San Diego County Demographics Profile North Central Region 2011 Population Estimates
 County of San Diego Community Profiles by Region and Subregional Area San Diego County Demographics Profile North Central Region 2011 Population Estimates Published March 2013 County of San Diego, Health
We the People of More Than One Race in the United States
 We the People of More Than One Race in the United States Census 2000 Special Reports Issued April 2005 CENSR-22 By Nicholas A. Jones U S C E N S U S B U R E A U Helping You Make Informed Decisions U.S.
Application for Vocational Rehabilitation Services
 Strong Families Make a Strong Kansas Application for Vocational Rehabilitation Services Is Vocational Rehabilitation the right program for you? Some brief information about the Vocational Rehabilitation
Working Poor Profiles in Rochester, NY
 Working Poor Profiles in Rochester, NY Profile 1: Individuals at or below the poverty level Prepared for Leonard Brock, Ed.D., RMAPI Director Kara S. Finnigan, Ph.D. Madeleine Feldman July 27, 2015 Data
Counting for Dollars: Riverside County, California
 Counting for Dollars: Riverside County, California Federal Assistance Programs that Distributed Funds in Riverside County, California on the Basis of Census-Related Statistics, Fiscal Year 2008 This table
A SNAPSHOT OF ALPENA COUNTY
 A SNAPSHOT OF ALPENA COUNTY agbioresearch.msu.edu msue.msu.edu About the Data This County Profile is to be used with the 2015-2016 Issue Identification process for State University Extension. Unless otherwise
STATE DATA CENTER. District of Columbia MONTHLY BRIEF
 District of Columbia STATE DATA CENTER MONTHLY BRIEF N o v e m b e r 2 0 1 2 District Residents Health Insurance Coverage 2000-2010 By Minwuyelet Azimeraw Joy Phillips, Ph.D. This report is based on data
$8,255,000. 5.50% CAP Rate. DeerfieldPartners. John Giordani Art Griffith (415) 685-3035 team@deerfieldteam.com
 685-3035 team@deerfieldteam.com") $8,255,000 5.50% CAP Rate Walgreens Pharmacy #13159 Mobile, Alabama 21+ years of $454,000 NNN rent guaranteed Across the street from the highest grossing CVS in the Mobile, AL market All growth is moving
$8,255,000 5.50% CAP Rate Walgreens Pharmacy #13159 Mobile, Alabama 21+ years of $454,000 NNN rent guaranteed Across the street from the highest grossing CVS in the Mobile, AL market All growth is moving
Demographics in Texas: Changes in Household Characteristics and Changes in Family Structure of the Dallas Area
 Demographics in Texas: Changes in Household Characteristics and Changes in Family Structure of the Dallas Area Dallas Bar Association - Family Law Section February 9, 2012 Dallas, TX Growing States, 2000-2010
Developing Statistical Based Earnings Estimates: Median versus Mean Earnings
 Lawrence M. Spizman. 2013. Developing Statistical Based Earnings Estimates: Median versus Mean Earnings. Journal of Legal Economics 19(2): pp. 77 82. Developing Statistical Based Earnings Estimates: Median