The American Community Survey. A Critical Change in the Re-engineering of Census 2010
|
|
|
- Helena Wade
- 8 years ago
- Views:
Transcription
1 The American Community Survey A Critical Change in the Re-engineering of Census 2010

2 First, a quiz!! What is the difference between short form and long form data on the Decennial Census questionnaire? How often do you use Census data and American FactFinder? Who has heard of, or used, data from ACS?

3 Today s Agenda What is the American Community Survey Comparing ACS with Decennial Census data Methodology Types of Data Quick Guide to 2005 data release of 2004 data Live demonstration Questions and hopefully, some answers

4 What is the ACS The ACS is the first nationwide survey that can be used to monitor annual trends in local communities and make valid comparisons among communities in the years between censuses -Population Reference Bureau

5 What is the American Community Survey? The biggest change in 60 years in conducting the decennial census

6 What is the American Community Survey? A large, continuous demographic survey Produces annual and multi-year estimates of the characteristics of the population and housing Produces characteristics, not a population count Produces information for small areas including tracts, block groups and population subgroups - updated every year Key component of re-engineered 2010 census

7 Key Component of Census 2010 Eliminate the long form* Provide improved knowledge of local areas Ongoing contact with local governments

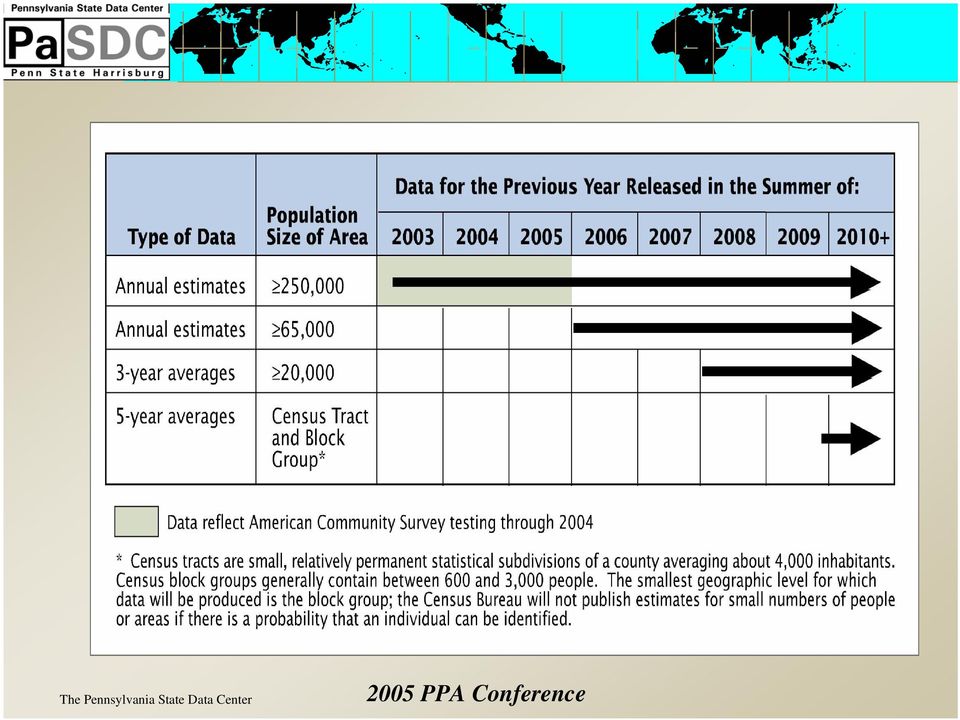
8 When Will ACS Data Be Available? Now, for population areas larger than 250,000 In 2006 ACS will provide data for areas with populations greater than 65,000 In 2010 Smaller geographies will be available in five-year moving averages

9
10 But be careful! Current data for ACS does not include data on group quarters population. So keep that in mind if comparing ACS to Decennial Census, long-form data

11 Decennial Census vs. ACS

12 Decennial Census vs. ACS Decennial Census will deal with coverage ACS will be concerned with content ACS sample size will be smaller, primarily due to cost ACS data will be supplied with confidence intervals which will show the margin of sampling error around the estimates Turnaround time on data releases

13 ACS Methodology Questionnaire is mailed every month of every year to a random sample of addresses No address will receive a form more than once every 5 years 3 phases of data collection Mail-out, mail-back Computer assisted telephone interviewing for non-response Computer assisted personal interviewing of a sample of the remaining unanswered forms

14 ACS Methodology, continued ACS will not accept a proxy response (Census does)

15 Reference Period The Census uses April 1 as the base for most questions. Some questions use 1999 as a reference year. ACS reference varies based on which month the form is mailed.

16 Residency Rules Decennial Census Usual place of residence is the standard ACS Current residence, based on a twomonth rule, with some exceptions

17 Types of Data Summary File 3, long-form type data will be available Educational attainment, poverty, migration, commuter patterns, disability, housing values, income and earnings data

18 Income GEO_ID SUMLEVEL GEO_NAME B19013_1_EST B19013_1_LB B19013_1_UB Geography Identifier Geographic Summary Level Geography Universe: HOUSEHOLDS: Median household income in the past 12 Universe: HOUSEHOLDS: Median household income in the past 12 Universe: HOUSEHOLDS: Median household income in the past US 010 United States 44,684 44,470 44, US Pennsylvania 42,941 42,335 43, US Los Angeles city, California 40,682 39,460 41, US Chicago city, Illinois 40,656 38,591 42, US New York city, New York 41,509 40,780 42, US Philadelphia city, Pennsylvania 30,631 29,112 32, US Pittsburgh city, Pennsylvania 31,910 29,232 34,588

19 Income Using a Multi-Year Profile, we can see the trend in Philadelphia Selected Economic Characteristics 2004 Percent Distribution 2003 Percent Distribution 2002 Percent Distribution 2001 Percent Distribution 2000 Percent Distribution Unemployed * 9.3 * 10.9 * Median household income (dollars) 30,631 33,809 * 32,580 32,365 32,362

20 Poverty Geography Universe: POPULATION FOR WHOM POVERTY STATUS IS DETERMINED: Total (Estimate) Universe: POPULATION FOR WHOM POVERTY STATUS IS DETERMINED: Income in the past 12 months below poverty level (Estimate) Percent of Population in Poverty United States 284,577,956 37,161, Pennsylvania 11,914,064 1,388, Los Angeles city, California 3,728, , Chicago city, Illinois 2,704, , New York city, New York 7,895,185 1,600, Philadelphia city, Pennsylvania 1,408, , Pittsburgh city, Pennsylvania 295,602 55,

21 Poverty by Race and Ethnicity (2003) Geography Hispanic Or Latino Population For Whom Poverty Status Is Determined: Total (Estimate) Hispanic Or Latino Population For Whom Poverty Status Is Determined: Income in the past 12 months below poverty level (Estimate) Percent in Poverty United States 38,980,993 8,543, Pennsylvania 403, , Los Angeles city, California 1,782, , Chicago city, Illinois 741, , New York city, New York 2,235, , Philadelphia city, Pennsylvania 131,431 47,
22 Foreign Born Geography Universe: POPULATION BORN OUTSIDE THE UNITED STATES: Entered U.S or later; Foreign born (Estimate) United States 6,281,567 Pennsylvania 106,957 Philadelphia city, Pennsylvania 34,833 Pittsburgh city, Pennsylvania 4,411
23 Quick Guide to 2004 ACS Using American FactFinder
24 Thematic Maps-NEW for 2004! Reveals the geographic pattern in statistical data (national with states, only) Subjects correspond to those for Ranking Tables Display available to show confidence intervals Toggle from a Ranking Table to corresponding Thematic Map
25
26 Subject Tables-New for 2004! Provide data on a popular topic from a single geographic area Only two tables, national only available now, with more coming A table on Median Earnings is in your packet
27 2004 Data Enhancements Multi-Year Profiles Download all 4 profiles for an area in one Excel file Custom Table feature now available for 2003 and 2004
28
29 Types of Data Tables Available
30
31
32
33
34
35
36
37 In Conclusion ACS deals with content The 2010 Decennial Census will deal with coverage Funding is critical to the ACS remaining a major part of the 2010 Census In 2006, look for geographies greater than 65,000 in size In 2008, look for geographies greater than 20,000
38 For More Information American American Community Community Survey Survey Web Web site site ( Call Call us us at: at: Subscribe to the ACS Alert us
39 Sources U.S. Census Bureau The Population Reference Bureau
40 The American Community Survey A Critical Change in the Re-engineering of Census 2010
HEALTH INSURANCE COVERAGE STATUS. 2009-2013 American Community Survey 5-Year Estimates
 S2701 HEALTH INSURANCE COVERAGE STATUS 2009-2013 American Community Survey 5-Year Estimates Supporting documentation on code lists, subject definitions, data accuracy, and statistical testing can be found
Field of Degree and Earnings by Selected Employment Characteristics: 2011
 Field of Degree and Earnings by Selected Employment Characteristics: 0 American Community Survey Briefs By Camille Ryan Issued October 0 ACSBR/-0 INTRODUCTION This brief provides information about the
Demography. Focus on the three contributors to population change: Fertility, mortality, and migration
 1 Formal Demography Demography Focus on the three contributors to population change: Fertility, mortality, and migration Social Demography Focus on relationship between social, economic, and demographic
Changes in Self-Employment: 2010 to 2011
 Changes in Self-Employment: 2010 to 2011 American Community Survey Briefs By China Layne Issued January 2013 ACSBR/11-21 INTRODUCTION From December 2007 to June 2009, the United States experienced an economic
Using the American Community Survey Data
 Using the American Community Survey Data The ACS website is accessible from www.census.gov/acs. In the middle of the screen choose In-depth Data Go directly to the ACS Datasets Tab The ACS Datasets Tab
DIY Exercises. Linda Clark Data Dissemination Specialist U.S. Census Bureau Alaska, Idaho, Oregon, Washington linda.clark@census.
 Grants Workshop October 21, 2015 Mount Vernon, Washington DIY Exercises Linda Clark Data Dissemination Specialist U.S. Census Bureau Alaska, Idaho, Oregon, Washington linda.clark@census.gov 206-446-8794
Making Cents of All Those Numbers: Using Census Data Effectively
 Making Cents of All Those Numbers: Using Census Data Effectively Gary Krob, State Data Center Program Iowa Library Services/State Library www.iowadatacenter.org Goals for Today To have a general discussion
San Francisco s Widening Income Inequality
 San Francisco s Widening Income Inequality May 2014 San Francisco Human Services Agency Economic Trends May 2014 San Francisco Human Services Agency San Francisco Human Services Agency 3 100% 90% 80% 70%
Demographic Characteristics and Trends in Texas and North Texas: Population and Infrastructure
 Demographic Characteristics and Trends in Texas and North Texas: Population and Infrastructure Plano Chamber of Commerce April 1, 2015 Austin, Texas Total Population and Components of Population Change
The Changing Population of Texas and San Antonio. Masters Leadership Program October 10, 2012 San Antonio, TX
 The Changing Population of Texas and San Antonio Masters Leadership Program October 10, 2012 San Antonio, TX Growing States, 2000-2010 2000 Population* 2010 Population* Numerical Change 2000-2010 Percent
Introduction to Veteran Statistics: Market Research Tools for Veteran Small Businesses
 Introduction to Veteran Statistics: Market Research Tools for Veteran Small Businesses Kelly Ann Holder Social, Economic, and Housing Statistics Division December 2015 1 Finding the Right Data The Census
Men in Nursing Occupations
 Men in Nursing Occupations American Community Survey Highlight Report Issued February 2013 Introduction Healthcare is one of the fastest growing industries. 1 The aging of our population fuels an increasing
American FactFinder (AFF) and The Equal Employment Opportunity Tabulation 2006-2010 Tutorial
 and The Equal Employment Opportunity Tabulation 2006-2010 Tutorial") American FactFinder (AFF) and The Equal Employment Opportunity Tabulation 2006-2010 Tutorial Prepared by: Industry and Occupation Statistics Branch Social, Economic, and Housing Statistics Division U.S.
American FactFinder (AFF) and The Equal Employment Opportunity Tabulation 2006-2010 Tutorial Prepared by: Industry and Occupation Statistics Branch Social, Economic, and Housing Statistics Division U.S.
SELECTED POPULATION PROFILE IN THE UNITED STATES. 2013 American Community Survey 1-Year Estimates
 S0201 SELECTED POPULATION PROFILE IN THE UNITED STATES 2013 American Community Survey 1-Year Estimates Supporting documentation on code lists, subject definitions, data accuracy, and statistical testing
& a. American Communit Survey. Questions and Answers. census.gov. U.S. Department of Commerce Economics and Statistics Administration
 a Questions and Answers American Communit Survey y q U.S. Department of Commerce Economics and Statistics Administration U.S. Census Bureau census.gov AMERICAN COMMUNITY SURVEY What is the American Community
Selected Socio-Economic Data. Baker County, Florida
 Selected Socio-Economic Data African American and White, Not Hispanic www.fairvote2020.org www.fairdata2000.com 5-Feb-12 C03002. HISPANIC OR LATINO ORIGIN BY RACE - Universe: TOTAL POPULATION Population
Demographic and Business
 Introduction to Demographic and Business Data Products and Sources Fundamentals of Census Geographies Census Geographic Entities Nation Regions Divisions States Counties Census Tracts Block Groups Blocks
Health Insurance Coverage: Estimates from the National Health Interview Survey, 2004
 Health Insurance Coverage: Estimates from the National Health Interview Survey, 2004 by Robin A. Cohen, Ph.D., and Michael E. Martinez, M.P.H., Division of Health Interview Statistics, National Center
Utilizing Administrative Records in the 2020 Census. SDC/CIC Steering Committee Update October 24, 2014
 in the 2020 Census SDC/CIC Steering Committee Update October 24, 2014 1 One of the four key design areas related to the preliminary 2020 Census design decision Announcement of the decision planned for
Understanding and Using ACS Single-Year and Multiyear Estimates
 Appendix. Understanding and Using ACS Single-Year and Multiyear Estimates What Are Single-Year and Multiyear Estimates? Understanding Period Estimates The ACS produces period estimates of socioeconomic
Small Business Data Assess Your Competition Define Your Customers
 Small Business Data Assess Your Competition Define Your Customers Census Bureau Data Can Answer Many Questions What Is Census Bureau Data? Economic / business data Economic Census County Business Patterns
Time for a Shared Recovery
 Time for a Shared Recovery Using the Census Data to Show the Harmful and Needless Needless Persistence of Poverty August 19, 2008 1 PART III 21 Deborah Weinstein Executive Director, Coalition on Human
Demographic and Labor Market Profile of the city of Detroit - Michigan
 Demographic and Labor Market Profile of the city of Detroit - Michigan Leonidas Murembya, PhD Regional Coordinator murembyal@michigan.gov www.michigan.gov/lmi 517-241-6574 State of Michigan Department
Who lives in New Orleans and the metro area now? Based on 2012 U.S. Census Bureau data
 Who lives in New Orleans and the metro area now? Based on 2012 U.S. Census Bureau data Vicki Mack and Elaine Ortiz, Greater New Orleans Community Data Center September 26, 2013 This brief examines 2012
2008-2012 American Community Survey Income Data for Gwinnett County by Census Tract
 2008-2012 American Community Survey Income Data for Gwinnett County by Census Tract The following maps depict 2008-2012 American Community Survey income and poverty data for Gwinnett County by census tract.
Veteran Poverty Trends
 Veteran Poverty Trends Prepared by the National Center for Veterans Analysis and Statistics May 2015 NCVAS National Center for Veterans Analysis and Statistics Data Sources and Methods Data for the demographic
Iowa School District Profiles. Central City
 Iowa School District Profiles Overview This profile describes enrollment trends, student performance, income levels, population, and other characteristics of the Central City public school district. The
Measuring America: An Overview of Women- Owned Business and Related Statistics. U.S. Census Bureau December 2014
 Measuring America: An Overview of Women- Owned Business and Related Statistics U.S. Census Bureau December 2014 1 Overview Highlights Search & Navigation Data Examples Data Tools Summary How I might use
The Changing Population of Texas. BP Business Leaders November 8, 2012 Austin, TX
 The Changing Population of Texas BP Business Leaders November 8, 2012 Austin, TX Growing States, 2000-2010 2000 Population* 2010 Population* Numerical Change 2000-2010 Percent Change 2000-2010 United States
USUAL WEEKLY EARNINGS OF WAGE AND SALARY WORKERS FIRST QUARTER 2015
 For release 10:00 a.m. (EDT) Tuesday, April 21, USDL-15-0688 Technical information: (202) 691-6378 cpsinfo@bls.gov www.bls.gov/cps Media contact: (202) 691-5902 PressOffice@bls.gov USUAL WEEKLY EARNINGS
Kentucky Population, Housing, and Jobs: Present and Future
 1 Kentucky Population, Housing, and Jobs: Present and Future Matt Ruther Department of Urban and Public Affairs University of Louisville Kentucky State Data Center Current Demographics 2 Population 3 Total
Using Census Data in your GIS. Craig Best Supervisory Geographer Kansas City Regional Office
 Using Census Data in your GIS Craig Best Supervisory Geographer Kansas City Regional Office 1 Objectives Understand Census Geographic Identifiers Understand how to obtain geographic files Understand how
Ali Modarres California State University, Los Angeles
 Ali Modarres California State University, Los Angeles Data Sources: U.S. Citizenship and Immigration Services and the California Department of Finance, Demographic Research Unit. Data Sources: U.S. Citizenship
Diversity in South Texas
 Diversity in South Texas James E. Bonson, MPAS, PA-C Assistant Professor/Clinical Coordinator School of Health Professions Department of Physician Assistant Studies UT Health Science Center - San Antonio
2016 Homeless Count Results Los Angeles County and LA Continuum of Care. Published by: Los Angeles Homeless Services Authority May 4, 2016 1
 2016 Homeless Count Results Los Angeles County and LA Continuum of Care Published by: Los Angeles Homeless Services Authority May 4, 2016 1 Why Do We Count? The Homeless Count seeks to answer key questions
Suggested Citation: Institute for Research on Higher Education. (2016). College Affordability Diagnosis: Massachusetts. Philadelphia, PA: Institute
. College Affordability Diagnosis: Massachusetts. Philadelphia, PA: Institute") MASSACHUSETTS Suggested Citation: Institute for Research on Higher Education. (2016). College Affordability Diagnosis: Massachusetts. Philadelphia, PA: Institute for Research on Higher Education, Graduate
MASSACHUSETTS Suggested Citation: Institute for Research on Higher Education. (2016). College Affordability Diagnosis: Massachusetts. Philadelphia, PA: Institute for Research on Higher Education, Graduate
CWICstats Chicago Workforce Research & Data Initiative
 CWICstats Chicago Workforce Research & Data Initiative Elizabeth Weigensberg, PhD Senior Researcher & CWICstats Coordinator Chapin Hall at the University of Chicago Midwest Economy: Outlook for 2012 and
CCF Guide to the ACS Health Insurance Coverage Data
 CCF Guide to the ACS Health Insurance Coverage Data 2013 ACS Timeline o Thursday, September 19: The Census Bureau will release the 2012 one-year estimates o Week of November 4: Advocates that would like
Office for Oregon Health Policy and Research. Health Insurance Coverage in Oregon 2011 Oregon Health Insurance Survey Statewide Results
 Office for Oregon Health Policy and Research Health Insurance Coverage in Oregon 2011 Oregon Health Insurance Survey Statewide Results September 2011 Table of Contents Executive Summary... ii 2011 Health
American Community Survey Design and Methodology (January 2014) Chapter 14: Data Dissemination
 Chapter 14: Data Dissemination") American Community Survey Design and Methodology (January 2014) Chapter 14: Data Dissemination Version 2.0 January 30, 2014 ACS Design and Methodology (January 2014) Chapter 14: Data Dissemination Page
American Community Survey Design and Methodology (January 2014) Chapter 14: Data Dissemination Version 2.0 January 30, 2014 ACS Design and Methodology (January 2014) Chapter 14: Data Dissemination Page
Who Can Afford To Live in a Home?: A look at data from the 2006 American Community Survey by Mary Schwartz and Ellen Wilson US Census Bureau
 Who Can Afford To Live in a Home?: A look at data from the 2006 American Community Survey by Mary Schwartz and Ellen Wilson US Census Bureau With creative financing in the present day housing market, housing
Health Insurance Coverage: Estimates from the National Health Interview Survey, 2005
 Health Insurance Coverage: Estimates from the National Health Interview Survey, 2005 by Robin A. Cohen, Ph.D., and Michael E. Martinez, M.P.H., Division of Health Interview Statistics, National Center
EDUCATIONAL ATTAINMENT. 2011-2013 American Community Survey 3-Year Estimates
 S1501 EDUCATIONAL ATTAINMENT 2011-2013 American Community Survey 3-Year Estimates Supporting documentation on code lists, subject definitions, data accuracy, and statistical testing can be found on the
Enrollment under the Medicaid Expansion and Health Insurance Exchanges. A Focus on Those with Behavioral Health Conditions in Maine
 Enrollment under the Medicaid Expansion and Health Insurance Exchanges A Focus on Those with Behavioral Health Conditions in Maine Data Sources National Survey on Drug Use and Health Sponsored by SAMHSA
How to Download Census Data from American Factfinder and Display it in ArcMap
 How to Download Census Data from American Factfinder and Display it in ArcMap Factfinder provides census and ACS (American Community Survey) data that can be downloaded in a tabular format and joined with
For Immediate Release
 Household Income Trends May 2015 Issued July 2015 Gordon Green and John Coder Sentier Research, LLC For Immediate Release 1 Household Income Trends May 2015 Note This report on median household income
How To Map The American Community Survey
 Disadvantaged Community Mapping Tool Tanya Meeth, P.G. DWR Financial Assistance Branch Division of Integrated Regional Water Management April 5, 2013 1 Overview 1. Disadvantaged Community (DAC) Definition
Census 2000 Supplementary Survey. Product Outline for the November 20, 2001 Data Release
 Census 2000 Supplementary Survey Product Outline for the November 20, 2001 Data Release Internet Embargoed Product Geography AFF C2SS site Excel Other 107 Core Tables 1 Nation X X.csv State X X.csv County
The goal is to transform data into information, and information into insight. Carly Fiorina
 DEMOGRAPHICS & DATA The goal is to transform data into information, and information into insight. Carly Fiorina 11 MILWAUKEE CITYWIDE POLICY PLAN This chapter presents data and trends in the city s population
Danny R. Childers and Howard Hogan, Bureau of the,census
 MATCHING IRS RECORDS TO CENSUS RECORDS: SOME PROBLEMS AND RESULTS Danny R. Childers and Howard Hogan, Bureau of the,census A. INTRODUCTION This project has two principal aims: to investigate the feasibility
Enrollment under the Medicaid Expansion and Health Insurance Exchanges. A Focus on Those with Behavioral Health Conditions in Indiana
 Enrollment under the Medicaid Expansion and Health Insurance Exchanges A Focus on Those with Behavioral Health Conditions in Indiana Data Sources National Survey on Drug Use and Health Sponsored by SAMHSA
New Mexico. Comparison Profile prepared by the New Mexico Economic Development Department State Data Center. Page 1 of 5
 DEMOGRAPHICS Population estimates, July 1, 2014 2,085,572 Population, percent change - April 1, 2010 to July 1, 2014 1.4% Population estimates, July 1, 2013 2,085,287 Population, percent change - April
Enrollment under the Medicaid Expansion and Health Insurance Exchanges. A Focus on Those with Behavioral Health Conditions in Washington
 Enrollment under the Medicaid Expansion and Health Insurance Exchanges A Focus on Those with Behavioral Health Conditions in Washington Data Sources National Survey on Drug Use and Health Sponsored by
Enrollment under the Medicaid Expansion and Health Insurance Exchanges. A Focus on Those with Behavioral Health Conditions in Florida
 Enrollment under the Medicaid Expansion and Health Insurance Exchanges A Focus on Those with Behavioral Health Conditions in Florida Data Sources National Survey on Drug Use and Health Sponsored by SAMHSA
Enrollment under the Medicaid Expansion and Health Insurance Exchanges. A Focus on Those with Behavioral Health Conditions in Georgia
 Enrollment under the Medicaid Expansion and Health Insurance Exchanges A Focus on Those with Behavioral Health Conditions in Georgia Data Sources National Survey on Drug Use and Health Sponsored by SAMHSA
Enrollment under the Medicaid Expansion and Health Insurance Exchanges. A Focus on Those with Behavioral Health Conditions in Idaho
 Enrollment under the Medicaid Expansion and Health Insurance Exchanges A Focus on Those with Behavioral Health Conditions in Idaho Data Sources National Survey on Drug Use and Health Sponsored by SAMHSA
The New indicator of Minnesota - A SimpleYet Complex Idea
 J Minnesota will have sustainable, strong economic growth Previous wording: Minnesota will have sustained, above average, strong economic growth that is consistent with environmental protection 1990 1993
AGENCY: Federal Insurance Office, Departmental Offices, Treasury.
 This document is scheduled to be published in the Federal Register on 07/02/2015 and available online at http://federalregister.gov/a/2015-16333, and on FDsys.gov Billing Code 4810-25-P DEPARTMENT OF THE
Subsidy-Eligible Maps
 Background Information Subsidy-Eligible Maps SUBSIDY-ELIGIBLE MAPS NOW AVAILABLE Also known as GIS Maps Covered California first announced the Subsidy-Eligible Maps project during the 2015 Regional In-Person
Enrollment under the Medicaid Expansion and Health Insurance Exchanges. A Focus on Those with Behavioral Health Conditions in New Hampshire
 Enrollment under the Medicaid Expansion and Health Insurance Exchanges A Focus on Those with Behavioral Health Conditions in New Hampshire Data Sources National Survey on Drug Use and Health Sponsored
Williamson County, Texas Changing Demographics and Implications of Growth April 22, 2014
 Williamson County, Texas Changing Demographics and Implications of Growth April 22, 2014 Presentation Overview 1. How fast is Williamson growing? 2. Where are people coming from? 3. How is the population
Health and Social Services Needs in Whitman County. 2015 Community Needs Assessment Results General Report COMMUNITY REPORT OF RESULTS
 COMMUNITY REPORT OF RESULTS This report contains an overview of the results collected by the Health and Social Services Needs in Whitman County Survey. A description of Whitman County, the survey process,
Comparison Profile prepared by the New Mexico Economic Development Department State Data Center. Page 1 of 5
 Comparing New Mexico to Colorado DEMOGRAPHICS Colorado New Mexico Population estimates, July 1, 2014 5,355,866 2,085,572 Population, percent change - April 1, 2010 to July 1, 2014 1.4% 1.4% Population
New York State Profile
 New York State Profile Jennifer Guinn EDUC 547 FALL 2008 According to 2006 U.S. Census estimates, with a total population of over 19 million people, 20 percent of New York State s population were foreign-born
Suggested Citation: Institute for Research on Higher Education. (2016). College Affordability Diagnosis: Texas. Philadelphia, PA: Institute for
. College Affordability Diagnosis: Texas. Philadelphia, PA: Institute for") TEXAS Suggested Citation: Institute for Research on Higher Education. (2016). College Affordability Diagnosis: Texas. Philadelphia, PA: Institute for Research on Higher Education, Graduate School of Education,
TEXAS Suggested Citation: Institute for Research on Higher Education. (2016). College Affordability Diagnosis: Texas. Philadelphia, PA: Institute for Research on Higher Education, Graduate School of Education,
The Population With a Bachelor s Degree or Higher by Race and Hispanic Origin: 2006 2010
 The Population With a Bachelor s Degree or Higher by Race and Hispanic Origin: 2006 2010 American Community Survey Briefs By Stella U. Ogunwole, Malcolm P. Drewery, Jr., and Merarys Rios-Vargas Issued
Orange County PROFILES
 Orange County PROFILES VOLUME 10, NUMBER 1 MARCH 2005 CENTER FOR DEMOGRAPHIC RESEARCH ORANGE COUNTY MOVERS: 1995-2000 INTRODUCTION Three events change population size and composition in a particular area:
Oklahoma City Leads Large Cities in Job Creation
 Page 1 of 6 Tuesday, April 03, 2012 Updated 02:45 PM ET March 29, 2012 Oklahoma City Leads Large Cities in Job Creation Providence-area employees report the lowest net job creation across the 50 largest
Migration Patterns and Mover Characteristics from the 2005 ACS Gulf Coast Area Special Products
 Migration Patterns and Mover Characteristics from the 2005 ACS Gulf Coast Area Special Products Kin Koerber Housing and Economic Household Statistics Division U.S. Census Bureau Presented at the Southern
A Geographic Profile of. Chicago Lawn, Gage Park, West Elsdon and West Lawn. Neighborhoods Served by. The Southwest Organizing Project
 A Geographic Profile of Chicago Lawn, Gage Park, West Elsdon and West Lawn Neighborhoods Served by The Southwest Organizing Project The Southwest Organizing Project (SWOP) is a broad based community organization
Real Mean and Median Income, Families and Individuals, 1947-2012, and Households, 1967-2012 (Reported in $2012).
.") Income Real Mean and Median Income, Families and Individuals, 1947-2012, and Households, 1967-2012 (Reported in $2012). $80,000 $60,000 Median Family Income Mean Family Income Median Household Income Mean
Income Real Mean and Median Income, Families and Individuals, 1947-2012, and Households, 1967-2012 (Reported in $2012). $80,000 $60,000 Median Family Income Mean Family Income Median Household Income Mean
The Foreign-Born Population in the United States: 2010
 The Foreign-Born Population in the United States: 2010 American Community Survey Reports Issued May 2012 ACS-19 INTRODUCTION This report presents a portrait of the foreign-born population in the United
Educational Attainment
 Educational Attainment Five Key Data Releases From the U.S. Census Bureau Media Webinar February 23, 2012 Webinar access information Toll free number: 888 790 3288 Passcode: CENSUS URL: https://www.mymeetings.com/nc/join/
Educational Attainment. Five Key Data Releases From the U.S. Census Bureau
 Educational Attainment Five Key Data Releases From the U.S. Census Bureau 100% 90% 80% 70% Educational Attainment of the Population 25 Years and Older: 2011 30 percent 1% 2% 8% 19% Doctorate degree Professional
Examining Health Insurance Coverage Gaps among Adults in Southeastern Pennsylvania
 Examining Health Insurance Coverage Gaps among Adults in Southeastern Pennsylvania Pennsylvania s Public Health Association s Annual Conference September 27, 2011 Sarah Ingerman, BA Nicole Dreisbach, MPH
Health Insurance Coverage of Children Under Age 19: 2008 and 2009
 Health Insurance Coverage of Children Under Age 19: 2008 and 2009 American Community Survey Briefs Issued September 2010 ACSBR/09-11 IntroductIon Health insurance, whether private or public, improves children
SELECTED SOCIAL CHARACTERISTICS IN THE UNITED STATES. 2012 American Community Survey 1-Year Estimates
 DP02 SELECTED SOCIAL CHARACTERISTICS IN THE UNITED STATES 2012 American Community Survey 1-Year Estimates Supporting documentation on code lists, subject definitions, data accuracy, and statistical testing
What It s Worth: Field of Training and Economic Status in 2009
 What It s Worth: Field of Training and Economic Status in 2009 Household Economic Studies Issued February 2012 P70-129 INTRODUCTION The relationship between educational attainment and economic outcomes
We the People of More Than One Race in the United States
 We the People of More Than One Race in the United States Census 2000 Special Reports Issued April 2005 CENSR-22 By Nicholas A. Jones U S C E N S U S B U R E A U Helping You Make Informed Decisions U.S.
How To Calculate The Foreign Born Population In The United States
 Estimates of the Unauthorized Immigrant Population Residing in the United States: January 2011 MICHAEL HOEFER, NANCY RYTINA, AND BRYAN BAKER This report provides estimates of the size of the unauthorized
Suggested Citation: Institute for Research on Higher Education. (2016). College Affordability Diagnosis: South Carolina. Philadelphia, PA: Institute
. College Affordability Diagnosis: South Carolina. Philadelphia, PA: Institute") SOUTH CAROLINA Suggested Citation: Institute for Research on Higher Education. (2016). College Affordability Diagnosis: South Carolina. Philadelphia, PA: Institute for Research on Higher Education, Graduate
SOUTH CAROLINA Suggested Citation: Institute for Research on Higher Education. (2016). College Affordability Diagnosis: South Carolina. Philadelphia, PA: Institute for Research on Higher Education, Graduate
Statistics Canada s National Household Survey: State of knowledge for Quebec users
 Statistics Canada s National Household Survey: State of knowledge for Quebec users Information note December 2, 2013 INSTITUT DE LA STATISTIQUE DU QUÉBEC Statistics Canada s National Household Survey:
PUBLIC DISCLOSURE. December 17, 2007 COMMUNITY REINVESTMENT ACT PERFORMANCE EVALUATION. Excel National Bank Charter Number 24493
 O SMALL BANK Comptroller of the Currency Administrator of National Banks Washington, DC 20219 PUBLIC DISCLOSURE December 17, 2007 COMMUNITY REINVESTMENT ACT PERFORMANCE EVALUATION Excel National Bank Charter
Summary of Employment, Demographics, and Commuting Patterns for Marion County, Florida
 FLORIDA DEPARTMENT OF ECONOMIC OPPORTUNITY, BUREAU OF LABOR MARKET STATISTICS Summary of Employment, Demographics, and Commuting Patterns for Marion County, Florida March 2015 Contents Labor Shed Analysis...
A Cardinal That Does Not Look That Red: Analysis of a Political Polarization Trend in the St. Louis Area
 14 Missouri Policy Journal Number 3 (Summer 2015) A Cardinal That Does Not Look That Red: Analysis of a Political Polarization Trend in the St. Louis Area Clémence Nogret-Pradier Lindenwood University
Voter Turnout by Income 2012
 American democracy is challenged by large gaps in voter turnout by income, age, and other factors. Closing these gaps will require a sustained effort to understand and address the numerous and different
Suggested Citation: Institute for Research on Higher Education. (2016). College Affordability Diagnosis: Tennessee. Philadelphia, PA: Institute for
. College Affordability Diagnosis: Tennessee. Philadelphia, PA: Institute for") TENNESSEE Suggested Citation: Institute for Research on Higher Education. (2016). College Affordability Diagnosis: Tennessee. Philadelphia, PA: Institute for Research on Higher Education, Graduate School
TENNESSEE Suggested Citation: Institute for Research on Higher Education. (2016). College Affordability Diagnosis: Tennessee. Philadelphia, PA: Institute for Research on Higher Education, Graduate School
Suggested Citation: Institute for Research on Higher Education. (2016). College Affordability Diagnosis: Florida. Philadelphia, PA: Institute for
. College Affordability Diagnosis: Florida. Philadelphia, PA: Institute for") FLORIDA Suggested Citation: Institute for Research on Higher Education. (2016). College Affordability Diagnosis: Florida. Philadelphia, PA: Institute for Research on Higher Education, Graduate School of
FLORIDA Suggested Citation: Institute for Research on Higher Education. (2016). College Affordability Diagnosis: Florida. Philadelphia, PA: Institute for Research on Higher Education, Graduate School of
Suggested Citation: Institute for Research on Higher Education. (2016). College Affordability Diagnosis: Connecticut. Philadelphia, PA: Institute for
. College Affordability Diagnosis: Connecticut. Philadelphia, PA: Institute for") CONNECTICUT Suggested Citation: Institute for Research on Higher Education. (2016). College Affordability Diagnosis: Connecticut. Philadelphia, PA: Institute for Research on Higher Education, Graduate
CONNECTICUT Suggested Citation: Institute for Research on Higher Education. (2016). College Affordability Diagnosis: Connecticut. Philadelphia, PA: Institute for Research on Higher Education, Graduate
Changing Demographics of Colorado
 Changing Demographics of Colorado United States 250,000,000 200,000,000 150,000,000 100,000,000 50,000,000 White Black American Indian Asian Pacific Islander Other Race Hispanic 0 1990 2000 2010 2013 Colorado
The report focuses on descriptive patterns of aspects of housing for US Latinos,
 No Place Like Home: The State of Hispanic Housing in Chicago, Los Angeles, and New York City, 2003 Research Report Eileen Diaz McConnell, Ph.D. Department of Sociology and Latina/Latino Studies University
CITY OF BELL REQUEST FOR PROPOSAL FOR Spanish Translation and Interpretation Services
 CITY OF BELL REQUEST FOR PROPOSAL FOR Spanish Translation and Interpretation Services SUBMITTAL: One (1) original must be received on or before 2:00 p.m., March 18, 2015 Addressed to: Angela Bustamante,
Source and Accuracy of Estimates for Income and Poverty in the United States: 2014 and Health Insurance Coverage in the United States: 2014
 Source and Accuracy of Estimates for Income and Poverty in the United States: 2014 and SOURCE OF DATA The estimates in the reports Income and Poverty in the United States: 2014 and Health Insurance Coverage
The Non-English Speaking Population in Hawaii
 Data Report 2011 The Non-English Speaking Population in Hawaii Introduction The report examines social, economic and demographic characteristics of people in Hawaii who speak language other than English
Educational Attainment in the United States: 2003
 Educational Attainment in the United States: 2003 Population Characteristics Issued June 2004 P20-550 The population in the United States is becoming more educated, but significant differences in educational
King County s Changing Demographics
 King County s Changing Demographics A View of Our Increasing Diversity Chandler Felt, Demographer King County Office of Performance, Strategy and Budget King County Council, June 5, 2013 A note on sources
Producing official statistics via voluntary surveys the National Household Survey in Canada. Marc. Hamel*
 Proceedings 59th ISI World Statistics Congress, 25-30 August 2013, Hong Kong (Session STS034) p.1762 Producing official statistics via voluntary surveys the National Household Survey in Canada Marc. Hamel*
2016 State Data Center Annual Training Conference April 4-8, 2016 U.S. Census Bureau Headquarters
 2016 State Data Center Annual Training Conference April 4-8, 2016 U.S. Census Bureau Headquarters Briefing to the NY SDC Affiliate Meeting on the 2016 National SDC Meeting Data Dissemination Tools New
Same-sex Couples Consistency in Reports of Marital Status. Housing and Household Economic Statistics Division
 Same-sex Couples Consistency in Reports of Marital Status Author: Affiliation: Daphne Lofquist U.S. Census Bureau Housing and Household Economic Statistics Division Phone: 301-763-2416 Fax: 301-457-3500
1. Demographic Development
 1. Demographic Development Accomplishments Over the Past Five Years The Alamo Area Metropolitan Planning Organization (MPO) continually improves upon its demographic forecasting processes and methodology.