General Construction & Operation of Oscilloscopes
|
|
|
- Thomasine Hutchinson
- 3 years ago
- Views:
Transcription
1 Science 14 Lab 2: The Oscilloscope Introduction General Construction & Operation of Oscilloscopes An oscilloscope is a widely used device which uses a beam of high speed electrons (on the order of 10 7 m/sec) to create a visual display of the waveforms of periodically changing voltages. It not only allows us to see the shape of the waveform, but also to obtain such quantitative data as the waveform's frequency, period and amplitude. Oscilloscopes are powerful research tools and are used extensively in both the physical and biological sciences. It is the intent of this laboratory exercise to familiarize you with the general construction and operation of oscilloscopes and to introduce you to the particular scope you will be using in the laboratory. The display mechanism, of an oscilloscope is a highly evacuated tube called a cathode-ray tube (abbreviated CRT), the principal of which are shown in figure 1. The heater heats the cathode to a temperature high enough to boil electrons off its surface. As the electrons are boiled off the cathode, they are accelerated down the CRT by the focusing anode which is kept at a high positive voltage with respect to the cathode. This focusing anode has a small hole in its center. Only those electrons that are traveling down the center of the tube will pass through this anode thereby creating a narrow beam. The electrons emerging from the focusing anode are further accelerated by the accelerating anode; and if the deflecting plates do not have a potential difference between them, the figure 1
2 electrons will travel in a straight line to the far end of the tube where they will strike the center of a phosphor-coated screen creating a small bright spot. The control grid can be made more or less negative thereby controlling the intensity of the spot by controlling the number of electrons reaching the screen. The heater, cathode, control arid, and anodes constitute the part of the CRT called the electron gun (which will be studied in a later laboratory). The electron beam can be deflected by two sets of deflecting plates oriented at right angles to each other. If a potential difference is placed across either set of plates an electric field will be created transverse to the direction of the beam resulting in a force on the electrons that will deflect them so they hit off the center of the screen. If the plates are properly designed, the amount of deflection will be proportional to the potential difference. The two sets of plates are oriented so that one set deflects the beam in the horizontal direction and the other deflects the beam in the vertical direction. The x, and y coordinates of the spot at any instant are then proportional to the voltages on the respective deflection plates. The electron path between each pair of plates is approximately 2 cm and the total beam path is on the order of 30 cm. An electron spends approximately 2 x 10⁻⁹ seconds between each set of deflection plates and has a total time of flight on the order of 30 x 10-9 seconds (30 nanoseconds). Thus, the beam is capable of extremely rapid response to varying voltages. The two sets of deflection plates are generally used simultaneously to produce either a display of V(t) vs. t or a display of V 1 (t) vs. V 2 (t). To obtain a display of V(t) vs. t, the voltage to be observed is applied to the vertical deflection plates and a voltage which increases uniformly with time is applied to the horizontal plates. The horizontal deflecting voltage (sweep voltage) is supplied by a voltage generator built into the oscilloscope; and it has the shape shown in figure 2. At t = 0, the sweep voltage is figure 2
3 negative enough to cause the beam to be at the far left of the screen. As t progresses, the voltage becomes more positive at a uniform rate causing the beam to be swept across the screen from left to right at a constant rate. At t = T, the beam reaches the far right side of the screen and the voltage immediately jumps back to negative thereby putting the beam back to the far left of the screen. The pattern then repeats itself. At the same time as the sweep voltage is sweeping the beam horizontally from left to right across the screen, the voltage to be observed is deflecting the beam vertically. In this way the vertical deflection is proportional to V(t), the horizontal to time, and the spot traces out a graph of V as a function of time. The frequency of the sweep voltage is variable and it can be synchronized with the frequency of the vertical deflecting voltage to obtain a stable display. The sweep voltage is sometimes called the linear time base. Figure 3 shows the voltage patterns for the deflection plates and their respective screen displays for an observed sine wave voltage. figure 3 With this type of display, the amplitude and frequency (or period) of the observed voltage can be measured. To obtain a display of V 1 (t) vs. V 2 (t), the sweep voltage is disconnected from the horizontal deflection plates and is replaced by V 2 (t). In this way the vertical position of the beam is proportional to V 1 (t) while the horizontal position is proportional to V 2 (t). The resulting displays are called lissajous figures when V 1 (t) and V 2 (t) are described by sine waves; the lissajous figures can be used to determine the phase difference between the two waves. A complete discussion of how this is done is found later in this write-up.
4 In addition to the CRT and sweep generator, an oscilloscope contains the following functional units: 1. Power supply. The power supply supplies the potentials for the electrodes of the electron gun, the current to heat the cathode, the potential to run the sweep generator, and any other power needed by the scope. 2. Signal amplifiers. Full scale deflections require about 200 V. To display small signals (as small as 1 mv), both the vertical and horizontal deflections are amplified using variable gain amplifiers. The amplifiers also permit adjustment of the size of the picture on the screen. 3. Triggering. In the "free run" mode, the horizontal sweep runs at a set rate. This rate is unlikely to be synchronized with the input signal, so the pattern will not be steady on the screen. To keep the pattern steady, a "trigger" is used to determine when the horizontal sweep will begin. The horizontal sweep - starts when the trigger signal reaches some value, which is adjustable with the trigger level control. The displayed signal may be used for triggering, or another signal may be supplied to the scope as an external trigger. For our purposes, it will not be necessary to know the actual trigger level, but it will only be necessary to adjust the trigger level until a steady display is obtained. Additional controls permit moving the entire picture up and down or sideways, magnifying a small portion of the display, synchronizing the sweep frequency exactly with the frequency of the vertical deflecting voltage, and triggering the trace at various levels. Figure 4 is a picture of the scope, you will be using in this and future labs. The function of each control is explained below. 1. POWER switch: When in the up position, the oscilloscope is on. 2. INDICATOR LIGHT: Lights when power is on. 3. TRACE ALIGN: When only the horizontal deflection plates are functioning, turning this screw aligns the trace with the horizontal axis. 4. FIND BEAM: When pressed, returns the off set beam to the display screen. 5. INTENSITY: Adjusts the brightness of the display. 6. FOCUS: Adjusts sharpness of display.
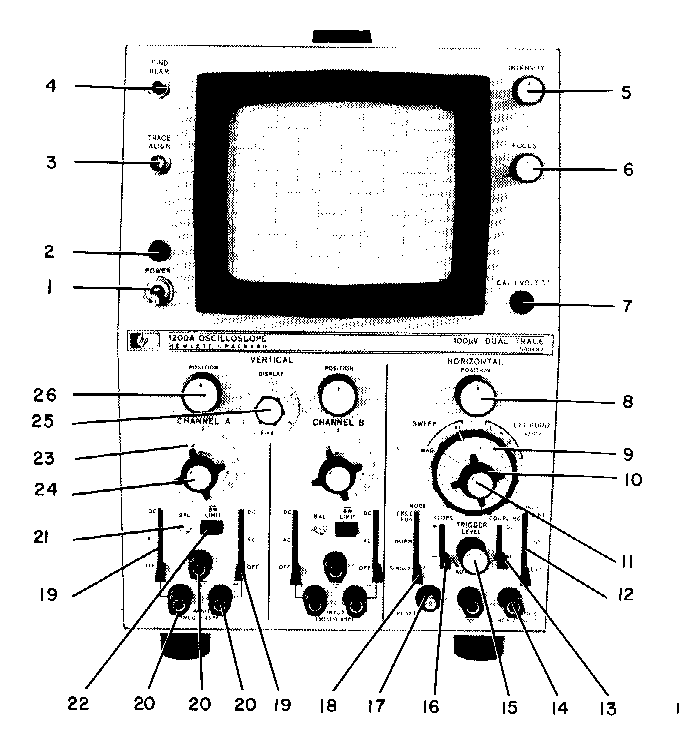
5 figure 4
6 7. CAL: When a wire is run from this jack to one of the channels, a 1 V square wave is fed into that channel. In this way, the calibrated values on the vertical gain dials can be checked. 8. HORIZONTAL POSITION: Turning of this control moves the display horizontally on the screen. 9. SWEEP/EXT HORIZ.: In the SWEEP position, the sweep generator is activated. is the normal operating position. If in the MAG position, the horizontal time scale is magnified by 10. The EXT HORIZ. position determines the deflection factor of external signals applied to TRIG & HORIZ INPUT jack. 10. TIME/DIV: Selects the speed at which the beam is to be swept horizontally across the screen. The time it takes to move 1 division (1 cm) on the screen is given by numbers around this dial. Note, however, that for those numbers to accurately represent the sweep speed, the VAR SWEEP (11), control must be turned full clockwise. 11. VAR SWEEP: Allows selection of a sweep not given on the TIME/DIV dial. 12. SOURCE: Selects the origin of trigger signal that starts sweep. The normal operating position is INT. 13. COUPLING: Determines whether the input signal is joined to the deflection plates through a capacitor (if AC button is depressed) or directly (if DC button is depressed). Use of AC screens out unwanted DC signals. 14. TRIG & HORIZ. INPUT: Input jacks for external trigger signals. 15. TRIGGER LEVEL: This determines the amplitude of the signal needed to start a horizontal sweep. If on automatic (full counterclockwise), the scope will trigger on any incoming signal. If turned clockwise off automatic, the scope will trigger only for incoming signals above a certain amplitude. The exact amplitude is determined by how far clockwise the control is turned. 16. SLOPE: If this switch is in the + position, the trace will start on a portion of the signal which has a positive slope. If the switch is in the - position, the trace will start on a portion of the signal with a negative slope. 17. RESET: In SINGLE mode, pressing this push button resets sweep to zero and releasing it arms the circuit preparatory to receipt of trigger signal. Indicator lamp glows when circuit is armed.
7 18. MODE: In NORM, the sweep is periodically started by incoming signal. In SINGLE, sweep is triggered only once then must be manually reset. In FREE RUN, sweep cycles continuously and is not affected by trigger signals. 19. VERTICAL COUPLING: Selects capacitive (AC) or direct (DC) coupling of vertical input signals. In OFF, vertical amplifier input circuit is grounded and INPUT jacks are disconnected. 20. INPUT: Jacks for channel A and channel B inputs. If + jack. is used with the black ground jack, voltage is measured with respect to ground. If red + and - jacks are used the voltage measured is the potential difference between the two jacks. 21. BW LIMIT: When pressed, reduces bandpass to about 50 KHz to attenuate noise level. Press again to restore bandpass. 22. BAL.: Turning these screws minimizes the trace shifts when changing VOLTS/DIV ranges. 23. VAR SENS: Allows for a vertical calibration not given on the VOLTS/DIV (24) dial. 24. VOLTS/DIV: Selects the vertical deflection amplifier factor. The voltage value of each division on the screen is given by numbers around the outside of the dial. As with the TIME/DIV (10), the numbers are accurate only if the VAR Sens (23) controls are full clockwise. 25. DISPLAY: If set on A, the display is V A (t) vs. t with V A (t) being the signal input to channel A. If set on B, the display is V B (t) vs. t with V B (t) being the signal input to channel B. If set on alternate or chop, V A (t) vs. t and V B (t) vs. t will be displayed simultaneously. If set on A vs B, the display will be V (t) vs V (t) where channel A gives the y-deflection and channel B gives the x-deflection. 26. VERTICAL POSTION: Adjusts vertical position of display. Lissajous Figures and the Measurement of Phase Suppose you are feeding into the two channels of an oscilloscope two voltages that are varying sinusodially with the same frequency. This can be expressed as V 1 (t) = A sin ωt
8 V 2 (t) = B sin (ωt + δ) where A and B are the maximum amplitudes of the voltages and δ is the phase difference between the voltages. A, B and δ are constant. What would a plot of V 1 vs V 2 look like? To answer this we will look at a few special cases. 1. δ=0. In this case V 1 (t) = A sin ωt V 2 (t) = B sin ωt. Dividing the bottom equation into the top and solving for V 1 (t) yields V 1 t = A B V 2 t This is the general form of a linear equation, y = ax + b, where a = A/B and b = 0. Therefore, a plot of V 1 vs. V 2 would be a straight line through the origin with slope A/B. (see figure 5) If A=B the line would be at a 45 angle with the V 2 axis. figure 5 2. δ = ± (π/2). This gives V 1 (t) = A sin ωt V 2 t = B sin(ωt ± π ) = B cos ωt 2
9 If we divide by A and B, square both equations, and then add, we get V 1 t 2 A 2 + V 2 t =1 B 2 2 This is the general form of an ellipse. Therefore, a plot t of V 1 (t) vs V 2 (t) would be elliptical with its major axis coinciding with one of the axes of the coordinate system. If A = B, then the plot is a circle. (see figure 6) figure 6 3. δ = π. This gives V 1 (t) = A sin ωt V 2 = B sin ωt +π = B sin ωt Dividing the bottom equation into the top and solving for V(t) yields V 1 t = A B V 2 t Again we have a linear equation. A plot of V 1 (t) vs. V 2 (t) would be a straight line with a slope of -A/B. (see figure 7)
10 figure 7 4. Cases other than those above are difficult to analyze, but it can be shown that they are ellipses with their axes tilted with respect to the V 1 and V 2 axes. (see figure 8) figure 8 At t = 0, our original equations become V 1 t = A sin 0 = 0 V 2 t = B sin δ In figure 8, V 2 (t) = x 0 when t = 0. Solving for sin δ yields B sin δ =x o
11 or δ = sin 1 x o B Note that the pattern must be centered on the horizontal and vertical axes for this to work. To minimize this centering error, it is better to calculate x 0 and B by measuring 2 x 0 and 2B (as shown in figure 9) and then dividing by 2. figure 9 A more direct method of measuring phase difference is possible with the dual-mode scope by displaying both signals simultaneously, as shown in figure 10. If V 1 (t) = A sin ωt and V 2 (t) = B sin (ωt + δ) then the phase difference, δ, is given (in radians) by δ = 2π (d/p), where P is the period of either signal V 1 or V 2 figure 10
12 References The following sections in Halliday and Resnick are pertinent to the lab 1. Chapter 27 section 27-5 (examples 8 and 9) 2. Chapter 15 section 15-7 Purpose The purpose of this lab is to familiarize you with the general construction and operation of oscilloscopes and to introduce you to the particular scope you will be using in future labs. Procedure 1. Follow this initial turn on procedure. a. Turn the POWER switch to the ON position and allow a few minutes to warm up. b. Set INTENSITY to midrange. c. Set DISPLAY to CH A. d. Set VAR SENS and VAR SWEEP full clockwise. e. Set VOLTS/DIV to 0.5 volts/div. f. Set TIME/DIV to 5 ms/div. g. Set the BW LIMIT to the OUT position. h. Set VERTICAL and HORIZONTAL POSITIONS to mid range. i. Set MODE to NORM. j. Set SOURCE to INT. k. Connect a wire from the positive terminal on channel A to the CAL jack. Set coupling to AC. l. Adjust the FOCUS and INTENSITY to obtain a sharp display. At this point you should see a square wave with an amplitude of 2 divisions and a period of approximately 3.4 divisions.
13 2. With the scope set as above, do the following. a. Sketch the observed trace. b. Measure the peak-to-peak amplitude of the square wave. c. Measure the period of the square wave. d. Change the vertical gain to 1 volt/div. Has the amplitude of the square wave changed? Explain. e. Change the sweep speed to 10 msec/div. Has the period of the square waved changed? Explain. f. Input a sine wave from your oscillator into channel A and turn the sine wave amplitude knob clockwise to its maximum value. Measure the peak-to-peak amplitude of the sine wave. Turn the sine wave amplitude knob full counterclockwise to its minimum value. Measure the peak-to-peak amplitude of the sine wave. What is the range of sine wave voltages your oscillator can put out? g. Repeat step 2f with the square-wave output of your oscillator. h. Change the sweep dial to MAG. Determine the power of magnification. i. Return the VOLTS/DIV & TIME/DIV to their original settings and set the MODE to LINE. Describe what you see and explain what is happening. What could you do to make the trace stable? j. Set the MODE to FREE RUN. Describe what you see and explain what. is happening. 3. Connect the output from the sine wave terminals of your oscillator to either channel A or B. a. Set the oscillator dial to I kilohertz (1000 Hz). Measure the period of the sine wave. Compute the frequency from the period. Compare with the oscillator dial. b. Repeat step 3a using the square wave output of the oscillator. c. Reconnect the sine wave output to the scope. Turn the HORIZONTAL POSITION until you can see the left hand edge of the trace. Set the SLOPE to +. Turn the TRIGGER LEVEL off automatic. Continue turning until a trace can be seen. Turn the TRIGGER LEVEL clockwise. Describe what
14 happens to the trace. In particular, pay attention to the left hand edge of the trace. Now turn the trigger level counterclockwise. Again describe what happens to the trace. Explain. How does the SLOPE switch effect the trigger mechanism? Turn the TRIGGER LEVEL until a trace is again observed. Turn down the amplitude of the wave by using the sine wave amplitude control on the oscillator. Describe what happens to the trace. Explain. d. Turn the TRIGGER LEVEL back to midrange and increase the amplitude of the sine wave until it has a peak-to-peak amplitude of 8 volts. Turn the VAR SENS control counterclockwise. Describe what happens to the trace. Is the amplitude of the wave changing? Calibrate your scope to a value not given on the VOLTS/DIV scale. Turn down the amplitude of the sine wave approximately 1/8 turn. Measure the new sine wave s amplitude using your calibration. Put the scope back on automatic calibration (by turning the VAR SENS fully clockwise until a click is heard. Again measure the amplitude of the. new sine wave. Compare the two values. 4. The phase-shifter boxes on each bench have two pairs of output terminals. Input the signal from one pair of terminals into channel A and input the signal from the other pair into channel B. Display both signals simultaneously by setting DISPLAY to ALTERNATE. Note that the internal sweep triggers on channel A, but that the oscillator connected to B can also be connected to the external trigger and then the scope will trigger on channel B. Now switch the DISPLAY to A vs B and observe the differences when the horizontal sweep is sinusodial rather than sawtooth. When the frequencies are integral multiples of each other, one finds the so-called lissajous figures, which can be used to measure the relative phase and frequency of the two signals. The frequency of the signal from the gray box is 6 KHz. Set the frequency of your oscillator to 6 KHz and use the fine tuning to obtain as stable a trace as possible (What must be true to get a stable trace?). Sketch and describe what you see. Repeat this procedure with frequencies of 12 KHz, 18 KHz, 3 KHz, and 2 KHz. 5. Leaving channel A connected to the red terminal of the gray box, connect the black terminal to channel B of you scope. Display A vs. B. At this point the lab instructor will tell you what to do. The vertical gains should be at the same setting for both channels. 6. Input the signal from the red terminal into channel A and input a signal from your function generator into channel B. Using lissajous figures determine the frequency of the signal from the red terminal.
15 Lab Report Your lab report will be your lab notebook. Include in your report all the sketches and explanations asked for in the procedure and the answers to all questions asked in the procedure. Be neat and organized in your presentation. There will be a laboratory quiz at the end of the period, in which you will be asked to make certain measurements using the oscilloscope.
Electrical Resonance
 Electrical Resonance (R-L-C series circuit) APPARATUS 1. R-L-C Circuit board 2. Signal generator 3. Oscilloscope Tektronix TDS1002 with two sets of leads (see Introduction to the Oscilloscope ) INTRODUCTION
Lab 1: The Digital Oscilloscope
 PHYSICS 220 Physical Electronics Lab 1: The Digital Oscilloscope Object: To become familiar with the oscilloscope, a ubiquitous instrument for observing and measuring electronic signals. Apparatus: Tektronix
1. Oscilloscope is basically a graph-displaying device-it draws a graph of an electrical signal.
 CHAPTER 3: OSCILLOSCOPE AND SIGNAL GENERATOR 3.1 Introduction to oscilloscope 1. Oscilloscope is basically a graph-displaying device-it draws a graph of an electrical signal. 2. The graph show signal change
EXPERIMENT NUMBER 5 BASIC OSCILLOSCOPE OPERATIONS
 1 EXPERIMENT NUMBER 5 BASIC OSCILLOSCOPE OPERATIONS The oscilloscope is the most versatile and most important tool in this lab and is probably the best tool an electrical engineer uses. This outline guides
Figure 1: Multiple unsynchronized snapshots of the same sinusoidal signal.
 1 Oscilloscope Guide Introduction An oscilloscope is a device used to observe and measure time-dependent electronic signals. It is essentially an enhanced voltmeter which displays a graph of potential
EXPERIMENT NUMBER 8 CAPACITOR CURRENT-VOLTAGE RELATIONSHIP
 1 EXPERIMENT NUMBER 8 CAPACITOR CURRENT-VOLTAGE RELATIONSHIP Purpose: To demonstrate the relationship between the voltage and current of a capacitor. Theory: A capacitor is a linear circuit element whose
Lab E1: Introduction to Circuits
 E1.1 Lab E1: Introduction to Circuits The purpose of the this lab is to introduce you to some basic instrumentation used in electrical circuits. You will learn to use a DC power supply, a digital multimeter
Fundamentals of Signature Analysis
 Fundamentals of Signature Analysis An In-depth Overview of Power-off Testing Using Analog Signature Analysis www.huntron.com 1 www.huntron.com 2 Table of Contents SECTION 1. INTRODUCTION... 7 PURPOSE...
Inductors in AC Circuits
 Inductors in AC Circuits Name Section Resistors, inductors, and capacitors all have the effect of modifying the size of the current in an AC circuit and the time at which the current reaches its maximum
E/M Experiment: Electrons in a Magnetic Field.
 E/M Experiment: Electrons in a Magnetic Field. PRE-LAB You will be doing this experiment before we cover the relevant material in class. But there are only two fundamental concepts that you need to understand.
INTERFERENCE OF SOUND WAVES
 2011 Interference - 1 INTERFERENCE OF SOUND WAVES The objectives of this experiment are: To measure the wavelength, frequency, and propagation speed of ultrasonic sound waves. To observe interference phenomena
Physics 42 Lab 4 Fall 2012 Cathode Ray Tube (CRT)
") Physics 42 Lab 4 Fall 202 Cathode Ray Tube (CRT) PRE-LAB Read the background information in the lab below and then derive this formula for the deflection. D = LPV defl 2 SV accel () Redraw the diagram
Physics 42 Lab 4 Fall 202 Cathode Ray Tube (CRT) PRE-LAB Read the background information in the lab below and then derive this formula for the deflection. D = LPV defl 2 SV accel () Redraw the diagram
ε: Voltage output of Signal Generator (also called the Source voltage or Applied
 Experiment #10: LR & RC Circuits Frequency Response EQUIPMENT NEEDED Science Workshop Interface Power Amplifier (2) Voltage Sensor graph paper (optional) (3) Patch Cords Decade resistor, capacitor, and
Using an Oscilloscope
 Using an Oscilloscope The oscilloscope is used to measure a voltage that changes in time. It has two probes, like a voltmeter. You put these probes on either side of the thing that you want to measure
RC Circuits and The Oscilloscope Physics Lab X
 Objective RC Circuits and The Oscilloscope Physics Lab X In this series of experiments, the time constant of an RC circuit will be measured experimentally and compared with the theoretical expression for
RLC Series Resonance
 RLC Series Resonance 11EM Object: The purpose of this laboratory activity is to study resonance in a resistor-inductor-capacitor (RLC) circuit by examining the current through the circuit as a function
Oscilloscope, Function Generator, and Voltage Division
 1. Introduction Oscilloscope, Function Generator, and Voltage Division In this lab the student will learn to use the oscilloscope and function generator. The student will also verify the concept of voltage
AC Measurements Using the Oscilloscope and Multimeter by Mr. David Fritz
 AC Measurements Using the Oscilloscope and Multimeter by Mr. David Fritz 1 Sine wave with a DC offset f = frequency in Hz A = DC offset voltage (average voltage) B = Sine amplitude Vpp = 2B Vmax = A +
Ph 3504 Nuclear Magnetic Resonance and Electron Spin Resonance
 Ph 3504 Nuclear Magnetic Resonance and Electron Spin Resonance Required background reading Tipler, Llewellyn, section 12-3 (you only need to read the part labeled Nuclear Magnetic Resonance on pages 596-597
FREQUENCY RESPONSE OF AN AUDIO AMPLIFIER
 2014 Amplifier - 1 FREQUENCY RESPONSE OF AN AUDIO AMPLIFIER The objectives of this experiment are: To understand the concept of HI-FI audio equipment To generate a frequency response curve for an audio
Magnetic Fields and Their Effects
 Name Date Time to Complete h m Partner Course/ Section / Grade Magnetic Fields and Their Effects This experiment is intended to give you some hands-on experience with the effects of, and in some cases
6/2016 E&M forces-1/8 ELECTRIC AND MAGNETIC FORCES. PURPOSE: To study the deflection of a beam of electrons by electric and magnetic fields.
 6/016 E&M forces-1/8 ELECTRIC AND MAGNETIC FORCES PURPOSE: To study the deflection of a beam of electrons by electric and magnetic fields. APPARATUS: Electron beam tube, stand with coils, power supply,
INTERFERENCE OF SOUND WAVES
 1/2016 Sound 1/8 INTERFERENCE OF SOUND WAVES PURPOSE: To measure the wavelength, frequency, and propagation speed of ultrasonic sound waves and to observe interference phenomena with ultrasonic sound waves.
SERIES-PARALLEL DC CIRCUITS
 Name: Date: Course and Section: Instructor: EXPERIMENT 1 SERIES-PARALLEL DC CIRCUITS OBJECTIVES 1. Test the theoretical analysis of series-parallel networks through direct measurements. 2. Improve skills
AC CIRCUITS - CAPACITORS AND INDUCTORS
 EXPRIMENT#8 AC CIRCUITS - CAPACITORS AND INDUCTORS NOTE: Two weeks are allocated for this experiment. Before performing this experiment, review the Proper Oscilloscope Use section of Experiment #7. Objective
Measurement of Charge-to-Mass (e/m) Ratio for the Electron
 Ratio for the Electron") Measurement of Charge-to-Mass (e/m) Ratio for the Electron Experiment objectives: measure the ratio of the electron charge-to-mass ratio e/m by studying the electron trajectories in a uniform magnetic
Measurement of Charge-to-Mass (e/m) Ratio for the Electron Experiment objectives: measure the ratio of the electron charge-to-mass ratio e/m by studying the electron trajectories in a uniform magnetic
DIODE CIRCUITS LABORATORY. Fig. 8.1a Fig 8.1b
 DIODE CIRCUITS LABORATORY A solid state diode consists of a junction of either dissimilar semiconductors (pn junction diode) or a metal and a semiconductor (Schottky barrier diode). Regardless of the type,
Reading assignment: All students should read the Appendix about using oscilloscopes.
 10. A ircuits* Objective: To learn how to analyze current and voltage relationships in alternating current (a.c.) circuits. You will use the method of phasors, or the vector addition of rotating vectors
ANADOLU UNIVERSITY DEPARTMENT OF ELECTRICAL AND ELECTRONICS ENGINEERING
 ANADOLU UNIVERSITY DEPARTMENT OF ELECTRICAL AND ELECTRONICS ENGINEERING EEM 102 INTRODUCTION TO ELECTRICAL ENGINEERING EXPERIMENT 9: DIODES AND DC POWER SUPPLY OBJECTIVE: To observe how a diode functions
Lab 4: Magnetic Force on Electrons
 Lab 4: Magnetic Force on Electrons Introduction: Forces on particles are not limited to gravity and electricity. Magnetic forces also exist. This magnetic force is known as the Lorentz force and it is
22.302 Experiment 5. Strain Gage Measurements
 22.302 Experiment 5 Strain Gage Measurements Introduction The design of components for many engineering systems is based on the application of theoretical models. The accuracy of these models can be verified
Lock - in Amplifier and Applications
 Lock - in Amplifier and Applications What is a Lock in Amplifier? In a nut shell, what a lock-in amplifier does is measure the amplitude V o of a sinusoidal voltage, V in (t) = V o cos(ω o t) where ω o
Experiment 2 Diode Applications: Rectifiers
 ECE 3550 - Practicum Fall 2007 Experiment 2 Diode Applications: Rectifiers Objectives 1. To investigate the characteristics of half-wave and full-wave rectifier circuits. 2. To recognize the usefulness
Q1. The graph below shows how a sinusoidal alternating voltage varies with time when connected across a resistor, R.
 Q1. The graph below shows how a sinusoidal alternating voltage varies with time when connected across a resistor, R. (a) (i) State the peak-to-peak voltage. peak-to-peak voltage...v (1) (ii) State the
TESTS OF 1 MHZ SIGNAL SOURCE FOR SPECTRUM ANALYZER CALIBRATION 7/8/08 Sam Wetterlin
 TESTS OF 1 MHZ SIGNAL SOURCE FOR SPECTRUM ANALYZER CALIBRATION 7/8/08 Sam Wetterlin (Updated 7/19/08 to delete sine wave output) I constructed the 1 MHz square wave generator shown in the Appendix. This
Beginners Guide to the TDS 210 and TDS 220 Oscilloscopes
 Beginners Guide to the TDS 210 and TDS 220 Oscilloscopes By David S. Lay P. Eng Foreword This guide contains information to help you become familiar with using digital oscilloscopes. You should work through
The purposes of this experiment are to test Faraday's Law qualitatively and to test Lenz's Law.
 260 17-1 I. THEORY EXPERIMENT 17 QUALITATIVE STUDY OF INDUCED EMF Along the extended central axis of a bar magnet, the magnetic field vector B r, on the side nearer the North pole, points away from this
Magnetic Field of a Circular Coil Lab 12
 HB 11-26-07 Magnetic Field of a Circular Coil Lab 12 1 Magnetic Field of a Circular Coil Lab 12 Equipment- coil apparatus, BK Precision 2120B oscilloscope, Fluke multimeter, Wavetek FG3C function generator,
Lesson 3 DIRECT AND ALTERNATING CURRENTS. Task. The skills and knowledge taught in this lesson are common to all missile repairer tasks.
 Lesson 3 DIRECT AND ALTERNATING CURRENTS Task. The skills and knowledge taught in this lesson are common to all missile repairer tasks. Objectives. When you have completed this lesson, you should be able
Basic oscilloscope operation
 asic oscilloscope operation This worksheet and all related files are licensed under the Creative Commons ttribution License, version.0. To view a copy of this license, visit http://creativecommons.org/licenses/by/.0/,
Experiment #11: LRC Circuit (Power Amplifier, Voltage Sensor)
") Experiment #11: LRC Circuit (Power Amplifier, Voltage Sensor) Concept: circuits Time: 30 m SW Interface: 750 Windows file: RLC.SWS EQUIPMENT NEEDED Science Workshop Interface Power Amplifier (2) Voltage
Experiment #11: LRC Circuit (Power Amplifier, Voltage Sensor) Concept: circuits Time: 30 m SW Interface: 750 Windows file: RLC.SWS EQUIPMENT NEEDED Science Workshop Interface Power Amplifier (2) Voltage
EE 1202 Experiment #4 Capacitors, Inductors, and Transient Circuits
 EE 1202 Experiment #4 Capacitors, Inductors, and Transient Circuits 1. Introduction and Goal: Exploring transient behavior due to inductors and capacitors in DC circuits; gaining experience with lab instruments.
Measuring Impedance and Frequency Response of Guitar Pickups
 Measuring Impedance and Frequency Response of Guitar Pickups Peter D. Hiscocks Syscomp Electronic Design Limited phiscock@ee.ryerson.ca www.syscompdesign.com April 30, 2011 Introduction The CircuitGear
Cathode Ray Tube. Introduction. Functional principle
 Introduction The Cathode Ray Tube or Braun s Tube was invented by the German physicist Karl Ferdinand Braun in 897 and is today used in computer monitors, TV sets and oscilloscope tubes. The path of the
OPTICAL FIBERS INTRODUCTION
 OPTICAL FIBERS References: J. Hecht: Understanding Fiber Optics, Ch. 1-3, Prentice Hall N.J. 1999 D. R. Goff: Fiber Optic Reference Guide (2 nd ed.) Focal Press 1999 Projects in Fiber Optics (Applications
= V peak 2 = 0.707V peak
 BASIC ELECTRONICS - RECTIFICATION AND FILTERING PURPOSE Suppose that you wanted to build a simple DC electronic power supply, which operated off of an AC input (e.g., something you might plug into a standard
Lab 9: The Acousto-Optic Effect
 Lab 9: The Acousto-Optic Effect Incoming Laser Beam Travelling Acoustic Wave (longitudinal wave) O A 1st order diffracted laser beam A 1 Introduction qb d O 2qb rarefractions compressions Refer to Appendix
XYZs of Oscilloscopes
 Primer XYZs of Oscilloscopes Analog Oscilloscope Delay Line Vert Amp Amp Display Trigger Horiz Amp Digital Storage Oscilloscope Amp A/D DeMux Acquisition µp Display Memory Memory Display Digital Phosphor
GENERAL SCIENCE LABORATORY 1110L Lab Experiment 6: Ohm s Law
 GENERAL SCIENCE LABORATORY 1110L Lab Experiment 6: Ohm s Law OBJECTIVES: To verify Ohm s law, the mathematical relationship among current, voltage or potential difference, and resistance, in a simple circuit.
PCM Encoding and Decoding:
 PCM Encoding and Decoding: Aim: Introduction to PCM encoding and decoding. Introduction: PCM Encoding: The input to the PCM ENCODER module is an analog message. This must be constrained to a defined bandwidth
Experiment 5. Lasers and laser mode structure
 Northeastern University, PHYS5318 Spring 2014, 1 1. Introduction Experiment 5. Lasers and laser mode structure The laser is a very important optical tool that has found widespread use in science and industry,
Experiment 8: Undriven & Driven RLC Circuits
 Experiment 8: Undriven & Driven RLC Circuits Answer these questions on a separate sheet of paper and turn them in before the lab 1. RLC Circuits Consider the circuit at left, consisting of an AC function
LAB 7 MOSFET CHARACTERISTICS AND APPLICATIONS
 LAB 7 MOSFET CHARACTERISTICS AND APPLICATIONS Objective In this experiment you will study the i-v characteristics of an MOS transistor. You will use the MOSFET as a variable resistor and as a switch. BACKGROUND
Lab Exercise 1: Acoustic Waves
 Lab Exercise 1: Acoustic Waves Contents 1-1 PRE-LAB ASSIGNMENT................. 2 1-3.1 Spreading Factor: Spherical Waves........ 2 1-3.2 Interference In 3-D................. 3 1-4 EQUIPMENT........................
The Ultimate British Valve Tester
 TEST EQUIPMENT The Ultimate British Valve Tester AVO VCM 163 by Kurt Schmid, DH3PJ To evaluate the quality of thermionic valves, ambitious valve testers (USA: tube tester) are able to diagnose a couple
Step response of an RLC series circuit
 School of Engineering Department of Electrical and Computer Engineering 332:224 Principles of Electrical Engineering II Laboratory Experiment 5 Step response of an RLC series circuit 1 Introduction Objectives
Lab #9: AC Steady State Analysis
 Theory & Introduction Lab #9: AC Steady State Analysis Goals for Lab #9 The main goal for lab 9 is to make the students familar with AC steady state analysis, db scale and the NI ELVIS frequency analyzer.
Op-Amp Simulation EE/CS 5720/6720. Read Chapter 5 in Johns & Martin before you begin this assignment.
 Op-Amp Simulation EE/CS 5720/6720 Read Chapter 5 in Johns & Martin before you begin this assignment. This assignment will take you through the simulation and basic characterization of a simple operational
Laboratory 4: Feedback and Compensation
 Laboratory 4: Feedback and Compensation To be performed during Week 9 (Oct. 20-24) and Week 10 (Oct. 27-31) Due Week 11 (Nov. 3-7) 1 Pre-Lab This Pre-Lab should be completed before attending your regular
EDEXCEL NATIONAL CERTIFICATE/DIPLOMA UNIT 5 - ELECTRICAL AND ELECTRONIC PRINCIPLES NQF LEVEL 3 OUTCOME 4 - ALTERNATING CURRENT
 EDEXCEL NATIONAL CERTIFICATE/DIPLOMA UNIT 5 - ELECTRICAL AND ELECTRONIC PRINCIPLES NQF LEVEL 3 OUTCOME 4 - ALTERNATING CURRENT 4 Understand single-phase alternating current (ac) theory Single phase AC
Precision Diode Rectifiers
 by Kenneth A. Kuhn March 21, 2013 Precision half-wave rectifiers An operational amplifier can be used to linearize a non-linear function such as the transfer function of a semiconductor diode. The classic
Frequency Response of Filters
 School of Engineering Department of Electrical and Computer Engineering 332:224 Principles of Electrical Engineering II Laboratory Experiment 2 Frequency Response of Filters 1 Introduction Objectives To
Operational Amplifier - IC 741
 Operational Amplifier - IC 741 Tabish December 2005 Aim: To study the working of an 741 operational amplifier by conducting the following experiments: (a) Input bias current measurement (b) Input offset
Germanium Diode AM Radio
 Germanium Diode AM Radio LAB 3 3.1 Introduction In this laboratory exercise you will build a germanium diode based AM (Medium Wave) radio. Earliest radios used simple diode detector circuits. The diodes
Experiment 3: Magnetic Fields of a Bar Magnet and Helmholtz Coil
 MASSACHUSETTS INSTITUTE OF TECHNOLOGY Department of Physics 8.02 Spring 2006 Experiment 3: Magnetic Fields of a Bar Magnet and Helmholtz Coil OBJECTIVES 1. To learn how to visualize magnetic field lines
E. K. A. ADVANCED PHYSICS LABORATORY PHYSICS 3081, 4051 NUCLEAR MAGNETIC RESONANCE
 E. K. A. ADVANCED PHYSICS LABORATORY PHYSICS 3081, 4051 NUCLEAR MAGNETIC RESONANCE References for Nuclear Magnetic Resonance 1. Slichter, Principles of Magnetic Resonance, Harper and Row, 1963. chapter
MATERIALS. Multisim screen shots sent to TA.
 Page 1/8 Revision 0 9-Jun-10 OBJECTIVES Learn new Multisim components and instruments. Conduct a Multisim transient analysis. Gain proficiency in the function generator and oscilloscope. MATERIALS Multisim
NUCLEAR MAGNETIC RESONANCE. Advanced Laboratory, Physics 407, University of Wisconsin Madison, Wisconsin 53706
 (revised 4/21/03) NUCLEAR MAGNETIC RESONANCE Advanced Laboratory, Physics 407, University of Wisconsin Madison, Wisconsin 53706 Abstract This experiment studies the Nuclear Magnetic Resonance of protons
Calibration and Use of a Strain-Gage-Instrumented Beam: Density Determination and Weight-Flow-Rate Measurement
 Chapter 2 Calibration and Use of a Strain-Gage-Instrumented Beam: Density Determination and Weight-Flow-Rate Measurement 2.1 Introduction and Objectives This laboratory exercise involves the static calibration
CHAPTER 11: Flip Flops
 CHAPTER 11: Flip Flops In this chapter, you will be building the part of the circuit that controls the command sequencing. The required circuit must operate the counter and the memory chip. When the teach
Modern Physics Laboratory e/m with Teltron Deflection Tube
 Modern Physics Laboratory e/m with Teltron Deflection Tube Josh Diamond & John Cummings Fall 2010 Abstract The deflection of an electron beam by electric and magnetic fields is observed, and the charge
Physics 120 Lab 6: Field Effect Transistors - Ohmic region
 Physics 120 Lab 6: Field Effect Transistors - Ohmic region The FET can be used in two extreme ways. One is as a voltage controlled resistance, in the so called "Ohmic" region, for which V DS < V GS - V
Power Supplies. 1.0 Power Supply Basics. www.learnabout-electronics.org. Module
 Module 1 www.learnabout-electronics.org Power Supplies 1.0 Power Supply Basics What you ll learn in Module 1 Section 1.0 Power Supply Basics. Basic functions of a power supply. Safety aspects of working
THE MclNTOSH MC 2100 SOLID STATE STEREO POWER AMPLIFIER
 THE MclNTOSH MC 2100 SOLID STATE STEREO POWER AMPLIFIER Price $1.25 Your MC 2100 stereo amplifier will give you many years of pleasant and satisfactory performance. If you have any questions concerning
ECEN 1400, Introduction to Analog and Digital Electronics
 ECEN 1400, Introduction to Analog and Digital Electronics Lab 4: Power supply 1 INTRODUCTION This lab will span two lab periods. In this lab, you will create the power supply that transforms the AC wall
Step Response of RC Circuits
 Step Response of RC Circuits 1. OBJECTIVES...2 2. REFERENCE...2 3. CIRCUITS...2 4. COMPONENTS AND SPECIFICATIONS...3 QUANTITY...3 DESCRIPTION...3 COMMENTS...3 5. DISCUSSION...3 5.1 SOURCE RESISTANCE...3
Annex: VISIR Remote Laboratory
 Open Learning Approach with Remote Experiments 518987-LLP-1-2011-1-ES-KA3-KA3MP Multilateral Projects UNIVERSITY OF DEUSTO Annex: VISIR Remote Laboratory OLAREX project report Olga Dziabenko, Unai Hernandez
Physics 41, Winter 1998 Lab 1 - The Current Balance. Theory
 Physics 41, Winter 1998 Lab 1 - The Current Balance Theory Consider a point at a perpendicular distance d from a long straight wire carrying a current I as shown in figure 1. If the wire is very long compared
CIRCUITS LABORATORY EXPERIMENT 3. AC Circuit Analysis
 CIRCUITS LABORATORY EXPERIMENT 3 AC Circuit Analysis 3.1 Introduction The steady-state behavior of circuits energized by sinusoidal sources is an important area of study for several reasons. First, the
1. Units of a magnetic field might be: A. C m/s B. C s/m C. C/kg D. kg/c s E. N/C m ans: D
 Chapter 28: MAGNETIC FIELDS 1 Units of a magnetic field might be: A C m/s B C s/m C C/kg D kg/c s E N/C m 2 In the formula F = q v B: A F must be perpendicular to v but not necessarily to B B F must be
ELECTRON SPIN RESONANCE Last Revised: July 2007
 QUESTION TO BE INVESTIGATED ELECTRON SPIN RESONANCE Last Revised: July 2007 How can we measure the Landé g factor for the free electron in DPPH as predicted by quantum mechanics? INTRODUCTION Electron
1.1 The 7493 consists of 4 flip-flops with J-K inputs unconnected. In a TTL chip, unconnected inputs
 CALIFORNIA STATE UNIVERSITY LOS ANGELES Department of Electrical and Computer Engineering EE-246 Digital Logic Lab EXPERIMENT 1 COUNTERS AND WAVEFORMS Text: Mano, Digital Design, 3rd & 4th Editions, Sec.
ACCELERATION DUE TO GRAVITY
 EXPERIMENT 1 PHYSICS 107 ACCELERATION DUE TO GRAVITY Skills you will learn or practice: Calculate velocity and acceleration from experimental measurements of x vs t (spark positions) Find average velocities
TV Trouble Shooting Manual
 INFORMATION SOURCE 5 TV Trouble Shooting Manual VOLUME 1 BY MASAAKI MUKAI AND RYOZO KOBAYASHI ASIAN AND PACIFIC SKILL DEVELOPMENT PROGRAMME INTERNATIONAL LABOUR OFFICE ISLAMABAD, PAKISSTAN, 1988 Appendix
Analog and Digital Signals, Time and Frequency Representation of Signals
 1 Analog and Digital Signals, Time and Frequency Representation of Signals Required reading: Garcia 3.1, 3.2 CSE 3213, Fall 2010 Instructor: N. Vlajic 2 Data vs. Signal Analog vs. Digital Analog Signals
More Op-Amp Circuits; Temperature Sensing
 ECE 2A Lab #5 Lab 5 More OpAmp Circuits; Temperature Sensing Overview In this lab we will continue our exploration of opamps but this time in the context of a specific application: temperature sensing.
EDD-600 FLOW TOTALIZER RATE INDICATOR OPERATION MANUAL. P.O. Box 12128 Odessa, Texas 79768 USA. E-mail rkw@eddevices.com.
 OPERATION MANUAL EDD-600 FLOW TOTALIZER RATE INDICATOR Phone 432-366-8699 Fax 432-366-1106 P.O. Box 12128 Odessa, Texas 79768 USA E-mail rkw@eddevices.com Website www.eddevices.com 3 EDD-600 Digital Battery
UT4000. Series USER MANUAL. Digital Storage Oscilloscope
 UT4000 Series USER MANUAL Digital Storage Oscilloscope UT4000 Series Digital Storage Oscilloscope User Manual General Safety Rules This unit is designed and manufactured strictly in accordance with GB4793
APPLICATION NOTE ULTRASONIC CERAMIC TRANSDUCERS
 APPLICATION NOTE ULTRASONIC CERAMIC TRANSDUCERS Selection and use of Ultrasonic Ceramic Transducers The purpose of this application note is to aid the user in the selection and application of the Ultrasonic
Experiment 3: Magnetic Fields of a Bar Magnet and Helmholtz Coil
 MASSACHUSETTS INSTITUTE OF TECHNOLOGY Department of Physics 8.02 Spring 2009 Experiment 3: Magnetic Fields of a Bar Magnet and Helmholtz Coil OBJECTIVES 1. To learn how to visualize magnetic field lines
Scaling and Biasing Analog Signals
 Scaling and Biasing Analog Signals November 2007 Introduction Scaling and biasing the range and offset of analog signals is a useful skill for working with a variety of electronics. Not only can it interface
Unit2: Resistor/Capacitor-Filters
 Unit2: Resistor/Capacitor-Filters Physics335 Student October 3, 27 Physics 335-Section Professor J. Hobbs Partner: Physics335 Student2 Abstract Basic RC-filters were constructed and properties such as
EE101 Labs and ECEbot Assembly/Testing Instructions
 EE101 Labs and ECEbot Assembly/Testing Instructions by Montana State University Department of Electrical and Computer Engineering A Montana Space Grant Consortium Project December 3, 2008 Beginning in
AC Direct Off-Line Power Supplies
 AC Direct Off-Line Power Supplies r Introduction Many DC power supplies found in electronic systems, including those in this Tech School, rectify the 120 volts available at an electric outlet. The initial
DSO-1062D/DSO-1102D/DSO-1202D different bandwidths. Digital Oscilloscope User Manual
 DSO-1062D/DSO-1102D/DSO-1202D different bandwidths Digital Oscilloscope User Manual Contents Contents Contents... i Copyright Declaration... iv Chapter 1 Safety Tips... 1 1.1 General Safety Summary...
Lab 3 Rectifier Circuits
 ECET 242 Electronic Circuits Lab 3 Rectifier Circuits Page 1 of 5 Name: Objective: Students successfully completing this lab exercise will accomplish the following objectives: 1. Learn how to construct
ANALYTICAL METHODS FOR ENGINEERS
 UNIT 1: Unit code: QCF Level: 4 Credit value: 15 ANALYTICAL METHODS FOR ENGINEERS A/601/1401 OUTCOME - TRIGONOMETRIC METHODS TUTORIAL 1 SINUSOIDAL FUNCTION Be able to analyse and model engineering situations
Constructing a precision SWR meter and antenna analyzer. Mike Brink HNF, Design Technologist.
 Constructing a precision SWR meter and antenna analyzer. Mike Brink HNF, Design Technologist. Abstract. I have been asked to put together a detailed article on a SWR meter. In this article I will deal
Interference. Physics 102 Workshop #3. General Instructions
 Interference Physics 102 Workshop #3 Name: Lab Partner(s): Instructor: Time of Workshop: General Instructions Workshop exercises are to be carried out in groups of three. One report per group is due by