Post-processing with Paraview. R. Ponzini, CINECA -SCAI
|
|
|
- Clifford Jordan
- 9 years ago
- Views:
Transcription

1 Post-processing with Paraview R. Ponzini, CINECA -SCAI
2 Post-processing with Paraview: Overall Program Post-processing with Paraview I (ParaView GUI and Filters) Post-processing with Paraview II (ParaView scripting with hands-on) Post-processing with Paraview III (ParaView for large data visualization)
3 OUTLINE PART A What is Paraview The GUI Sources Loading Data Text annotation Views management Save figures PART B Filters Vectors visualization Streamlines Plotting over line Select data Create a custom filter Animations Time dependent data
4 What is Paraview ParaView is an open-source application for visualizing 2D/3D data. To date, ParaView has been demonstrated to process billions of unstructured cells and to process over a trillion structured cells. ParaView's parallel framework has run on over 100,000 processing cores. ParaView's key features are: An open-source, scalable, multi-platform visualization application. Support for distributed computation models to process large data sets. An open, extensible, and intuitive user interface. An extensible, modular architecture based on open standards. A flexible BSD 3-clause license. Commercial maintenance and support.
5 PARAVIEW: a standard de-facto ParaView is used by many academic, government, and commercial institutions all over the world. ParaView is downloaded roughly 100,000 times every year. ParaView also won the HPCwire Readers' Choice Award and HPCwire Editors' Choice Award for Best HPC Visualization Product or Technology.
6 Obtaining Paraview & Official Resources Main website: Download page: Resources (video): Resources (wiki):

7 The big picture The application most people associate with ParaView is really just a small client application built on top of a tall stack of libraries that provide ParaView with its functionality. ParaView comes with a pvpython application that allows you to automate the visualization and post-processing with Python scripting. A ParaView Server library provides the abstraction layer necessary for running parallel, interactive visualization. It relieves the client application from most of the issues concerning if and how ParaView is running in parallel. The Visualization Toolkit (VTK) provides the basic visualization and rendering algorithms.
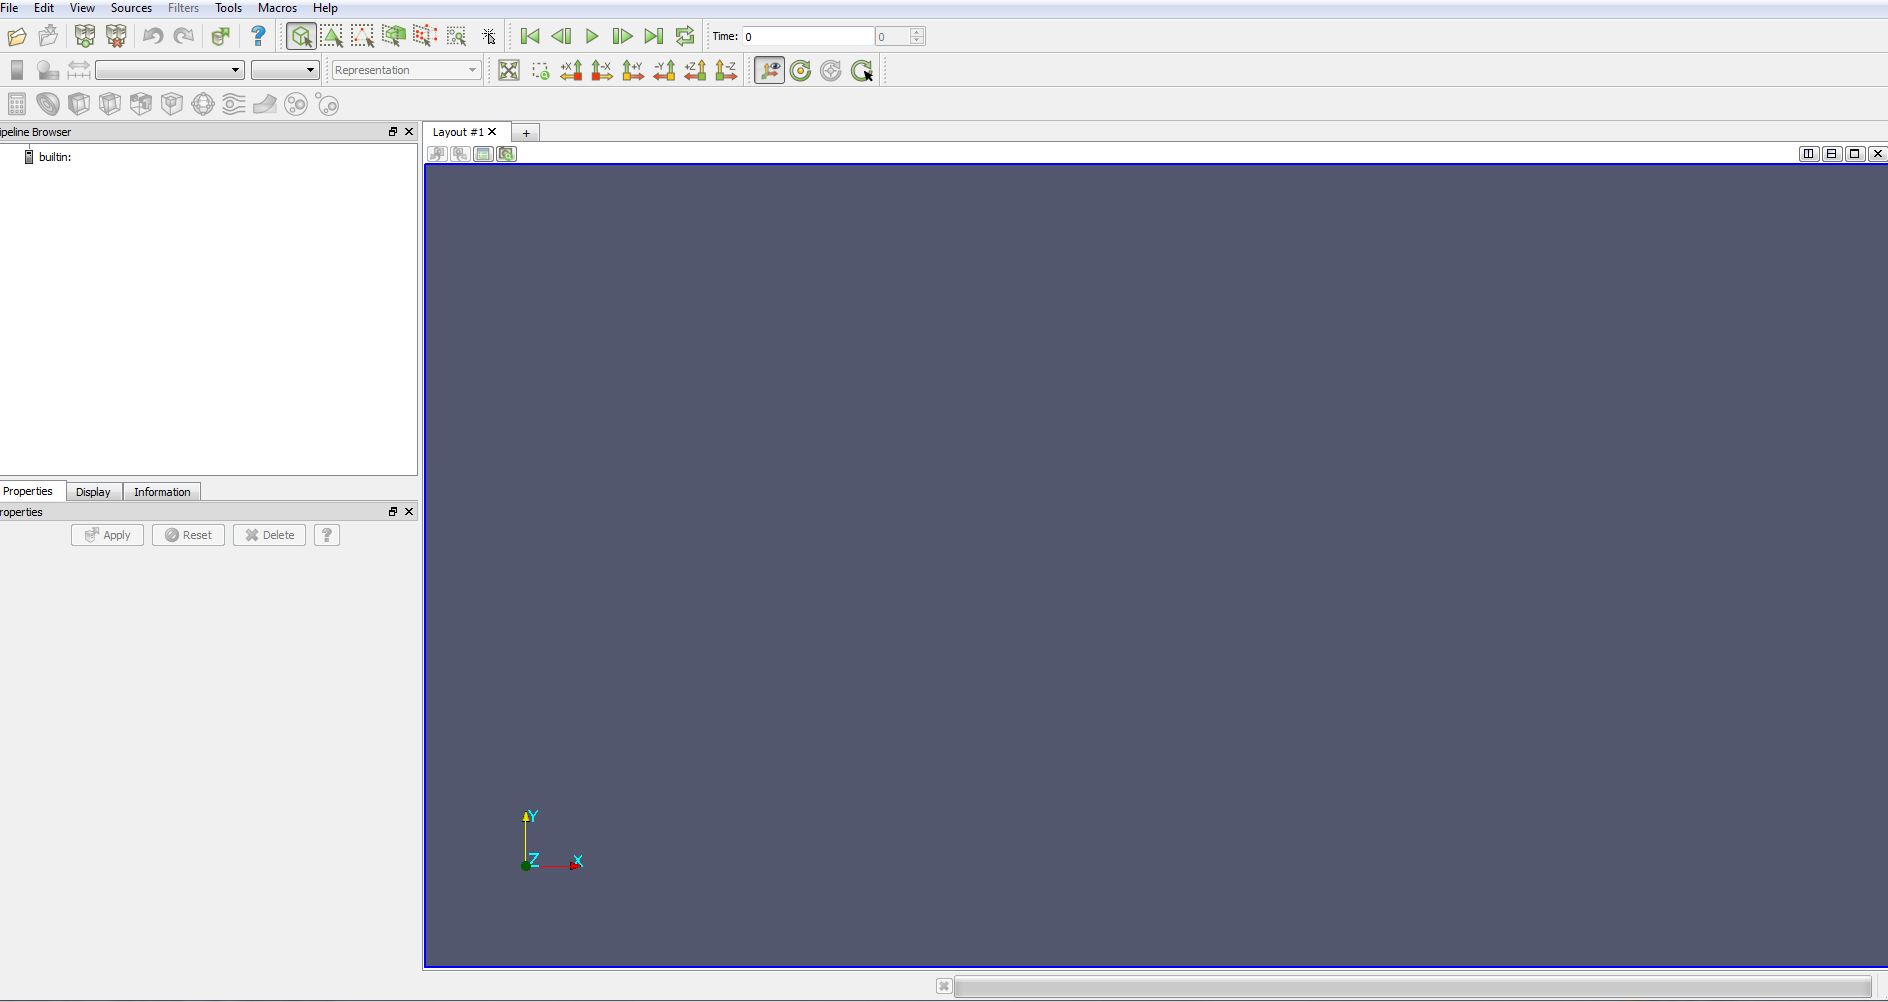
8 GUI
9 GUI elements Menu Bar Toolbars Pipeline Browser (we will look at this later on) Properties Panel 3D View
10 GUI elements definition Menu Bar As with just about any other program, the menu bar allows you to access the majority of features. Toolbars The toolbars provide quick access to the most commonly used features within ParaView. Pipeline Browser ParaView manages the reading and ltering of data with a pipeline. The pipeline browser allows you to view the pipeline structure and select pipeline objects. The pipeline browser provides a convenient list of pipeline objects with an indentation style that shows the pipeline structure. Properties Panel The properties panel allows you to view and change the parameters of the current pipeline object. The properties are by default coupled with an Information tab that shows a basic summary of the data produced by the pipeline object. 3D View The remainder of the GUI is used to present data so that you may view, interact with, and explore your data. This area is initially populated with a 3D view that will provide a geometric representation of the data.
11 /Menu-bar/help (!)
12 The GUI is customizable so that toolbars can be displayed or hidden when needed. Personalize your GUI
.")
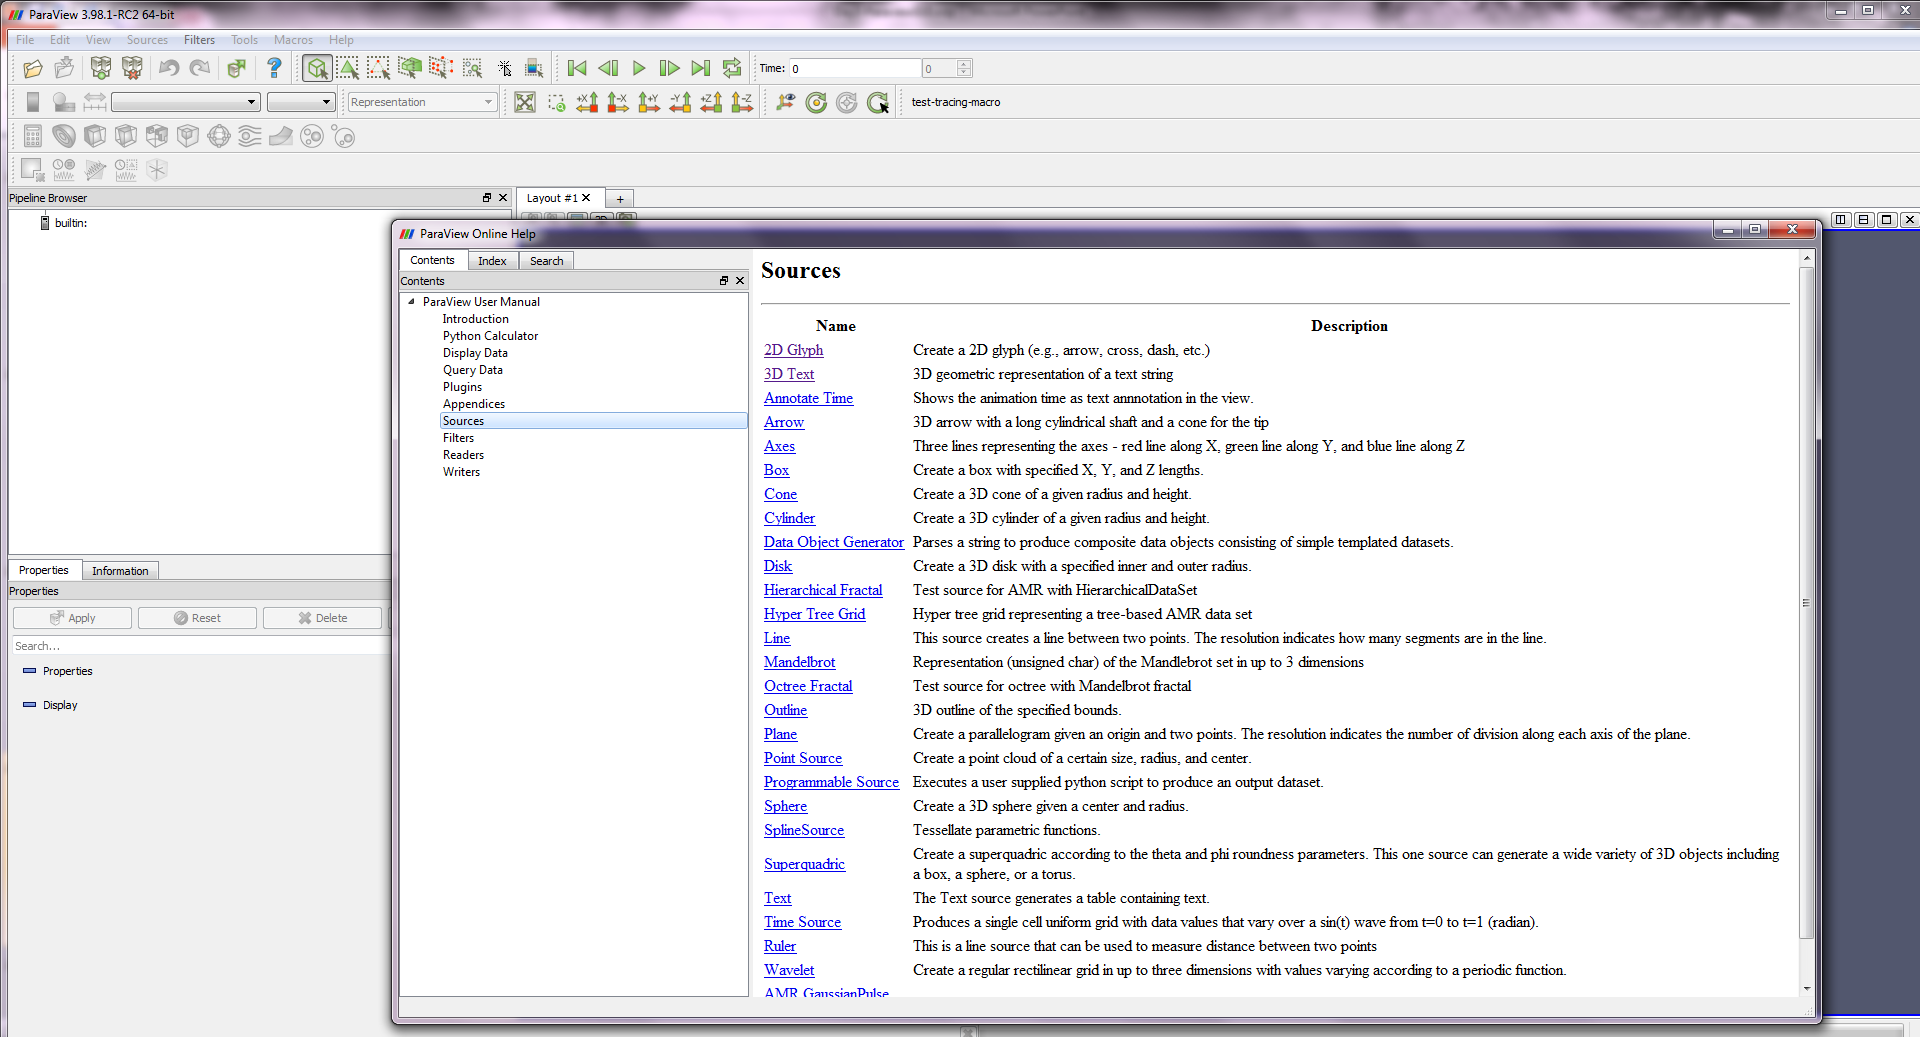
13 Sources Data can be uploaded into ParaView 3D scene using VTK source objects or loading files (readers).
14 Sources
15 3D objects manipulations Test the usage of your mouse buttons: Left button: rotation Right button: panning Middle button: zooming
16 Camera control basics Set camera location Set zoom Set view on/off for axis and center of rotation
17 Change center of rotation
18 Apply/Reset Undo/Redo Apply: click on the apply button to sync your data state.(automatic apply of changes button ) Reset: click this button to restore the default configuration state. Undo: go back to the previous state Redo: return to the state you changed back Camera Undo: same as above but for camera views changes Camera Redo: same as above but for camera views changes

19 Main objects menu Properties Informations Display
20 Change object properties
21 Display Play with different display options for this object.
22 Text annotation
23 Views Management

24 Save figure
25 Loading data ParaView Data (.pvd) VTK (.vtp,.vtu,.vti,.vts,.vtr) VTK Legacy (.vtk) VTK Multi Block (.vtm,.vtmb,.vtmg,.vthd,.vthb) Partitioned VTK (.pvtu,.pvti,.pvts,.pvtr) ADAPT (.nc,.cdf,.elev,.ncd) ANALYZE (.img,.hdr) ANSYS (.inp) AVS UCD (.inp) BOV (.bov) BYU (.g) CAM NetCDF (.nc,.ncdf) CCSM MTSD (.nc,.cdf,.elev,.ncd) CCSM STSD (.nc,.cdf,.elev,.ncd) CEAucd (.ucd,.inp) CMAT (.cmat) CML (.cml) CTRL (.ctrl) Chombo (.hdf5,.h5) Claw (.claw) Comma Separated Values (.csv) Cosmology Files (.cosmo,.gad-get2) Curve2D (.curve,.ultra,.ult,.u) DDCMD (.ddcmd) Digital Elevation Map (.dem) Dyna3D(.dyn) EnSight (.case,.sos) Enzo boundary and hierarchy ExodusII (.g,.e,.exe,.ex2,.ex2v.., etc) ExtrudedVol (.exvol) FVCOM (MTMD, MTSD, Particle, STSD) Facet Polygonal Data Flash multiblock les Fluent Case Files (.cas) GGCM (.3df,.mer) GTC (.h5) GULP (.trg) Gadget (.gadget) Gaussian Cube File (.cube) JPEG Image (.jpg,.jpeg) LAMPPS Dump (.dump) LAMPPS Structure Files LODI (.nc,.cdf,.elev,.ncd) LODI Particle (.nc,.cdf,.elev,.ncd) LS-DYNA (.k,.lsdyna,.d3plot,d3plot) M3DCl (.h5) MFIX Unstructred Grid (.RES) MM5 (.mm5) MPAS NetCDF (.nc,.ncdf) Meta Image (.mhd,.mha) Miranda (.mir,.raw) Multilevel 3d Plasma (.m3d,.h5) SAMRAI (.samrai) SAR (.SAR,.sar) SAS (.sasgeom,.sas,.sasdata) SESAME Tables SLAC netcdf mesh and mode data SLAC netcdf particle data Silo (.silo,.pdb) Spheral (.spheral,.sv) SpyPlot CTH SpyPlot Case (.case) SpyPlot History (.hscth) Stereo Lithography (.stl) TFT Files TIFF Image Files TSurf Files Tecplot ASCII (.tec,.tp) Tecplot Binary (.plt) Tetrad (.hdf5,.h5) UNIC (.h5) VASP CHGCA (.CHG) VASP OUT (.OUT) VASP POSTCAR (.POS) VPIC (.vpc) VRML (.wrl) Velodyne (.vld,.rst) VizSchema (.h5,.vsh5) Wavefront Polygonal Data (.obj) WindBlade (.wind) XDMF and hdf5 (.xmf,.xdmf) XMol Molecule NASTRAN (.nas,.f06) Nek5000 Files Nrrd Raw Image (.nrrd,.nhdr) OpenFOAM Files (.foam) PATRAN (.neu) PFLOTRAN (.h5) PLOT2D (.p2d) PLOT3D (.xyz,.q,.x,.vp3d) PLY Polygonal File Format PNG Image Files POP Ocean Files ParaDIS Files Phasta Files (.pht) Pixie Files (.h5) ProSTAR (.cel,.vrt) Protein Data Bank (.pdb,.ent,.pdb) Raw Image Files Raw NRRD image les (.nrrd)
26 Loading your data (no filtering) Load the data file provided for the school. Inspect available variables and ranges. Adjust view and display settings as learned above. Adjust representation and coloring Adjust text and legend
27 U field Select surface view + U magnitude Scale the data range Show label and colorbar Add a text to your scene and manage Change legend dimensions, format, position and range Save an image
28 END OF PART A
29 Filters Calculator Evaluates a user-defined expression on a per-point or per-cell basis. Contour Extracts the points, curves, or surfaces where a scalar field is equal to a user-defined value. This surface is often also called an iso-surface. Clip Intersects the geometry with a half space. The effect is to remove all the geometry on one side of a user-defined plane. Slice Intersects the geometry with a plane. The effect is similar to clipping except that all that remains is the geometry where the plane is located. Threshold Extracts cells that lie within a specified range of a scalar-field. Extract Subset Extracts a subset of a grid by defining either a volume of interest or a sampling rate. Glyph Places a glyph, a simple shape, on each point in a mesh. The glyphs may be oriented by a vector and scaled by a vector or scalar. Stream Tracer Seeds a vector field with points and then traces those seed points through the (steady state) vector field. Warp (vector) Displaces each point in a mesh by a given vector field. Group Datasets Combines the output of several pipeline objects into a single multi-block data set. Extract Level Extract one or more items from a multi block data set.
30 Other Filters Recent The list of most recently used filters sorted with the most recently used filters on top. AMR A set of filters designed specifically for data in an adaptive mesh refinement (AMR) structure. CTH Filters used to process results from a CTH simulation. Common The most common filters. This is the same list of filters available in the filters toolbar and listed previously. Cosmology This contains filters developed at LANL for cosmology research. Data Analysis The filters designed to retrieve quantitative values from the data. These filters compute data on the mesh, extract elements from the mesh, or plot data. Material Analysis Filters for processing data from volume fractions of materials. Statistics This contains filters that provide descriptive statistics of data, primarily in tabular form. Temporal Filters that analyze or modify data that changes over time. All filters can work on data that changes over time because they are executed on each time snapshot. However, filters in this category will introspect the available time extents and examine how data changes over time. Alphabetical An alphabetical listing of all the filters available. If you are not sure where to find a particular filter, this list is guaranteed to have it. There are also many filters that are not listed anywhere but in this list.

31 Other Filters
32 Other customized filters
33 Working with filters over data Perform basic filtering on the data provided for the school Slicing Iso-surface Extract surface Clipping Vectors Streamlines
34 Vectors Visualization Select filter for 3d vectors Select a slice normal to z axis Select 2d vectors on the slice Modify vectors aspects
35 Streamlines Insert streamlines by line Change stream properties Color by rotation Enhance streams using tubes
36 Plotting
37 Multiple views 3d + 3d 3d + 2d 3d + table

38 Data selection/saving Select your data Save as csv

39 Save a pipeline as a scene Save the obtained pipeline a PV scene for future processing by loading the scene back into ParaView.
40 Build and use a new filter from a pipeline Create a custom filter by grouping a pipeline Save the filter Close and re-load your custom filter
41 Hands-on 1 Load the data provided for the tutorial Process the data to obtain: Slice info Contour plot Warp on scalar 2d lineplot Animate over time Save the animation
42 Load the data provided for the tutorial Process the data to obtain: Smaller dataset to process Contour plot of iso-q Extract the isosurface Smooth Save the surface for future visualization Color by velocity or pressure or both and compare Build a filter that will do all the work in a single click Add text and colorbar Save meaningful Hands on 2
Visualization Needs. Joseph A. Insley. Mira Performance Boot Camp May 20, 2015
 Your Data Analysis & Visualization Needs Joseph A. Insley Mira Performance Boot Camp May 20, 2015 Tukey- High Performance Visualization Cluster 96 AMD Dual Opteron 6128 Compute Nodes 16 total CPU cores
Visualization with ParaView
 Visualization with ParaView Before we begin Make sure you have ParaView 4.1.0 installed so you can follow along in the lab section http://paraview.org/paraview/resources/software.php Background http://www.paraview.org/
Visualization with ParaView. Greg Johnson
 Visualization with Greg Johnson Before we begin Make sure you have 3.8.0 installed so you can follow along in the lab section http://paraview.org/paraview/resources/software.html http://www.paraview.org/
Why are we teaching you VisIt?
 VisIt Tutorial Why are we teaching you VisIt? Interactive (GUI) Visualization and Analysis tool Multiplatform, Free and Open Source The interface looks the same whether you run locally or remotely, serial
Introduction to Paraview. H.D.Rajesh
 Introduction to Paraview H.D.Rajesh 1.Introduction 2.file formats 3.How to use Brief Overview Info: www.paraview.org http://www.paraview.org/wiki/paraview Open source,multi-platform application (Linux,
Introduction to Visualization with VTK and ParaView
 Introduction to Visualization with VTK and ParaView R. Sungkorn and J. Derksen Department of Chemical and Materials Engineering University of Alberta Canada August 24, 2011 / LBM Workshop 1 Introduction
VisIt Visualization Tool
 The Center for Astrophysical Thermonuclear Flashes VisIt Visualization Tool Randy Hudson [email protected] Argonne National Laboratory Flash Center, University of Chicago An Advanced Simulation and Computing
MayaVi: A free tool for CFD data visualization
 MayaVi: A free tool for CFD data visualization Prabhu Ramachandran Graduate Student, Dept. Aerospace Engg. IIT Madras, Chennai, 600 036. e mail: [email protected] Keywords: Visualization, CFD data,
OpenFOAM postprocessing and advanced running options
 OpenFOAM postprocessing and advanced running options Tommaso Lucchini Department of Energy Politecnico di Milano The post processing tool: parafoam The main post-processing tool provided with OpenFOAM
Visualization Plugin for ParaView
 Alexey I. Baranov Visualization Plugin for ParaView version 1.3 Springer Contents 1 Visualization with ParaView..................................... 1 1.1 ParaView plugin installation.................................
UCRL-SM-220449. VisIt User s Manual. October 2005. Version 1.5. Laboratory. National. Lawrence Livermore
 UCRL-SM-220449 VisIt User s Manual October 2005 Version 1.5 Lawrence Livermore National Laboratory ii DISCLAIMER This document was prepared as an account of work sponsored by an agency of the United States
Processing Data with rsmap3d Software Services Group Advanced Photon Source Argonne National Laboratory
 Processing Data with rsmap3d Software Services Group Advanced Photon Source Argonne National Laboratory Introduction rsmap3d is an application for producing 3D reciprocal space maps from x-ray diffraction
Visualization of Adaptive Mesh Refinement Data with VisIt
 Visualization of Adaptive Mesh Refinement Data with VisIt Gunther H. Weber Lawrence Berkeley National Laboratory VisIt Richly featured visualization and analysis tool for large data sets Built for five
Scientific Visualization with ParaView
 Scientific Visualization with ParaView Geilo Winter School 2016 Andrea Brambilla (GEXCON AS, Bergen) Outline Part 1 (Monday) Fundamentals Data Filtering Part 2 (Tuesday) Time Dependent Data Selection &
f o r d e m a n d i n g C F D pre- & post-processing ANSA μετα p i o n e e r i n g software systems www.beta-cae.gr
 ANSA μετα p i o n e e r i n g software systems f o r d e m a n d i n g C F D pre- & post-processing TM www.beta-cae.gr ANSA with its powerful functionality provides high efficiency solutions for CFD applications.
Avizo AvizoFire - The 3D visualization Software for NDT & Materials Science
 Avizo AvizoFire - The 3D visualization Software for NDT & Materials Science Peter Westenberger Application Enginieer May 7, 2010 Avizo Visualize to Understand Avizo software is a powerful, multifaceted
Cassandra 2.0: Tutorial
 Cassandra 2.0 Tutorial V1.0 Sébastien Jourdain, Fatiha Zeghir 2005/06/01 1 / 16 Abstract Cassandra is a generic VTK data viewer written in Java which provides native multiplatform support. Cassandra is
version 3.0 tutorial - Turbulent mixing in a T-junction with CFDSTUDY in SALOME contact: [email protected]
 EDF R&D Fluid Dynamics, Power Generation and Environment Department Single Phase Thermal-Hydraulics Group 6, quai Watier F-78401 Chatou Cedex Tel: 33 1 30 87 75 40 Fax: 33 1 30 87 79 16 MAY 2013 documentation
Open Source CFD Solver - OpenFOAM
 Open Source CFD Solver - OpenFOAM Wang Junhong (HPC, Computer Centre) 1. INTRODUCTION The OpenFOAM (Open Field Operation and Manipulation) Computational Fluid Dynamics (CFD) Toolbox is a free, open source
CATIA: Navigating the CATIA V5 environment. D. CHABLAT / S. CARO [email protected]
 CATIA: Navigating the CATIA V5 environment D. CHABLAT / S. CARO [email protected] Standard Screen Layout 5 4 6 7 1 2 3 8 9 10 11 12 13 14 15 D. Chablat / S. Caro -- Institut de Recherche
ParaView s Comparative Viewing, XY Plot, Spreadsheet View, Matrix View
 ParaView s Comparative Viewing, XY Plot, Spreadsheet View, Matrix View Dublin, March 2013 Jean M. Favre, CSCS Motivational movie Supercomputing 2011 Movie Gallery Accepted at Supercomputing 11 Visualization
Facts about Visualization Pipelines, applicable to VisIt and ParaView
 Facts about Visualization Pipelines, applicable to VisIt and ParaView March 2013 Jean M. Favre, CSCS Agenda Visualization pipelines Motivation by examples VTK Data Streaming Visualization Pipelines: Introduction
RVA: RESERVOIR VISUALIZATION AND ANALYSIS
 RVA: RESERVOIR VISUALIZATION AND ANALYSIS USER MANUAL Beta 0.1.0 D. Keefer, D. Torridi, J. Duggirala Copyright 2011, University of Illinois at Urbana Champaign (UIUC). All Rights Reserved. 1 CONTENTS About...
How is EnSight Uniquely Suited to FLOW-3D Data?
 How is EnSight Uniquely Suited to FLOW-3D Data? July 5, 2011 figure 1. FLOW-3D model of Dam visualized with EnSight If you would like to know how CEI s EnSight offers you more power than other postprocessors
A Guide to the free mesh program Discretizer with OpenFOAM for CFD (Computational Fluid Dynamics)
") Discretizer Manual Release date 09/01/10 Side 1 of 13 A Guide to the free mesh program Discretizer with OpenFOAM for CFD (Computational Fluid Dynamics) Homepage: http://www.discretizer.org/ Creator of
Discretizer Manual Release date 09/01/10 Side 1 of 13 A Guide to the free mesh program Discretizer with OpenFOAM for CFD (Computational Fluid Dynamics) Homepage: http://www.discretizer.org/ Creator of
James Ahrens, Berk Geveci, Charles Law. Technical Report
 LA-UR-03-1560 Approved for public release; distribution is unlimited. Title: ParaView: An End-User Tool for Large Data Visualization Author(s): James Ahrens, Berk Geveci, Charles Law Submitted to: Technical
Post-processing and Visualization with Open-Source Tools. Journée Scientifique Centre Image April 9, 2015 - Julien Jomier
 Post-processing and Visualization with Open-Source Tools Journée Scientifique Centre Image April 9, 2015 - Julien Jomier Kitware - Leader in Open Source Software for Scientific Computing Software Development
Scientific Visualization with Open Source Tools. HM 2014 Julien Jomier [email protected]
 Scientific Visualization with Open Source Tools HM 2014 Julien Jomier [email protected] Visualization is Communication Challenges of Visualization Challenges of Visualization Heterogeneous data
VisIVO, a VO-Enabled tool for Scientific Visualization and Data Analysis: Overview and Demo
 Claudio Gheller (CINECA), Marco Comparato (OACt), Ugo Becciani (OACt) VisIVO, a VO-Enabled tool for Scientific Visualization and Data Analysis: Overview and Demo VisIVO: Visualization Interface for the
Parallel Large-Scale Visualization
 Parallel Large-Scale Visualization Aaron Birkland Cornell Center for Advanced Computing Data Analysis on Ranger January 2012 Parallel Visualization Why? Performance Processing may be too slow on one CPU
Visualization and Post Processing of OpenFOAM results a Brie. a Brief Introduction to VTK
 Visualization and Post Processing of OpenFOAM results a Brief Introduction to VTK December 13:th 2007 OpenFOAM Introdutory Course Chalmers University of Technology Post Processing in OF No built in post
Latin American and Caribbean Flood and Drought Monitor Tutorial Last Updated: November 2014
 Latin American and Caribbean Flood and Drought Monitor Tutorial Last Updated: November 2014 Introduction: This tutorial examines the main features of the Latin American and Caribbean Flood and Drought
Getting Started with ANSYS ANSYS Workbench Environment
 Getting Started with ANSYS ANSYS Workbench Environment Overview The purpose of this tutorial is to get you started with the ANSYS Workbench environment. We will use a simple, static analysis of a single
ANSA. www.beta-cae.gr. ANSA for demanding CFD pre-processing. for demanding CFD pre-processing. Model setup. software systems. Morphing & optimization
 Model setup - Specification of boundary condition types for ANSYS FLUENT, Star CD/CCM+ and UH-3D. - Complete solution setup for OpenFOAM cases, including initial and boundary condition specification, physical
Steady Flow: Laminar and Turbulent in an S-Bend
 STAR-CCM+ User Guide 6663 Steady Flow: Laminar and Turbulent in an S-Bend This tutorial demonstrates the flow of an incompressible gas through an s-bend of constant diameter (2 cm), for both laminar and
DataPA OpenAnalytics End User Training
 DataPA OpenAnalytics End User Training DataPA End User Training Lesson 1 Course Overview DataPA Chapter 1 Course Overview Introduction This course covers the skills required to use DataPA OpenAnalytics
Getting Started with EnSight 10.0
 Getting Started with EnSight 10.0 Computational Engineering International, Inc. 2166 N. Salem Street, Suite 101, Apex, NC 27523 USA 919-363-0883 919-363-0833 FAX http://www.ceisoftware.com Copyright 1994-2012,
Scientific Graphing in Excel 2010
 Scientific Graphing in Excel 2010 When you start Excel, you will see the screen below. Various parts of the display are labelled in red, with arrows, to define the terms used in the remainder of this overview.
Advanced visualization with VisNow platform Case study #3 Vector data visualization
 Advanced visualization with VisNow platform Case study #3 Vector data visualization This work is licensed under a Creative Commons Attribution- NonCommercial-NoDerivatives 4.0 International License. Vector
Microsoft PowerPoint Tutorial
 Microsoft PowerPoint Tutorial Contents Starting MS PowerPoint... 1 The MS PowerPoint Window... 2 Title Bar...2 Office Button...3 Saving Your Work... 3 For the first time... 3 While you work... 3 Backing
MicroStrategy Analytics Express User Guide
 MicroStrategy Analytics Express User Guide Analyzing Data with MicroStrategy Analytics Express Version: 4.0 Document Number: 09770040 CONTENTS 1. Getting Started with MicroStrategy Analytics Express Introduction...
Creating Your Own 3D Models
 14 Creating Your Own 3D Models DAZ 3D has an extensive growing library of 3D models, but there are times that you may not find what you want or you may just want to create your own model. In either case
Zhenping Liu *, Yao Liang * Virginia Polytechnic Institute and State University. Xu Liang ** University of California, Berkeley
 P1.1 AN INTEGRATED DATA MANAGEMENT, RETRIEVAL AND VISUALIZATION SYSTEM FOR EARTH SCIENCE DATASETS Zhenping Liu *, Yao Liang * Virginia Polytechnic Institute and State University Xu Liang ** University
Visualisatie BMT. Introduction, visualization, visualization pipeline. Arjan Kok Huub van de Wetering ([email protected])
") Visualisatie BMT Introduction, visualization, visualization pipeline Arjan Kok Huub van de Wetering ([email protected]) 1 Lecture overview Goal Summary Study material What is visualization Examples
Visualisatie BMT Introduction, visualization, visualization pipeline Arjan Kok Huub van de Wetering ([email protected]) 1 Lecture overview Goal Summary Study material What is visualization Examples
MicroStrategy Desktop
 MicroStrategy Desktop Quick Start Guide MicroStrategy Desktop is designed to enable business professionals like you to explore data, simply and without needing direct support from IT. 1 Import data from
Avizo for FEI Systems 9.1.1 3D Analysis Software for Scientific and Industrial Data
 RELEASE NOTES - AVIZO FOR FEI SYSTEMS 9.1.1, MAY 2016 Avizo for FEI Systems 9.1.1 3D Analysis Software for Scientific and Industrial Data Dear Avizo User, With this document we would like to inform you
MET 306. Activity 8a. Mechanism Design Creo 2.0 Level 7 POINT A GROUND LINK LINK 1 LINK 2 LINK 3 POINT B 10/15/2010 1
 Mechanism Design Creo 2.0 Level 7 POINT A LINK 1 GROUND LINK LINK 2 LINK 3 POINT B 10/15/2010 1 Download parts ground, key, link_1, link_2, link_3 and pulley from the V:/MET_306/Activity_8_Creo drive.
ANSYS CFD-Post Standalone: Tutorials
 ANSYS CFD-Post Standalone: Tutorials ANSYS, Inc. Release 12.1 Southpointe November 2009 275 Technology Drive ANSYS, Inc. is Canonsburg, PA 15317 certified to ISO [email protected] 9001:2008. http://www.ansys.com
Visualization with Excel Tools and Microsoft Azure
 Visualization with Excel Tools and Microsoft Azure Introduction Power Query and Power Map are add-ins that are available as free downloads from Microsoft to enhance the data access and data visualization
Tutorial 2 Online and offline Ship Visualization tool Table of Contents
 Tutorial 2 Online and offline Ship Visualization tool Table of Contents 1.Tutorial objective...2 1.1.Standard that will be used over this document...2 2. The online tool...2 2.1.View all records...3 2.2.Search
Cricut Design Space Reference Guide & Glossary
 Cricut Design Space Reference Guide & Glossary Top Menu Bar Grid On/Off button Panel Menu Side Menu Bar 1 Cricut logo click the Cricut logo at any time to return to the Cricut Design Space landing page.
HPC & Visualization. Visualization and High-Performance Computing
 HPC & Visualization Visualization and High-Performance Computing Visualization is a critical step in gaining in-depth insight into research problems, empowering understanding that is not possible with
VisIt: A Tool for Visualizing and Analyzing Very Large Data. Hank Childs, Lawrence Berkeley National Laboratory December 13, 2010
 VisIt: A Tool for Visualizing and Analyzing Very Large Data Hank Childs, Lawrence Berkeley National Laboratory December 13, 2010 VisIt is an open source, richly featured, turn-key application for large
OpenFOAM Opensource and CFD
 OpenFOAM Opensource and CFD Andrew King Department of Mechanical Engineering Curtin University Outline What is Opensource Software OpenFOAM Overview Utilities, Libraries and Solvers Data Formats The CFD
ANSYS CFD-Post Tutorials
 ANSYS CFD-Post Tutorials ANSYS, Inc. Southpointe 275 Technology Drive Canonsburg, PA 15317 [email protected] http://www.ansys.com (T) 724-746-3304 (F) 724-514-9494 Release 15.0 November 2013 ANSYS, Inc.
An Introduction to Open Source Geospatial Tools
 An Introduction to Open Source Geospatial Tools by Tyler Mitchell, author of Web Mapping Illustrated GRSS would like to thank Mr. Mitchell for this tutorial. Geospatial technologies come in many forms,
 First Prev Next Last MayaVi: A Free Tool for 3D/2D Data Visualization Prabhu Ramachandran October, 25, 2002 Abstract MayaVi (http://mayavi.sf.net) is an easy to use tool for interactive 3D/2D data visualization
SketchUp Instructions
 SketchUp Instructions Every architect needs to know how to use SketchUp! SketchUp is free from Google just Google it and download to your computer. You can do just about anything with it, but it is especially
STATGRAPHICS Online. Statistical Analysis and Data Visualization System. Revised 6/21/2012. Copyright 2012 by StatPoint Technologies, Inc.
 STATGRAPHICS Online Statistical Analysis and Data Visualization System Revised 6/21/2012 Copyright 2012 by StatPoint Technologies, Inc. All rights reserved. Table of Contents Introduction... 1 Chapter
A QUICK OVERVIEW OF THE OMNeT++ IDE
 Introduction A QUICK OVERVIEW OF THE OMNeT++ IDE The OMNeT++ 4.x Integrated Development Environment is based on the Eclipse platform, and extends it with new editors, views, wizards, and additional functionality.
Feature Comparison of PTC Creo View MCAD. Product Suite. Topic Sheet. Page 1 of 6 Feature Comparison of PTC Creo View MCAD Product Suite
 Comparison of Product Suite User Interface Lite Microsoft Fluent paradigm Ribbon User Interface User interface customization Command finder Usage Standalone version Interoperability with PTC Products Performance
This tutorial provides a recipe for simulating L
 Pipe Flow Tutorial for STAR-CCM+ ME 448/548 February 5, 2014 Gerald Recktenwald [email protected] 1 Overview This tutorial provides a recipe for simulating laminar flow in a pipe with STAR- L CCM+. The
Geocortex HTML 5 Viewer Manual
 1 FAQ Nothing Happens When I Print? How Do I Search? How Do I Find Feature Information? How Do I Print? How can I Email A Map? How Do I See the Legend? How Do I Find the Coordinates of a Location? How
Adobe Certified Expert Program
 Adobe Certified Expert Program Product Proficiency Exam Bulletin Adobe Photoshop CS4 Exam # 9A0-094 ACE Certification Checklist The checklist below will help guide you through the process of obtaining
IT 386: 3D Modeling and Animation. Review Sheet. Notes from Professor Nersesian s IT 386: 3D Modeling and Animation course
 IT 386: 3D Modeling and Animation Review Sheet Sources: Notes from Professor Nersesian s IT 386: 3D Modeling and Animation course Notes from CannedMushrooms on YouTube Notes from Digital Tutors tutorial
Anime Studio Debut vs. Pro
 vs. Animation Length 2 minutes (3000 frames) Unlimited Motion Tracking 3 Points Unlimited Audio Tracks 2 Tracks Unlimited Video Tracks 1 Track Unlimited Physics No Yes Poser scene import No Yes 3D layer
Understand the Sketcher workbench of CATIA V5.
 Chapter 1 Drawing Sketches in Learning Objectives the Sketcher Workbench-I After completing this chapter you will be able to: Understand the Sketcher workbench of CATIA V5. Start a new file in the Part
Video in Logger Pro. There are many ways to create and use video clips and still images in Logger Pro.
 Video in Logger Pro There are many ways to create and use video clips and still images in Logger Pro. Insert an existing video clip into a Logger Pro experiment. Supported file formats include.avi and.mov.
Pro/ENGINEER Wildfire 4.0 Basic Design
 Introduction Datum features are non-solid features used during the construction of other features. The most common datum features include planes, axes, coordinate systems, and curves. Datum features do
imc FAMOS 6.3 visualization signal analysis data processing test reporting Comprehensive data analysis and documentation imc productive testing
 imc FAMOS 6.3 visualization signal analysis data processing test reporting Comprehensive data analysis and documentation imc productive testing www.imcfamos.com imc FAMOS at a glance Four editions to Optimize
Advanced discretisation techniques (a collection of first and second order schemes); Innovative algorithms and robust solvers for fast convergence.
; Innovative algorithms and robust solvers for fast convergence.") New generation CFD Software APUS-CFD APUS-CFD is a fully interactive Arbitrary Polyhedral Unstructured Solver. APUS-CFD is a new generation of CFD software for modelling fluid flow and heat transfer in
New generation CFD Software APUS-CFD APUS-CFD is a fully interactive Arbitrary Polyhedral Unstructured Solver. APUS-CFD is a new generation of CFD software for modelling fluid flow and heat transfer in
Copyright 2006 TechSmith Corporation. All Rights Reserved.
 TechSmith Corporation provides this manual as is, makes no representations or warranties with respect to its contents or use, and specifically disclaims any expressed or implied warranties or merchantability
Layout Tutorial. Chapter 10: Getting Started
 Chapter 10: Layout Tutorial In this tutorial we will create a layout template, send a few views to a layout page, then save this document in PDF format. In this tutorial you will learn about: Creating
Set up and solve a transient problem using the pressure-based solver and VOF model.
 Tutorial 18. Using the VOF Model This tutorial was run using ANSYS FLUENT 12.1. The results have been updated to reflect the change in the default setting of node-based smoothing for the surface tension
CREATING A 3D VISUALISATION OF YOUR PLANS IN PLANSXPRESS AND CORTONA VRML CLIENT
 CREATING A 3D VISUALISATION OF YOUR PLANS IN PLANSXPRESS AND CORTONA VRML CLIENT 20-25 Minutes This topic is for users of PlansXpress Total Toolkit Edition. To upgrade to PlansXpress Total Toolkit, call
VisIVO, an open source, interoperable visualization tool for the Virtual Observatory
 Claudio Gheller (CINECA) 1, Ugo Becciani (OACt) 2, Marco Comparato (OACt) 3 Alessandro Costa (OACt) 4 VisIVO, an open source, interoperable visualization tool for the Virtual Observatory 1: [email protected]
ABAQUS Tutorial. 3D Modeling
 Spring 2011 01/21/11 ABAQUS Tutorial 3D Modeling This exercise intends to demonstrate the steps you would follow in creating and analyzing a simple solid model using ABAQUS CAE. Introduction A solid undergoes
Files Used in this Tutorial
 Generate Point Clouds Tutorial This tutorial shows how to generate point clouds from IKONOS satellite stereo imagery. You will view the point clouds in the ENVI LiDAR Viewer. The estimated time to complete
3D-GIS in the Cloud USER MANUAL. August, 2014
 3D-GIS in the Cloud USER MANUAL August, 2014 3D GIS in the Cloud User Manual August, 2014 Table of Contents 1. Quick Reference: Navigating and Exploring in the 3D GIS in the Cloud... 2 1.1 Using the Mouse...
Revision history: New comments added to: m)! Universal Driver
! Universal Driver") Revision history: 1.0! 17/07/2006! Initial draft 1.1! 18/07/2006! Added screen shot for picture slides. 1.2! 07/09/2006! New features added: s)! Support for QuickTime VR movies. t)! Support for PDF files
Revision history: 1.0! 17/07/2006! Initial draft 1.1! 18/07/2006! Added screen shot for picture slides. 1.2! 07/09/2006! New features added: s)! Support for QuickTime VR movies. t)! Support for PDF files
Tetrahedral Mesh Generation
 Tutorial 2. Tetrahedral Mesh Generation Introduction The mesh generation process is highly automated in TGrid. In most cases, you can use the Auto Mesh feature to create the volume mesh from the surface
Lesson 15 - Fill Cells Plugin
 15.1 Lesson 15 - Fill Cells Plugin This lesson presents the functionalities of the Fill Cells plugin. Fill Cells plugin allows the calculation of attribute values of tables associated with cell type layers.
Quickstart for Desktop Version
 Quickstart for Desktop Version What is GeoGebra? Dynamic Mathematics Software in one easy-to-use package For learning and teaching at all levels of education Joins interactive 2D and 3D geometry, algebra,
Applying a circular load. Immediate and consolidation settlement. Deformed contours. Query points and query lines. Graph query.
 Quick Start Tutorial 1-1 Quick Start Tutorial This quick start tutorial will cover some of the basic features of Settle3D. A circular load is applied to a single soil layer and settlements are examined.
Introduction to CATIA V5
 Introduction to CATIA V5 Release 16 (A Hands-On Tutorial Approach) Kirstie Plantenberg University of Detroit Mercy SDC PUBLICATIONS Schroff Development Corporation www.schroff.com www.schroff-europe.com
Microsoft Office 2007 Orientation Objective 1: Become acquainted with the Microsoft Office Suite 2007 Layout
 Microsoft Office 2007 Orientation Objective 1: Become acquainted with the Microsoft Office Suite 2007 Layout Microsoft Suite 2007 offers a new user interface. The top portion of the window has a new structure
TIBCO Spotfire Business Author Essentials Quick Reference Guide. Table of contents:
 Table of contents: Access Data for Analysis Data file types Format assumptions Data from Excel Information links Add multiple data tables Create & Interpret Visualizations Table Pie Chart Cross Table Treemap
Introduction to Smart Board. Table of Contents. Connection Basics 3. Using the Board (Basics) 4. The Floating Tools Toolbar 5-6
 4. The Floating Tools Toolbar 5-6") Introduction to Smart Board Table of Contents Overview 2 Connection Basics 3 Using the Board (Basics) 4 The Floating Tools Toolbar 5-6 The Smartboard Smart Tool Buttons Collecting and Sharing Content with
Introduction to Smart Board Table of Contents Overview 2 Connection Basics 3 Using the Board (Basics) 4 The Floating Tools Toolbar 5-6 The Smartboard Smart Tool Buttons Collecting and Sharing Content with
LiDAR Point Cloud Processing with
 LiDAR Research Group, Uni Innsbruck LiDAR Point Cloud Processing with SAGA Volker Wichmann Wichmann, V.; Conrad, O.; Jochem, A.: GIS. In: Hamburger Beiträge zur Physischen Geographie und Landschaftsökologie
MAVIparticle Modular Algorithms for 3D Particle Characterization
 MAVIparticle Modular Algorithms for 3D Particle Characterization version 1.0 Image Processing Department Fraunhofer ITWM Contents Contents 1 Introduction 2 2 The program 2 2.1 Framework..............................
Piston Ring. Problem:
 Problem: A cast-iron piston ring has a mean diameter of 81 mm, a radial height of h 6 mm, and a thickness b 4 mm. The ring is assembled using an expansion tool which separates the split ends a distance
Generative Drafting. Page 1 1997 2001 DASSAULT SYSTEMES. IBM Product Lifecycle Management Solutions / Dassault Systemes
 Generative Drafting Page 1 Tutorial Objectives Description This Tutorial is an introduction to Generative Drafting. Message To show how CATIA V5 allows the user to automatically generate associative drafting
ABAQUS/CAE Tutorial: Analysis of an Aluminum Bracket
 H. Kim FEA Tutorial 1 ABAQUS/CAE Tutorial: Analysis of an Aluminum Bracket Hyonny Kim last updated: August 2004 In this tutorial, you ll learn how to: 1. Sketch 2D geometry & define part. 2. Define material
10.0-2. Finite Element Modeling
 What s New in FEMAP FEMAP 10.0 and 10.0.1 include enhancements and new features in: User Interface on page 3 Meshing on page 23 Mesh Associativity on page 33 Properties on page 33 Functions on page 35
Tips and Tricks: Design Modeler & ANSYS Meshing
 Tips and Tricks: Design Modeler & ANSYS Meshing 1 June 13th 2013 Andy Wade [email protected] Agenda: This presentation will highlight several common challenges for preprocessing, and provide best practices
PyRy3D: a software tool for modeling of large macromolecular complexes MODELING OF STRUCTURES FOR LARGE MACROMOLECULAR COMPLEXES
 MODELING OF STRUCTURES FOR LARGE MACROMOLECULAR COMPLEXES PyRy3D is a method for building low-resolution models of large macromolecular complexes. The components (proteins, nucleic acids and any other
MestRe-C User Guide Megan Bragg 04/14/05
 MestRe-C User Guide Megan Bragg 04/14/05 Some general useful features: 1. You can add Text, Titles, Temperatures, or peak labels (in any font/size/color) to the spectrum. 2. MestRe-C allows you to save