STATGRAPHICS Online. Statistical Analysis and Data Visualization System. Revised 6/21/2012. Copyright 2012 by StatPoint Technologies, Inc.
|
|
|
- Ethelbert Holland
- 10 years ago
- Views:
Transcription
1 STATGRAPHICS Online Statistical Analysis and Data Visualization System Revised 6/21/2012 Copyright 2012 by StatPoint Technologies, Inc. All rights reserved.

2 Table of Contents Introduction... 1 Chapter 1: Getting Started Creating a User Account... 2 Chapter 2: Entering and Manipulating Data Entering Data into the Data Editor Opening a Sample Dataset Opening a User File Formatting Data Managing Data Files Chapter 3: Selecting System Preferences General Settings Internationalization Fonts Graphics Fills Lines Points Chapter 4 Running Statistical Procedures Data Input Analysis Options Tables and Graphs Results to Save Calculate Preferences Save Script Chapter 5 Working with Scripts Chapter 6 STATLETS Index ii


3 Introduction STATGRAPHICS Online is a statistical package that allows you to perform a wide variety of statistical analyses from within your web browser. There is no need to download any software, since all calculations are done on a remote server. Using ASP.NET, data is submitted to a STATGRAPHICS XML web service running on a remote computer, which analyzes the data and returns both tabular and graphical results to the web browser. Data may reside anywhere, including your local computer. To use STATGRAPHICS Online, go to The introductory page gives several hints about using the program: Click on the Terms and Conditions link to read the conditions under which the software is provided. If you accept the terms and conditions, check the indicated box and press the Begin button to start analyzing data. 1


4 Chapter 1: Getting Started STATGRAPHICS Online can analyze data residing in various types of files, including Excel workbooks, XML files, or delimited text files. The main page, which is displayed when you start the program, shows the name of the current data file, together with a summary of the variables that it contains: Initially, an empty data file named Untitled is created, containing 10 columns and 100 rows. If you wish to try out the statistical procedures using sample datasets provided by StatPoint Technologies, you can select any menu item from the main item. If you wish to analyze your own data, you must first login using the link in the upper right corner of the page. 1.1 Creating a User Account In order to analyze your own data, you must first create a user account. When you press the Login link, you will see the following input fields: 2


5 If you have already created a user account, enter your user name and password. Otherwise, click on Create a new account: User names contain 1 to 16 characters and are used to identify data files belonging to an individual user. Both your user name and address cannot already be in use. If you have forgotten your user name and/or password, use the links on the first login screen. When you press the Create User button, a password for your account will be automatically generated and sent to the address that you enter. Once your password is received, return to the first Login screen and enter it. After you login, you will be returned to the main page. You can change your password by selecting My Account under Edit on the main menu. 3

6 Chapter 2: Entering and Manipulating Data To enter data into STATGRAPHICS Online, you have several choices: 1. Press the Edit Data button on the main page to load the data editor. This will display a datasheet of rows and columns into which you may type data. You can also use your system s clipboard to copy and paste data from other applications. 2. Select File Open Sample Dataset to load one of StatPoint s sample datasets. 3. Select File Open User Data File From Client to load a data file residing on your computer. 4. Select File Open User Data File From Server to load a data file that you have previously saved on the server. 5. Leave the data file as Untitled and select a statistical procedure from the main menu. A sample dataset with data appropriate for the procedure you selected will then automatically be loaded. 2.1 Entering Data into the Data Editor When you press the Edit Data menu on the main page, the Data Editor page shown below will be displayed: 4


7 The Data Editor contains a data book with two sheets: one sheet for Input data that you wish to analyze, and a second sheet into which calculated Results will be placed. You can switch between the two sheets using the toolbar along the bottom of the page. To enter data, simply type it into the cells of the table. You should also assign meaningful names to the columns of the table. Column names are used to select data while in the statistical procedures and are displayed on tables and graphs. You can also use the row beneath to column names to indicate additional information about each column, such as the unit of measurement. A typical completed data sheet is shown below: 5


8 The menu across the top of the Data Editor page allows you to perform several important operations. To save data you have entered, select Save File As, which will display the following page: You may save data in any of the indicated formats. If you plan to use the data only with STATGRAPHICS Online, we recommend that you save it as a STATGRAPHICS.sgd file. SGD files are XML files designed to contain information in a format that can be easily manipulated by the statistical procedures. A typical example is shown below: 6

9 <?xml version="1.0"?> <statgraphics_data> <FORMAT> <DateOrder>MDY</DateOrder> <DateSeparator>/</DateSeparator> <DecimalSymbol>.</DecimalSymbol> </FORMAT> <COLUMNS> <C1 name="make" type="c"/> <C2 name="model" type="c"/> <C3 name="type" type="c"/> <C4 name="min Price" type="n" comment="price for basic version in $1,000"/> <C5 name="mid Price" type="n" comment="average of min and max prices"/> </COLUMNS> <ROW> <C1>Acura</C1> <C2>Integra</C2> <C3>Small</C3> <C4>12.9</C4> <C5>15.9</C5> </ROW> <ROW> <C1>Acura</C1> <C2>Legend</C2> <C3>Midsize</C3> <C4>29.2</C4> <C5>33.9</C5> </ROW> </statgraphics_data> It contains information about how the data is formatted, column names and comments, and the raw data. You can also edit SGD files in any text editor, provided you maintain the same basic format. Other operations that you can perform in the Data Editor include: 1. Pasting columns of data from other applications First copy data from the other applications to the system clipboard. In the STATGRAPHICS data sheet, highlight the location at which you wish to paste the data. Then click on the Copy button in the lower toolbar. 2. Paging within large datasets To reduce the amount of information that must be sent between your browser and the server, large datasets are displayed in blocks of 100 rows each. You can page between blocks using the arrows on the lower toolbar. 7


10 3. Printing data Click on the printer icon on the lower toolbar to send a copy of the data to your printer. 4. Cancel entries As you make changes to your data, they are changed within the browser but not sent to the server until: a. You perform an operation such as selecting something from the menu that causes a new page to be posted. b. You click on Update on the lower toolbar. To undo all input since the last post to the server, click on Cancel on the lower toolbar. NOTE: changes posted to the server are not permanent until you select File Save from the top menu. 5. Delete rows, columns or cells Highlight the data to be deleted and select Delete from the top menu. 6. Insert rows, columns or cells Highlight the data after which space is to be added and select Insert from the top menu. 7. Sort data Highlight a single column and select Rows Sort to sort data according to the values in the highlighted column. After you enter and save the data, press Cancel to return to the main page. The name of the saved file and a summary of its contents will be displayed: 8


11 The summary shows: 1. Nonmissing values the number of rows in the column for which an entry has been made. Empty cells will be treated as missing values by the statistical procedures. 2. Numeric values the number of rows in the column that have valid numeric entries. When performing a statistical operation that requires numeric values, only these cells will be used in the analysis. 3. Minimum and maximum the smallest and largest values in the column. For columns with no numeric values, this is based on an alphanumeric comparison. 2.2 Opening a Sample Dataset StatPoint Technologies has provided a collection of sample datasets that may be loaded by selecting File Open Sample Dataset. Choose the file to be loaded and press Open Dataset. 2.3 Opening a User File Users may also open data files from their client machine by selecting File Open User Data File From Client. This will display the page shown below: 9


12 Press the Browse button to search your computer for the file that you wish to load. Indicate the type of file it is and press Open File. This will: 1. Upload a copy of the file to the STATGRAPHICS Online server. 2. Make the selected data file the active file for access by the statistical procedures. You will then be returned to the main page. NOTES: 1. If you wish to restrict the program (and yourself) from making changes to the input file, select Open in readonly mode. You will still be able to display the data in the data editor, but you will not be able to make changes to it. 2. If you read an Excel file, only the data in the first sheet of the Excel workbook will be copied to the server and loaded. If you make changes to the file and resave it on the server, please remember that it contains only that one sheet. 3. The first two rows of Excel files and text files are assumed to contain column names and comments. If they do not, you may have to make adjustments to the data in the data editor by inserting additional blank rows at the top of the file. 10


13 2.4 Formatting Data When you read data from external files (non-statgraphics files), the data is assumed to follow the formatting conventions of your current locale. This is also true when you type data into the Data Editor. The settings that affect how data are read are: 1. Decimal separator the symbol placed to the left of the first decimal digit (either a period or a comma). 2. Date delimiter usually a slash (/), period (.), or dash (-). 3. Date order usually Month-Day-Year or Day-Month-Year. You should be sure that the data in your files follows the conventions of your locale. NOTE: you can specify a different format for the statistical output if desired by changing the setting under Edit Preferences on the main menu. 2.5 Managing Data Files The File menu contains a selection titled Manage Data Files that allows you to perform common operations on user data files that have been saved on the server. It displays the page shown below: The buttons perform the following operations: 11

14 Rename To rename a file, select the file you wish to rename from the drop down list. Then enter a new name for the file. NOTE: since this option does not change the contents of the file, the file extension should usually not be changed. Copy To create a copy of a file, select the file you wish to copy from the drop down list. Then enter a name for the new file. NOTE: since this option does not change the contents of the file, the file extension of the new file should usually be the same as the original file. Delete To delete a file, select the file you wish to copy from the drop down list. Check the Okay to delete file box and press Delete. Download This option is designed to allow you to download a file from the server to your client computer. Select the file you wish to copy from the drop down list. When you press download, a link will be added to the page specifying the URL necessary to access that file. You can then use your browser s capabilities to download the file to your computer. Upload - This option is designed to allow you to upload a file from your client computer to the server. Use the Browse button to locate the file you wish to upload and then press Upload. 12


15 Chapter 3: Selecting System Preferences The Edit menu contains a selection titled Set Preferences that allows you to change the default settings used by STATGRAPHICS Online. It consists of multiple pages, each similar to the page shown below: 3.1 General Settings The General Settings page allows you to specify the following settings: Significant digits the number of significant digits shown when displaying numeric values. Default confidence level the confidence level used by default when creating interval estimates and hypothesis tests, and that used by the StatAdvisor when interpreting statistical results. Rows to display in tables the maximum number of rows displayed when a table is created. This prevents tables from becoming excessively large when analyzing large datasets. 13

16 Table width in characters the maximum number of characters displayed across the page when outputting a table. Tables exceeding this width will be displayed in multiple segments. StatAdvisor controls whether StatAdvisor information is displayed after tables and graphs. The StatAdvisor interprets the statistical output. Missing value indicator a special indicator used in user data files to indicate missing data, if any. Empty cells are always interpreted as containing missing values. 14


17 3.2 Internationalization Output language the language used in output tables and graphs. Currently, input pages are only available in English. Decimal separator the decimal separator to be used in displaying output. All numeric values on input pages and in user data files are assumed to follow the conventions of the current locale setting for your computer. Date separator - the date separator to be used in displaying output. All date and date-time values on input pages and in user data files are assumed to follow the conventions of the current locale setting for your computer. Date format - the format for months, days and years to be used in displaying output. A double letter such as mm requests that numbers below 10 be written with a leading zero. All date and date-time values on input pages and in user data files are assumed to follow the conventions of the current locale setting for your computer. 15


18 3.3 Fonts This page controls the fonts used when outputting tables and graphs. Press the Foreground and Background buttons to display the available colors that may be selected in the dropdown lists. 16


19 3.4 Graphics Graph width and height the size of graphs in pixels. Function resolution the number of X values at which functions will be evaluated when drawn on a graph. Higher resolution results in smoother curves. Contour plot resolution the number of X and Y values at which a function will be evaluated when contour plots are created. Higher resolution results in smoother divisions between the contour levels. Graph background color the color displayed within the axes of a graph. Graph border color the color displayed outside the axes of a graph. 3D effects whether 3D effects are used around the frame of a graph and when displaying filled areas such as bars and pie slices. 17


20 3.5 Fills Graphs may contain up to 20 different types of filled areas. You may change the color and/or type of fill used in each area. 18


21 3.6 Lines Graphs may contain up to 20 different line types. You may change the color and/or type of each line. 19
22 3.7 Points Graphs may contain up to 20 different point types. You may change the size, color and/or type of each point set. 20
23 Chapter 4 Running Statistical Procedures The main menu provides access to a large collection of statistical procedures. After opening the file containing the data you wish to analyze, use the menu to select the desired procedure. For example, suppose you wished to analyze the data contained in the sample dataset titled Shelf Life Study. This dataset contains 44 samples of different ages. For each sample, the number of weeks since it was produced is recorded, as is the concentration of chlorine. Select File Open Sample Dataset to open the desired file. Then select Relate Simple Regression from the main menu, as shown below: 4.1 Data Input Whenever you select a statistical procedure from the main menu, a page will be displayed on which to specify the columns containing the data that you wish to analyze. The initial page for the Simple Regression procedure is shown below: 21

24 You can specify the name of a variable in either of two ways: 1. Press the arrow to dropdown the list of variables and select the desired column. 2. Press the Edit button to the right of the column to display an edit field to the right of the button, as shown below: You can type any valid STATGRAPHICS expression into the edit field, such as the expression above which will calculate the natural logarithms of chlorine. Then press the arrow button to put the edit field contents into the dropdown list: STATGRAPHICS expressions are described in detail in the document Operators.pdf. Each Data Input page also contains a Select field, which can be used to select a subset of the rows in the file. Typical entries include: 22
 Selects a random set of k rows. RANDOM(25) EXCLUDE(k) Selects all rows except row k. EXCLUDE(25) column = value Selects only rows for which column weeks = 30 equals value.")
25 Entry Use Example FIRST (k) Selects the first k rows. FIRST(25) LAST (k) Selects the last k rows. LAST(25) ROWS (start,end) Selects rows between start and end, ROWS(21,30) inclusive. RANDOM (k) Selects a random set of k rows. RANDOM(25) EXCLUDE(k) Selects all rows except row k. EXCLUDE(25) column = value Selects only rows for which column weeks = 30 equals value. column <> value Selects only rows for which column weeks <> 30 does not equal value. column > value Selects only rows for which column weeks > 30 is greater than value. column < value Selects only rows for which column weeks < 30 is less than value. column >= value Selects only rows for which column weeks >= 30 is greater than or equal to value. column <= value Selects only rows for which column weeks <= 30 is less than or equal to value. condition1 & condition2 Selects only rows that meet both weeks >= 20 & condition1 condition2 conditions. Selects only rows that meet at least one of the conditions. weeks <= 40 weeks = 30 weeks = 40 If you push the Help button next to the Select field, it will display a list showing typical structures: 23

26 If you select a radio button and then press Help again, an entry will be placed in the Select field as shown below: Replace any??? s with your desired entries. 4.2 Analysis Options After specifying the columns containing the data to be analyzed, click on Analysis Options to display a second page containing overall options for the selected statistical procedure: You can stick with the default settings or make any desired changes. 24

27 4.3 Tables and Graphs The third page lists all of the tables and graphs that can be generated by the selected statistical procedure, together with any options: Press All to select all of the available output, or check only the tables and graphs that you want. For each graph, there is a button labeled Titles and Scaling that allows you to override the default selections. These buttons display the page shown below: 25
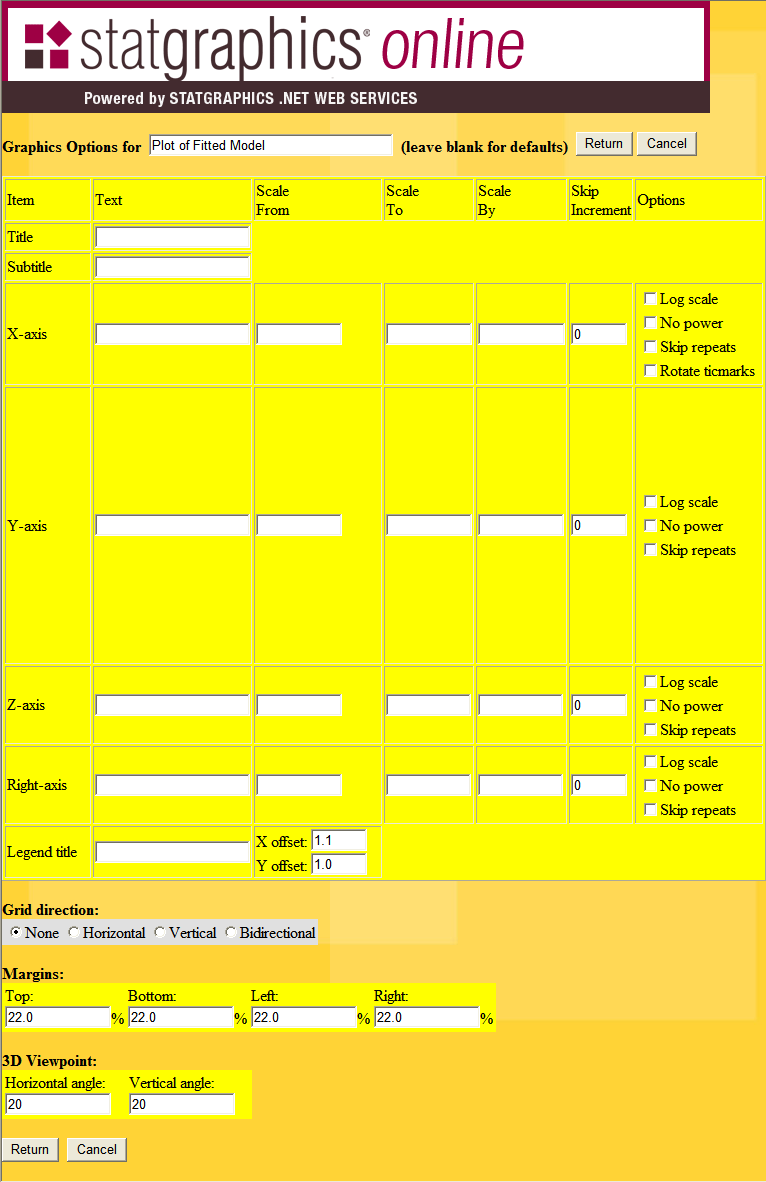
28 26
29 To override the title or scaling for an axis, enter the desired information. Otherwise, default settings will be applied. Some of the special options available on this page are: Log scale Check this box to draw an axis using a logarithmic scale. Note that graphs on which logarithmic scaling does not make sense will ignore this setting. No power Check this box to suppress scaling axes using a notation such as (X 1000) for very large or very small numbers. Skip repeats Check this box to indicate that consecutive axis labels that are identical should not be drawn. This applies only to non-numeric axes. X and Y offset This indicates the desired position of the legend block (if any) with respect to the axes. For offset purposes, the axes are considered to extend from (0, 0) at the bottom left corner to (1, 1) at the upper right corner. A value such as 1.1 for the X offset indicates that the legend block should be offset by 10% to the right of the axes. If a legend block is partially offscreen, use this setting and the page margins to adjust its position. Margins This indicates the offset of each axis from the edge of the graphics drawing area. 3D viewpoint These angles specify the location of the viewer with respect to the origin of a 3D graph. Increasing the angles moves the viewer further to the right and further above the graph. 27

30 4.4 Results to Save The fourth page indicates which results, if any, should be saved for later access: When results are saved, they are placed in an XML file and a link to that file is added to the bottom of the output page. In addition, the results are loaded into the second page of the Data Editor. 4.5 Calculate Once all desired options have been selected, press the Calculate button to begin the statistical calculations. An XML script is automatically created and sent to the server. The server reads the indicated data, performs the calculations, and sends back an HTML page to the web browser for display. The HTML page contains tabular output and imbedded images, as in the example below: 28

31 29

32 Once in the browser, you can scroll though the output. You can also use the browser to print the output, copy it to your system s clipboard, or save the graphics images on your computer. 4.6 Preferences At any time while in a statistical procedure, you can press the Preferences button to change system preferences. This accesses each of the pages described earlier in Chapter 3, which include settings such as the output language. If the Calculate button has already been pressed, it will be executed again using the new settings. 4.7 Save Script If you wish to view or save the XML script generated by the statistical procedure, press the Save Script button. This will display the following page: Scripts are normally saved with the extension.sgs. Once a script has been saved, it can be executed again at a later time by selecting File - Execute Script from the main menu. 30
33 Chapter 5 Working with Scripts The instructions sent to the server when the Calculate button is pressed within a statistical procedure are contained in an XML script. The script tells the.net Web Services where to locate the data to be analyzed, which procedure to execute, and what options are desired. As outlined in Chapter 4, these scripts may be saved for later reexecution. A typical script contains several sections. The top section indicates the identity of the script and specifies the values of any global settings: <?xml version="1.0"?> - <statgraphics> - <globals> <BorderColor Value="SpringGreen" /> <InputDateFormat Value="M/D/YYYY" /> <OutputDateFormat Value="M/D/YYYY" /> <ThreeDFrameEffects Value="Yes" /> <FillColor1 Value="SteelBlue" /> <PointType1 Value="Plus" /> </globals> Each global settings is followed by its desired value. The second section of the script indicates the name of the data source and information about how the data is formatted: <data Alias="nonlin.xml" Source="temp/nonlin.sgd"> <DecimalSeparator Value="." /> <DateFormat Value="M/D/YYYY" /> <MissingValue Value="" /> </data> The Alias is the name of the original data file. Source specifies the relative location where the data is stored on the server. Data not contained in STATGRAPHICS.SGD files on the server is copied to a STATGRAPHICS data file when it is first loaded. The last part of the script specifies information about the procedure to be run: <proc name="sreg"> <input> <Y Value="chlorine" /> <X Value="weeks" /> </input> <options> <Model Value="SquaredYReciprocalX" /> </options> 31
34 <output> <table Name="Summary" /> <graph Name="Model"> <Resolution Value="101" /> </graph> <table Name="Forecasts"> <X Value="10" /> <X Value="20" /> <X Value="30" /> <X Value="40" /> </table> <graph Name="Observed" /> <table Name="LackOfFit" /> <table Name="Comparison" /> <table Name="Residuals" /> <graph Name="ResidsVsX" /> <graph Name="ResidsVsPred" /> <graph Name="ResidsVsRow" /> <table Name="Influential" /> </output> <results> <Residuals Name="RESIDS" /> </results> </proc> </statgraphics> The Input section specifies the columns containing the data to be analyzed. The Options section sets the values of any analysis options. The Output section identifies the tables and graphs to be created. The Results section indicates which numerical results should be saved for later use. Currently, there are two procedures on the STATGRAPHICS Online menu that deal with scripts: 1. Execute script This option reexecutes a saved script. When the script is executed, it will look for the original data file specified in the Alias tag. If the data has changed, the results will be different. 2. Manage Scripts The option allows scripts to be copies, renamed, deleted, or downloaded to your client machine. Beginning with Version XVI of STATGRAPHICS Centurion, these scripts will also be executable by the desktop Windows program. 32

35 Chapter 6 STATLETS The main menu contains a special section labeled Statlets that provides access to special procedures that allow you to interact with your data. For example, select File - Open Sample Dataset from the main menu and open the sample dataset for the Shelf life study. Then select Statlets - Regression Analysis - Curve Fitting from the menu. This will display the page shown below: Select the Y and X variables and then press Update Plot. This will add the graph shown below to the page: 33

36 If your web browser supports HTML5 canvases, you may click on or touch any point on the graph to display its row number and coordinates: 34

37 After clicking on a point, you may then press the Exclude/include selected point button to remove it from the fit: Excluded points are displayed in red. If your web browser supports Java, you may press the Use Java button to load a Java applet in place of the canvas: 35

38 Java applets allow changes to be made to the graph without posting the page back to the server. With the Curve Fitting applet, you may: 1. Click on a point to display its row number or label. The coordinates of the point and its predicted value will be displayed in the right margin of the graph. 2. Drag a point to a new location with your mouse and observe the effect on the fitted line. (You must first uncheck Lock points). 3. Click on a point and press the Exclude/Include button to remove that point completely from the fit. 4. Click on any location of the graph to display a vertical cursor at the selected value of X. The predicted response and limits at that X will be displayed in the right margin of the graph. 5. Use the X power and Y power sliders to fit a nonlinear regression model involving powers of the variables. 6. Use the Window slider to change the width of the LOWESS smoothing window (if Add LOWESS smooth has been selected). By interacting with the applet, you can often see interesting features of your data. 36
39 Index column names... 5 confidence level data copy and paste... 7 delete... 8 editor... 4 entry... 4 formatting insert... 8 paging... 7 printing... 8 saving... 6 sorting... 8 data files copying deleting downloading renaming SGD files... 7 uploading date format decimal separator Excel files fonts graphs 3D effects D viewpoint background color fills function resolution legend block offset lines margins points titles and scaling width and height language setting main page... 2 missing values passwords... 3 preferences sample datasets... 9 scripts select field Boolean expressions EXCLUDE FIRST LAST RANDOM ROWS significant digits StatAdvisor STATGRAPHICS expressions statistical procedures analysis options calculate data input preferences results to save save script tables and graphs Statlets tables maximum rows maximum width terms and conditions... 1 user accounts... 2 user data files
Intro to Excel spreadsheets
 Intro to Excel spreadsheets What are the objectives of this document? The objectives of document are: 1. Familiarize you with what a spreadsheet is, how it works, and what its capabilities are; 2. Using
Decision Support AITS University Administration. Web Intelligence Rich Client 4.1 User Guide
 Decision Support AITS University Administration Web Intelligence Rich Client 4.1 User Guide 2 P age Web Intelligence 4.1 User Guide Web Intelligence 4.1 User Guide Contents Getting Started in Web Intelligence
Excel 2007 Basic knowledge
 Ribbon menu The Ribbon menu system with tabs for various Excel commands. This Ribbon system replaces the traditional menus used with Excel 2003. Above the Ribbon in the upper-left corner is the Microsoft
Web Portal User Guide. Version 6.0
 Web Portal User Guide Version 6.0 2013 Pitney Bowes Software Inc. All rights reserved. This document may contain confidential and proprietary information belonging to Pitney Bowes Inc. and/or its subsidiaries
Using Adobe Dreamweaver CS4 (10.0)
") Getting Started Before you begin create a folder on your desktop called DreamweaverTraining This is where you will save your pages. Inside of the DreamweaverTraining folder, create another folder called
Getting Started Before you begin create a folder on your desktop called DreamweaverTraining This is where you will save your pages. Inside of the DreamweaverTraining folder, create another folder called
Reference Guide for WebCDM Application 2013 CEICData. All rights reserved.
 Reference Guide for WebCDM Application 2013 CEICData. All rights reserved. Version 1.2 Created On February 5, 2007 Last Modified August 27, 2013 Table of Contents 1 SUPPORTED BROWSERS... 3 1.1 INTERNET
Using Excel as a Management Reporting Tool with your Minotaur Data. Exercise 1 Customer Item Profitability Reporting Tool for Management
 Using Excel as a Management Reporting Tool with your Minotaur Data with Judith Kirkness These instruction sheets will help you learn: 1. How to export reports from Minotaur to Excel (these instructions
Joomla! 2.5.x Training Manual
 Joomla! 2.5.x Training Manual Joomla is an online content management system that keeps track of all content on your website including text, images, links, and documents. This manual includes several tutorials
How to make a line graph using Excel 2007
 How to make a line graph using Excel 2007 Format your data sheet Make sure you have a title and each column of data has a title. If you are entering data by hand, use time or the independent variable in
Plotting: Customizing the Graph
 Plotting: Customizing the Graph Data Plots: General Tips Making a Data Plot Active Within a graph layer, only one data plot can be active. A data plot must be set active before you can use the Data Selector
CREATING EXCEL PIVOT TABLES AND PIVOT CHARTS FOR LIBRARY QUESTIONNAIRE RESULTS
 CREATING EXCEL PIVOT TABLES AND PIVOT CHARTS FOR LIBRARY QUESTIONNAIRE RESULTS An Excel Pivot Table is an interactive table that summarizes large amounts of data. It allows the user to view and manipulate
Appspace 5.X Reference Guide (Digital Signage) Updated on February 9, 2015
 Updated on February 9, 2015") Appspace 5.X Reference Guide (Digital Signage) Updated on February 9, 2015 1 TABLE OF CONTENTS 2 What is Appspace For Digital Signage... 4 3 Access Appspace... 4 4 Best Practices and Notes... 4 5 Appspace
Appspace 5.X Reference Guide (Digital Signage) Updated on February 9, 2015 1 TABLE OF CONTENTS 2 What is Appspace For Digital Signage... 4 3 Access Appspace... 4 4 Best Practices and Notes... 4 5 Appspace
SECTION 2-1: OVERVIEW SECTION 2-2: FREQUENCY DISTRIBUTIONS
 SECTION 2-1: OVERVIEW Chapter 2 Describing, Exploring and Comparing Data 19 In this chapter, we will use the capabilities of Excel to help us look more carefully at sets of data. We can do this by re-organizing
DataPA OpenAnalytics End User Training
 DataPA OpenAnalytics End User Training DataPA End User Training Lesson 1 Course Overview DataPA Chapter 1 Course Overview Introduction This course covers the skills required to use DataPA OpenAnalytics
KaleidaGraph Quick Start Guide
 KaleidaGraph Quick Start Guide This document is a hands-on guide that walks you through the use of KaleidaGraph. You will probably want to print this guide and then start your exploration of the product.
Netigate User Guide. Setup... 2. Introduction... 5. Questions... 6. Text box... 7. Text area... 9. Radio buttons...10. Radio buttons Weighted...
 Netigate User Guide Setup... 2 Introduction... 5 Questions... 6 Text box... 7 Text area... 9 Radio buttons...10 Radio buttons Weighted...12 Check box...13 Drop-down...15 Matrix...17 Matrix Weighted...18
Creating Personal Web Sites Using SharePoint Designer 2007
 Creating Personal Web Sites Using SharePoint Designer 2007 Faculty Workshop May 12 th & 13 th, 2009 Overview Create Pictures Home Page: INDEX.htm Other Pages Links from Home Page to Other Pages Prepare
MyOra 3.0. User Guide. SQL Tool for Oracle. Jayam Systems, LLC
 MyOra 3.0 SQL Tool for Oracle User Guide Jayam Systems, LLC Contents Features... 4 Connecting to the Database... 5 Login... 5 Login History... 6 Connection Indicator... 6 Closing the Connection... 7 SQL
Web Intelligence User Guide
 Web Intelligence User Guide Office of Financial Management - Enterprise Reporting Services 4/11/2011 Table of Contents Chapter 1 - Overview... 1 Purpose... 1 Chapter 2 Logon Procedure... 3 Web Intelligence
To change title of module, click on settings
 HTML Module: The most widely used module on the websites. This module is very flexible and is used for inserting text, images, tables, hyperlinks, document downloads, and HTML code. Hover the cursor over
Visualization with Excel Tools and Microsoft Azure
 Visualization with Excel Tools and Microsoft Azure Introduction Power Query and Power Map are add-ins that are available as free downloads from Microsoft to enhance the data access and data visualization
Statgraphics Getting started
 Statgraphics Getting started The aim of this exercise is to introduce you to some of the basic features of the Statgraphics software. Starting Statgraphics 1. Log in to your PC, using the usual procedure
EXCEL PIVOT TABLE David Geffen School of Medicine, UCLA Dean s Office Oct 2002
 EXCEL PIVOT TABLE David Geffen School of Medicine, UCLA Dean s Office Oct 2002 Table of Contents Part I Creating a Pivot Table Excel Database......3 What is a Pivot Table...... 3 Creating Pivot Tables
Google Docs Basics Website: http://etc.usf.edu/te/
 Website: http://etc.usf.edu/te/ Google Docs is a free web-based office suite that allows you to store documents online so you can access them from any computer with an internet connection. With Google
HRS 750: UDW+ Ad Hoc Reports Training 2015 Version 1.1
 HRS 750: UDW+ Ad Hoc Reports Training 2015 Version 1.1 Program Services Office & Decision Support Group Table of Contents Create New Analysis... 4 Criteria Tab... 5 Key Fact (Measurement) and Dimension
Creating and Managing Online Surveys LEVEL 2
 Creating and Managing Online Surveys LEVEL 2 Accessing your online survey account 1. If you are logged into UNF s network, go to https://survey. You will automatically be logged in. 2. If you are not logged
Adobe Dreamweaver CC 14 Tutorial
 Adobe Dreamweaver CC 14 Tutorial GETTING STARTED This tutorial focuses on the basic steps involved in creating an attractive, functional website. In using this tutorial you will learn to design a site
Basic Excel Handbook
 2 5 2 7 1 1 0 4 3 9 8 1 Basic Excel Handbook Version 3.6 May 6, 2008 Contents Contents... 1 Part I: Background Information...3 About This Handbook... 4 Excel Terminology... 5 Excel Terminology (cont.)...
Microsoft Access 2010 Overview of Basics
 Opening Screen Access 2010 launches with a window allowing you to: create a new database from a template; create a new template from scratch; or open an existing database. Open existing Templates Create
MS Excel. Handout: Level 2. elearning Department. Copyright 2016 CMS e-learning Department. All Rights Reserved. Page 1 of 11
 MS Excel Handout: Level 2 elearning Department 2016 Page 1 of 11 Contents Excel Environment:... 3 To create a new blank workbook:...3 To insert text:...4 Cell addresses:...4 To save the workbook:... 5
Hypercosm. Studio. www.hypercosm.com
 Hypercosm Studio www.hypercosm.com Hypercosm Studio Guide 3 Revision: November 2005 Copyright 2005 Hypercosm LLC All rights reserved. Hypercosm, OMAR, Hypercosm 3D Player, and Hypercosm Studio are trademarks
Excel Unit 4. Data files needed to complete these exercises will be found on the S: drive>410>student>computer Technology>Excel>Unit 4
 Excel Unit 4 Data files needed to complete these exercises will be found on the S: drive>410>student>computer Technology>Excel>Unit 4 Step by Step 4.1 Creating and Positioning Charts GET READY. Before
BID2WIN Workshop. Advanced Report Writing
 BID2WIN Workshop Advanced Report Writing Please Note: Please feel free to take this workbook home with you! Electronic copies of all lab documentation are available for download at http://www.bid2win.com/userconf/2011/labs/
Creating Interactive PDF Forms
 Creating Interactive PDF Forms Using Adobe Acrobat X Pro Information Technology Services Outreach and Distance Learning Technologies Copyright 2012 KSU Department of Information Technology Services This
Introduction to Drupal
 Introduction to Drupal Login 2 Create a Page 2 Title 2 Body 2 Editor 2 Menu Settings 5 Attached Images 5 Authoring Information 6 Revision Information 6 Publishing Options 6 File Attachments 6 URL Path
MicroStrategy Analytics Express User Guide
 MicroStrategy Analytics Express User Guide Analyzing Data with MicroStrategy Analytics Express Version: 4.0 Document Number: 09770040 CONTENTS 1. Getting Started with MicroStrategy Analytics Express Introduction...
Learn About Analysis, Interactive Reports, and Dashboards
 Learn About Analysis, Interactive Reports, and Dashboards This document supports Pentaho Business Analytics Suite 5.0 GA and Pentaho Data Integration 5.0 GA, documentation revision February 3, 2014, copyright
Drawing a histogram using Excel
 Drawing a histogram using Excel STEP 1: Examine the data to decide how many class intervals you need and what the class boundaries should be. (In an assignment you may be told what class boundaries to
Virtual Exhibit 5.0 requires that you have PastPerfect version 5.0 or higher with the MultiMedia and Virtual Exhibit Upgrades.
 28 VIRTUAL EXHIBIT Virtual Exhibit (VE) is the instant Web exhibit creation tool for PastPerfect Museum Software. Virtual Exhibit converts selected collection records and images from PastPerfect to HTML
Gestation Period as a function of Lifespan
 This document will show a number of tricks that can be done in Minitab to make attractive graphs. We work first with the file X:\SOR\24\M\ANIMALS.MTP. This first picture was obtained through Graph Plot.
SPSS Manual for Introductory Applied Statistics: A Variable Approach
 SPSS Manual for Introductory Applied Statistics: A Variable Approach John Gabrosek Department of Statistics Grand Valley State University Allendale, MI USA August 2013 2 Copyright 2013 John Gabrosek. All
Sample Table. Columns. Column 1 Column 2 Column 3 Row 1 Cell 1 Cell 2 Cell 3 Row 2 Cell 4 Cell 5 Cell 6 Row 3 Cell 7 Cell 8 Cell 9.
 Working with Tables in Microsoft Word The purpose of this document is to lead you through the steps of creating, editing and deleting tables and parts of tables. This document follows a tutorial format
Joomla Article Advanced Topics: Table Layouts
 Joomla Article Advanced Topics: Table Layouts An HTML Table allows you to arrange data text, images, links, etc., into rows and columns of cells. If you are familiar with spreadsheets, you will understand
To launch the Microsoft Excel program, locate the Microsoft Excel icon, and double click.
 EDIT202 Spreadsheet Lab Assignment Guidelines Getting Started 1. For this lab you will modify a sample spreadsheet file named Starter- Spreadsheet.xls which is available for download from the Spreadsheet
NDSU Technology Learning & Media Center. Introduction to Google Sites
 NDSU Technology Learning & Media Center QBB 150C 231-5130 www.ndsu.edu/its/tlmc Introduction to Google Sites Get Help at the TLMC 1. Get help with class projects on a walk-in basis; student learning assistants
How to Use Swiftpage for SageCRM
 How to Use Swiftpage for SageCRM 1 Table of Contents Basics of the Swiftpage for SageCRM Integration 3 How to Install Swiftpage for SageCRM and Set Up Your Account...4 Accessing Swiftpage s Online Editor
JOOMLA 2.5 MANUAL WEBSITEDESIGN.CO.ZA
 JOOMLA 2.5 MANUAL WEBSITEDESIGN.CO.ZA All information presented in the document has been acquired from http://docs.joomla.org to assist you with your website 1 JOOMLA 2.5 MANUAL WEBSITEDESIGN.CO.ZA BACK
Excel 2002. What you will do:
 What you will do: Explore the features of Excel 2002 Create a blank workbook and a workbook from a template Format a workbook Apply formulas to a workbook Create a chart Import data to a workbook Share
Microsoft Excel 2010 Pivot Tables
 Microsoft Excel 2010 Pivot Tables Email: [email protected] Web Page: http://training.health.ufl.edu Microsoft Excel 2010: Pivot Tables 1.5 hours Topics include data groupings, pivot tables, pivot
Quickstart for Desktop Version
 Quickstart for Desktop Version What is GeoGebra? Dynamic Mathematics Software in one easy-to-use package For learning and teaching at all levels of education Joins interactive 2D and 3D geometry, algebra,
Business Objects Version 5 : Introduction
 Business Objects Version 5 : Introduction Page 1 TABLE OF CONTENTS Introduction About Business Objects Changing Your Password Retrieving Pre-Defined Reports Formatting Your Report Using the Slice and Dice
How to Use Swiftpage for Microsoft Excel
 How to Use Swiftpage for Microsoft Excel 1 Table of Contents Basics of the Swiftpage for Microsoft Excel Integration....3 How to Install Swiftpage for Microsoft Excel and Set Up Your Account...4 Creating
Chapter 4 Creating Charts and Graphs
 Calc Guide Chapter 4 OpenOffice.org Copyright This document is Copyright 2006 by its contributors as listed in the section titled Authors. You can distribute it and/or modify it under the terms of either
Creating Web Pages With Dreamweaver MX 2004
 Creating Web Pages With Dreamweaver MX 2004 1 Introduction Learning Goal: By the end of the session, participants will have an understanding of: What Dreamweaver is, and How it can be used to create basic
Creating Online Surveys with Qualtrics Survey Tool
 Creating Online Surveys with Qualtrics Survey Tool Copyright 2015, Faculty and Staff Training, West Chester University. A member of the Pennsylvania State System of Higher Education. No portion of this
Cascade Server. End User Training Guide. OIT Training and Documentation Services OIT TRAINING AND DOCUMENTATION. oittraining@uta.
 OIT Training and Documentation Services Cascade Server End User Training Guide OIT TRAINING AND DOCUMENTATION [email protected] http://www.uta.edu/oit/cs/training/index.php 2013 CONTENTS 1. Introduction
Universal Simple Control, USC-1
 Universal Simple Control, USC-1 Data and Event Logging with the USB Flash Drive DATA-PAK The USC-1 universal simple voltage regulator control uses a flash drive to store data. Then a propriety Data and
Writer Guide. Chapter 15 Using Forms in Writer
 Writer Guide Chapter 15 Using Forms in Writer Copyright This document is Copyright 2005 2008 by its contributors as listed in the section titled Authors. You may distribute it and/or modify it under the
understand how image maps can enhance a design and make a site more interactive know how to create an image map easily with Dreamweaver
 LESSON 3: ADDING IMAGE MAPS, ANIMATION, AND FORMS CREATING AN IMAGE MAP OBJECTIVES By the end of this part of the lesson you will: understand how image maps can enhance a design and make a site more interactive
OECD.Stat Web Browser User Guide
 OECD.Stat Web Browser User Guide May 2013 May 2013 1 p.10 Search by keyword across themes and datasets p.31 View and save combined queries p.11 Customise dimensions: select variables, change table layout;
Search help. More on Office.com: images templates
 Page 1 of 14 Access 2010 Home > Access 2010 Help and How-to > Getting started Search help More on Office.com: images templates Access 2010: database tasks Here are some basic database tasks that you can
Microsoft FrontPage 2003
 Information Technology Services Kennesaw State University Microsoft FrontPage 2003 Information Technology Services Microsoft FrontPage Table of Contents Information Technology Services...1 Kennesaw State
Getting Started with KompoZer
 Getting Started with KompoZer Contents Web Publishing with KompoZer... 1 Objectives... 1 UNIX computer account... 1 Resources for learning more about WWW and HTML... 1 Introduction... 2 Publishing files
Microsoft Access Basics
 Microsoft Access Basics 2006 ipic Development Group, LLC Authored by James D Ballotti Microsoft, Access, Excel, Word, and Office are registered trademarks of the Microsoft Corporation Version 1 - Revision
SPSS: Getting Started. For Windows
 For Windows Updated: August 2012 Table of Contents Section 1: Overview... 3 1.1 Introduction to SPSS Tutorials... 3 1.2 Introduction to SPSS... 3 1.3 Overview of SPSS for Windows... 3 Section 2: Entering
Google Sites: Site Creation and Home Page Design
 Google Sites: Site Creation and Home Page Design This is the second tutorial in the Google Sites series. You should already have your site set up. You should know its URL and your Google Sites Login and
Monthly Payroll to Finance Reconciliation Report: Access and Instructions
 Monthly Payroll to Finance Reconciliation Report: Access and Instructions VCU Reporting Center... 2 Log in... 2 Open Folder... 3 Other Useful Information: Copying Sheets... 5 Creating Subtotals... 5 Outlining
How To Create A Campaign On Facebook.Com
 Seriously powerful email marketing, made easy Table of Contents DOTMAILER QUICK START GUIDE... 3 Main Screen... 4 Getting Started... 6 STEP 1: CAMPAIGN SETTINGS... 7 STEP 2: CAMPAIGN CONTENT... 8 Editing
BIGPOND ONLINE STORAGE USER GUIDE Issue 1.1.0-18 August 2005
 BIGPOND ONLINE STORAGE USER GUIDE Issue 1.1.0-18 August 2005 PLEASE NOTE: The contents of this publication, and any associated documentation provided to you, must not be disclosed to any third party without
Teacher Training Session 1. Adding a Sub-Site (New Page) Editing a page and page security. Adding content cells. Uploading files and creating folders
 Editing a page and page security. Adding content cells. Uploading files and creating folders") Teacher Training Session 1 Adding a Sub-Site (New Page) Editing a page and page security Adding content cells Uploading files and creating folders Adding Sub Sites Sub Sites are the same as Sub Groups
Teacher Training Session 1 Adding a Sub-Site (New Page) Editing a page and page security Adding content cells Uploading files and creating folders Adding Sub Sites Sub Sites are the same as Sub Groups
Kaseya 2. Quick Start Guide. for VSA 6.3
 Kaseya 2 Custom Reports Quick Start Guide for VSA 6.3 December 9, 2013 Agreement The purchase and use of all Software and Services is subject to the Agreement as defined in Kaseya s Click-Accept EULA as
Create a New Database in Access 2010
 Create a New Database in Access 2010 Table of Contents OVERVIEW... 1 CREATING A DATABASE... 1 ADDING TO A DATABASE... 2 CREATE A DATABASE BY USING A TEMPLATE... 2 CREATE A DATABASE WITHOUT USING A TEMPLATE...
MyOra 3.5. User Guide. SQL Tool for Oracle. Kris Murthy
 MyOra 3.5 SQL Tool for Oracle User Guide Kris Murthy Contents Features... 4 Connecting to the Database... 5 Login... 5 Login History... 6 Connection Indicator... 6 Closing the Connection... 7 SQL Editor...
Data exploration with Microsoft Excel: univariate analysis
 Data exploration with Microsoft Excel: univariate analysis Contents 1 Introduction... 1 2 Exploring a variable s frequency distribution... 2 3 Calculating measures of central tendency... 16 4 Calculating
Excel 2003 Tutorial I
 This tutorial was adapted from a tutorial by see its complete version at http://www.fgcu.edu/support/office2000/excel/index.html Excel 2003 Tutorial I Spreadsheet Basics Screen Layout Title bar Menu bar
Login: https://ipfw.edu/c Quick Guide for dotcms & Accessibility November 2014 Training: http://ipfw.edu/training
 dotcms & Accessibility Folders Creating a New Folder Note: All folders showing on menu must have an index page. 1. Right-click the parent folder in which the new folder will reside. 2. Click New > Folder.
How To Create A Powerpoint Intelligence Report In A Pivot Table In A Powerpoints.Com
 Sage 500 ERP Intelligence Reporting Getting Started Guide 27.11.2012 Table of Contents 1.0 Getting started 3 2.0 Managing your reports 10 3.0 Defining report properties 18 4.0 Creating a simple PivotTable
Google Drive Create, Share and Edit Documents Online
 Revision 3 (1-31-2014) Google Drive Create, Share and Edit Documents Online With Google Drive, you can easily create, share, and edit documents online. Here are a few specific things you can do: Convert
All V7 registers support barcode printing, except the Sharp 410/420 1A ROM and that limitation is based upon the register.
 Tools Section Barcode Printing These are basic instructions for Version 7 Polling barcode printing. Users will need to have a PLU/UPC file containing either UPC-A, UPC-E, EAN 13 or EAN 8 numbers, label
DESIGN A WEB SITE USING PUBLISHER Before you begin, plan your Web site
 Page 1 of 22 DESIGN A WEB SITE USING PUBLISHER Before you begin, plan your Web site Before you create your Web site, ask yourself these questions: What do I want the site to do? Whom do I want to visit
user guide This user guide can be used as a whole manual, or sections, depending on the user s access permissions to AgendaOnline.
 user guide This user guide can be used as a whole manual, or sections, depending on the user s access permissions to AgendaOnline. home page...3 General Features... 3 Other Features... 4 navigating agendas...5
Custom Reporting System User Guide
 Citibank Custom Reporting System User Guide April 2012 Version 8.1.1 Transaction Services Citibank Custom Reporting System User Guide Table of Contents Table of Contents User Guide Overview...2 Subscribe
Spreadsheet - Introduction
 CSCA0102 IT and Business Applications Chapter 6 Spreadsheet - Introduction Spreadsheet A spreadsheet (or spreadsheet program) is software that permits numerical data to be used and to perform automatic
Appointment Scheduler
 EZClaim Appointment Scheduler User Guide Last Update: 11/19/2008 Copyright 2008 EZClaim This page intentionally left blank Contents Contents... iii Getting Started... 5 System Requirements... 5 Installing
Chapter 15 Using Forms in Writer
 Writer Guide Chapter 15 Using Forms in Writer OpenOffice.org Copyright This document is Copyright 2005 2006 by its contributors as listed in the section titled Authors. You can distribute it and/or modify
Excel Project Creating a Stock Portfolio Simulation
 Background Vocabulary Excel Project Creating a Stock Portfolio Simulation 1. What is a stock? A stock is a share in the ownership of a corporation, a large business organization. A stock, also, represents
Designing and Implementing Forms 34
 C H A P T E R 34 Designing and Implementing Forms 34 You can add forms to your site to collect information from site visitors; for example, to survey potential customers, conduct credit-card transactions,
Appendix A How to create a data-sharing lab
 Appendix A How to create a data-sharing lab Creating a lab involves completing five major steps: creating lists, then graphs, then the page for lab instructions, then adding forms to the lab instructions,
TIBCO Spotfire Business Author Essentials Quick Reference Guide. Table of contents:
 Table of contents: Access Data for Analysis Data file types Format assumptions Data from Excel Information links Add multiple data tables Create & Interpret Visualizations Table Pie Chart Cross Table Treemap
Microsoft Office Access 2007 Basics
 Access(ing) A Database Project PRESENTED BY THE TECHNOLOGY TRAINERS OF THE MONROE COUNTY LIBRARY SYSTEM EMAIL: [email protected] MONROE COUNTY LIBRARY SYSTEM 734-241-5770 1 840 SOUTH ROESSLER
EXCEL Tutorial: How to use EXCEL for Graphs and Calculations.
 EXCEL Tutorial: How to use EXCEL for Graphs and Calculations. Excel is powerful tool and can make your life easier if you are proficient in using it. You will need to use Excel to complete most of your
WebSphere Business Monitor V6.2 Business space dashboards
 Copyright IBM Corporation 2009 All rights reserved IBM WEBSPHERE BUSINESS MONITOR 6.2 LAB EXERCISE WebSphere Business Monitor V6.2 What this exercise is about... 2 Lab requirements... 2 What you should
Create a GAME PERFORMANCE Portfolio with Microsoft Word
 Create a GAME PERFORMANCE Portfolio with Microsoft Word Planning A good place to start is on paper. Get a sheet of blank paper and just use a pencil to indicate where the content is going to be positioned
ECDL. European Computer Driving Licence. Spreadsheet Software BCS ITQ Level 2. Syllabus Version 5.0
 European Computer Driving Licence Spreadsheet Software BCS ITQ Level 2 Using Microsoft Excel 2010 Syllabus Version 5.0 This training, which has been approved by BCS, The Chartered Institute for IT, includes
Intellicus Enterprise Reporting and BI Platform
 Designing Adhoc Reports Intellicus Enterprise Reporting and BI Platform Intellicus Technologies [email protected] www.intellicus.com Copyright 2013 Intellicus Technologies This document and its content
Topography of an Origin Project and Workspace
 Origin Basics Topography of an Origin Project and Workspace When you start Origin, a new project opens displaying a worksheet window in the workspace. The worksheet is one type of window available in Origin.
How To Change Your Site On Drupal Cloud On A Pcode On A Microsoft Powerstone On A Macbook Or Ipad (For Free) On A Freebie (For A Free Download) On An Ipad Or Ipa (For
 On A Freebie (For A Free Download) On An Ipad Or Ipa (For") How-to Guide: MIT DLC Drupal Cloud Theme This guide will show you how to take your initial Drupal Cloud site... and turn it into something more like this, using the MIT DLC Drupal Cloud theme. See this
How-to Guide: MIT DLC Drupal Cloud Theme This guide will show you how to take your initial Drupal Cloud site... and turn it into something more like this, using the MIT DLC Drupal Cloud theme. See this
Chapter 14: Links. Types of Links. 1 Chapter 14: Links
 1 Unlike a word processor, the pages that you create for a website do not really have any order. You can create as many pages as you like, in any order that you like. The way your website is arranged and
Excel Guide for Finite Mathematics and Applied Calculus
 Excel Guide for Finite Mathematics and Applied Calculus Revathi Narasimhan Kean University A technology guide to accompany Mathematical Applications, 6 th Edition Applied Calculus, 2 nd Edition Calculus:
2/24/2010 ClassApps.com
 SelectSurvey.NET Training Manual This document is intended to be a simple visual guide for non technical users to help with basic survey creation, management and deployment. 2/24/2010 ClassApps.com Getting