MODICOS: Morphometric and Distance Computation Software oriented for evolutionary
|
|
|
- Bridget Walters
- 8 years ago
- Views:
Transcription
1 MODICOS: Morphometric and Distance Computation Software oriented for evolutionary studies. A. Carvajal-Rodríguez (phd) and M. Gandarela Rodríguez Departamento de Bioquímica, Genética e Inmunología, Facultad de Ciencias Universidad de Vigo, VIGO, Spain (acraaj@uvigo.es) ABSTRACT Keywords: Size, shape, quantitative genetic variation. Motivation: In the study of evolution is essential the consideration of quantitative differences as well as qualitative ones. Monitoring quantitative differences within and between populations requires the measurement of specific quantitative traits. Doubtless, size and shape are among such quantitative traits. The use of geometric morphometric techniques allow to distinguish shape and size in a precise and formal way. Hence, geometric morphometric distinguish between global and local changes in shape and also provides for allometry tests. At present there are some few freely available programs that perform morphometric computations, like tpsrelw. However, there is no program which allows for hierarchical structured data (e.g. families and individuals), or performs ANOVA analysis onto morphometric data in order to estimate genetic components of quantitative variation within and between populations. Methods: MODICOS (MOrphometry and DIstance COmputation Software oriented for evolutionary studies) is a computer program with a user-friendly Windows 95/98/2000/NT/XP interface. MODICOS computes some morphometric measures as centroid size, uniform and nonuniform components of shape and use them to calculate estimates of quantitative (heritable)

2 variation both at intra and inter-population level. Specifically, MODICOS computes additive genetic variances of size and shape measurements both for half sib or full sib family design (one way ANOVA) and inter-population differentiation measure Q ST (two way ANOVA). Results: To show the use of MODICOS, a complete analysis (morphometric and genetic) was performed using a sample of two different ecotypes of Littorina saxatilis (rough periwinkle), each with 29 and 30 families respectively, and 3 individuals per family. It seems that the non-uniform shape component is more efficient capturing the effect of natural selection onto the two different ecotypes. Availability: 2
 was performed using a sample of two different ecotypes of Littorina saxatilis (rough")
3 INTRODUCTION The approach of geometric morphometric (Rohlf and Slice, 1990; Bookstein, 1991; Rohlf and Marcus, 1993; Rohlf and Bookstein, 2003) has proved its usefulness in the measure of biological form and the distinction between shape and size of morphological structures (Monteiro, Bordin and Furtado dos Reis, 2000 and references therein). Consequently, geometric morphometric has become increasingly important in genetics and evolutionary biology as suggested by an increasing number of publishing papers using these methods (Arnqvist and Thornhill, 1998; Cavalcanti et al., 1999; Douglas et al., 2001; Klingenberg et al., 2001; Palsson and Gibson, 2004; Carvajal-Rodríguez et al., 2005a). The study of quantitative genetic variation both, within and between populations requires the measurement of specific quantitative traits. Doubtless, size and shape are among such traits. The advantage of geometric morphometric methods is that they allow distinguishing shape and size in a precise and formal way. Hence, geometric morphometric discriminate between global and local changes in shape and also provides for allometry tests. Thus, we will use geometric morphometric techniques for description of orthogonal components of variation, as these capture the major components of variation and are independent of observer bias (Bookstein, 1991). It is worth mentioning that at present there are some few freely available programs that perform morphometric computations, like tpsrelw (Rohlf, 1998). However, as far as we know, there is no program which allows for hierarchical structured data (e.g. families and individuals), or performs ANOVA analysis onto morphometric data in order to estimate genetic components of quantitative variation within and between populations. Measuring the genetic variation contributing to variation in size and shape is crucial if one is interested in predicting trait evolutionary change (Falconer and MacKay, 1996). Furthermore, quantitative genetic variation of size and shape could 3
.")
4 also be a useful tool to detect changes in biodiversity caused by different human induced activities (Carvajal-Rodríguez et al., 2005b). MODICOS (MOrphometry and DIstance COmputation Software oriented for evolutionary studies) performs two kinds of tasks, morphometric and genetics analysis, in a user-friendly and efficient way. For morphometric analysis, the input data consists in a series of n individuals, each represented by a set of p bi-dimensional landmark points, i.e. coordinate pairs x, y (see below). Size and shape measures are calculated from these data using geometric morphometric techniques. The output is written in a text file in a convenient format for posterior analysis with standard statistical packages. Furthermore, the output is also maintained in memory so that the morphometric measures linked to each individual could be immediately used as phenotypes to estimate genetic components of variances at the intra-population (heritabilities) and interpopulation level (Q ST, a dimensionless measure of quantitative genetic variance among populations) under an adequate experimental design. Such design assumes a hierarchical structure of data distributed in populations, families within populations and individuals within families. MODICOS also allows for the genetic analysis of user-provided traits. In this later case each individual in the input file consists in a single phenotypical value rather than a set of points. METHODOLOGY Data Input Two different file formats are allowed. The input file for morphometric analysis should have the header [MODICOS - POINTS] while the input for genetics should have [MODICOS - PHENOTYPES]. Under any of these headers the first individual is identified as three numbers separated with points, e.g identifies population 111, family 1 and individual 0. Under each individual identifier, a column of p landmarks (pairs x, y separated by comma or space) should 4

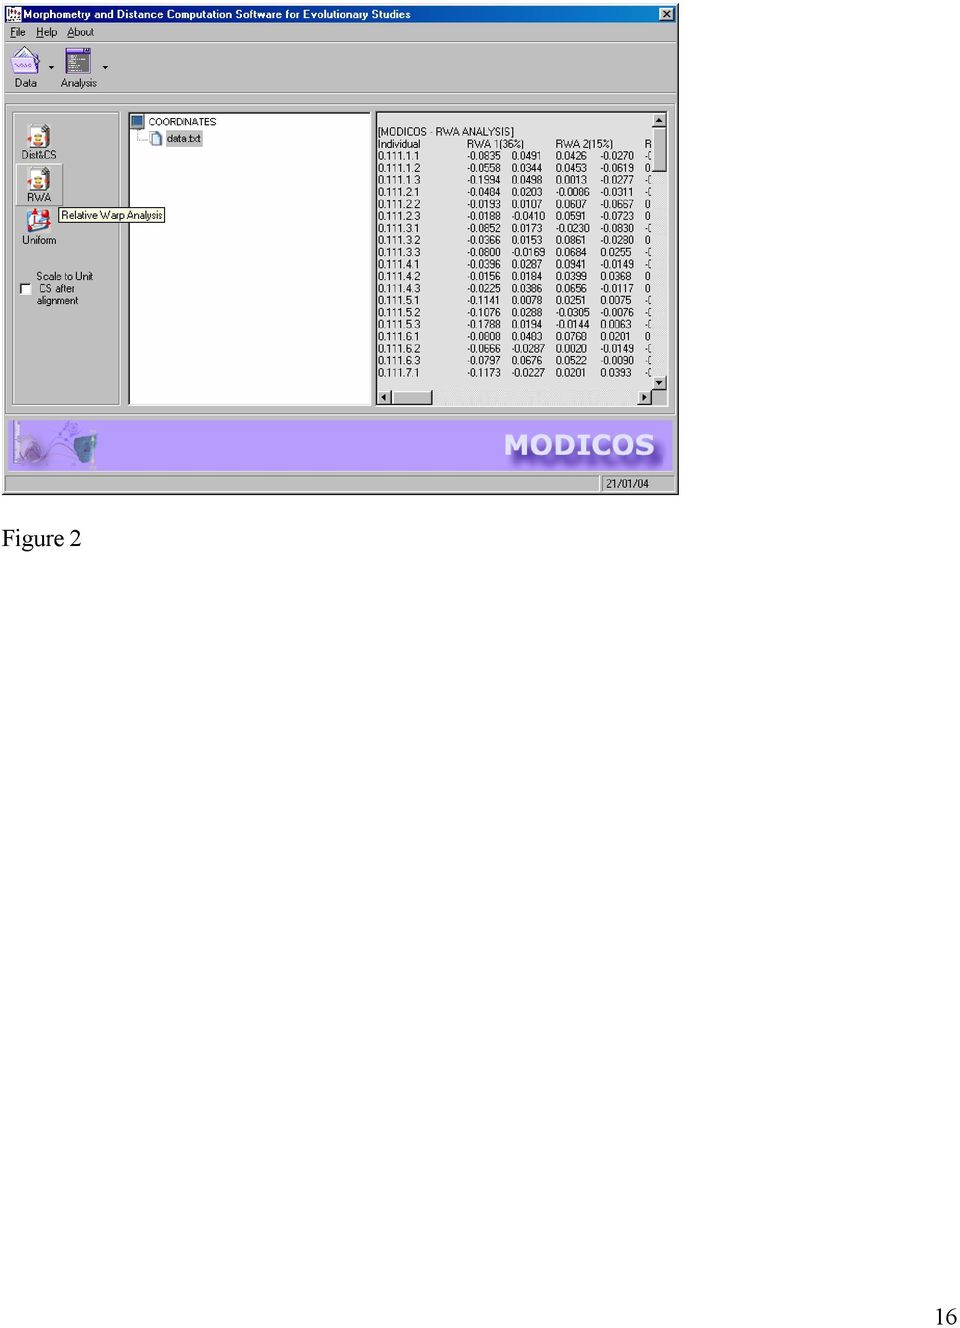
5 follow in the case of a morphometric input file. In the case of genetic input file a single phenotype follows under each individual identifier. After the p landmarks or the single phenotype, the next individual identifier should appear with its corresponding landmarks or single phenotype and so on (see Figure 1). Both, the number of families per population and the number of individuals per family can vary, but the number of landmarks per individual should be constant and higher than three throughout the entire data set. Example input files for both kind of data are available at the online help in the program. Figure 1. Morphometric analysis In the study of form differences, three different components can be considered: centroid size, uniform (affine) and non-uniform (non-affine) shape differences (Rohlf et al., 1996 and references therein). Centroid size is used as the preferred measure of the geometric size of each individual because of its properties of independence with respect to shape variables, when landmark scatter meets the assumption of circular landmark location errors with the same variance at all landmarks (the null model), and there is no allometry. Thus, allometry can be tested via multiple regression of centroid size upon shape variables (Bookstein, 1991). The uniform component of shape describes changes that affect to the whole set of landmarks. In short, the non-uniform component of shape variation describes local deformations in shape. In MODICOS, after choosing the morphometric analysis option, three options are displayed (Figure 2): Distance and Centroid Size, RWA (Relative Warp Analysis) and Uniform. 5

6 Distance and Centroid Size For each individual, the program computes the centroid size and the Euclidean distances between landmarks. Centroid size is computed as the square root of the sum of squared distances of a set of landmarks from their centroid. The output is written in a text file so that rows are individuals, the first column is the individual identifier, the following columns are the distance values, and the last two columns are the centroid and the centroid size. Each individual centroid size remains in memory, so that it can be immediately used as a phenotype for the genetic analysis. RWA (Relative Warp Analysis) Consider the multidimensional non-euclidean space of all possible shapes of configurations of landmark points, this shape space is known as Kendall's shape space. When variation in shape is sufficiently small, Kendall s space can be well-approximated by a Euclidean space tangent to it (Rohlf and Bookstein, 2003 and references therein). This Euclidean space can be decomposed into the direct sum of the uniform and the non-uniform subspaces. Therefore, any given set of p landmarks representing a shape can be expressed as a vector s with 2p - 4 elements so that s = u + b (1) Any vector s of the tangent space (plane) is a sum of a vector u from the uniform subspace and other vector b for the non-uniform subspace. Thus, given a shape, if we have the uniform component we can compute the non-uniform one and viceversa (Rohlf and Bookstein, 2003). RWA, Relative Warp Analysis uses thin-plate spline technique (Bookstein, 1991; Rohlf, 1993) to capture the non-uniform shape variation. The relative warps are principal components of the distribution of shapes in the tangent space and they are computed following the algorithm given in Rohlf (1993, 1998). For each individual we obtain a relative warp vector of dimension min {2(p - 6

7 3), n -1}, where n is the number of measured objects. Thus, the major axes of variation are captured as relative warps which provide orthogonal descriptors of some fraction of the variation. Uniform The uniform shape component is computed using the complement of the space of pure bending shape variation (Rohlf and Bookstein, 2003). For each individual, a vector of two uncorrelated components is obtained. The results from the RWA and Uniform analyses are written into a file in a format similar to that of the Euclidean distances and centroid size (see above). Again, results are maintained in memory so they can be used in a genetic analysis. In the case of RWA two files, RC.dat and R.dat, are also written with the reference configuration and relative warp loadings matrices respectively (see Rohlf, 1993 for an explanation on relative warp loadings and graphical representation of shape variation). These matrices allow for the graphical representation of the importance of each landmark for the deviation from the reference configuration of the sample. Figure 2. Genetic analysis Geometric morphometric can be combined with quantitative genetic methods to estimate components of genetic variation for quantitative traits such as size and shape (Palsson and Gibson, 2004). After pushing the genetic analysis button, two options are displayed: Halfsib and Fullsib, referring to the family design used for the estimation of components of genetic variation. MODICOS makes a population partition of morphometric measurements (phenotypes) in terms of 7
.")
8 quantitative genetics. In quantitative traits the total variance (phenotypic variance, V P ) is partitioned as follows V P = V G + V E (2) where V G is the genetic variance and V E is the environmental variance. The genetic variance is also partitioned in additive, dominance and interaction components. The phenotypic resemblance between relatives (variance between families, θ 2 fam) can be used to estimate the additive genetic variance components (V A ) using both, fullsib (θ 2 fam V A /2) or halfsib (θ 2 fam = V A /4) designs (Falconer and Mackay, 1996). This additive genetic variance computation is performed within each population via one-factor ANOVA since the between-family variance component θ 2 fam is equal to the covariance of the family members (Falconer and Mackay, 1996). There are other possible more complex designs but field data usually comes in these two fashions. In MODICOS, centroid size or any relative warp or uniform component can be used as a phenotype to compute V A estimates. The estimated V A variance (averaged across populations) is also the within-population variance component, and jointly with the between component (V b ), allows for the Q ST computation in a two factor (population, family) nested ANOVA (Spitze, 1993) as Q ST = V b / (V b + 2V A ) (3). VALIDATION AND RESULTS To check the morphometric computations in MODICOS some freely available software was used: Morpheus (Slice, 1993) was used to check the Procrustes Superimposition (necessary for shape analyses) and tpsrelw (Rohlf, 1998) to check procedures of shape analysis (relative warp and uniform procedures). In all cases the output of MODICOS was almost identical (up to 4th or 5th 8
 can be used to estimate the additive genetic variance components (V A ) using both, fullsib (θ 2 fam V A /2) or")
9 decimal position) to that of the programs above. Genetic computations as ANOVAS, heritability and QST were checked both by hand and using standard statistical packages. To show the use of MODICOS, a complete analysis (morphometric and genetic) was performed using a sample of two different ecotypes of Littorina saxatilis (rough periwinkle), each with 29 and 30 families respectively, and 3 individuals per family. Previous work has shown significant genetic variability at different shore levels for shell height (Carballo et al., 2001). Now we considered shell size using centroid size and shell shape via the global component i.e. the two (x and y) uniform shape phenotypes and the local component (the relative warps). Each individual consists of a configuration of 12 landmarks (Figure 3). Images of individuals were digitized using an image analyzer and a binocular. For the genetic analysis we compared the inter-population genetic variance estimates for the centroid size phenotype, the two uniform shape phenotypes and the two first relative warps. The selected design for the genetic analysis was the full-sib one. Figure 3 The inter-population genetic analysis gave significant differences for centroid size, the first uniform component and the two first relative warps (Table 1). Interestingly, the Q ST estimate is higher (as far as twice) for the relative warps than for size and the uniform component. Since allometry was no detected, neither for the uniform component nor for the two relative warps, the higher Q ST value seems to indicate that the non-uniform shape component is more efficient capturing the effect of natural selection onto the two different ecotypes. This kind of effect is better visualized in a graphical way using the scaled scores for the two first relative warps providing an 9
 uniform shape phenotypes and the local component (the relative warps).")
10 ordination space (Rohlf 1993). For an example of the later see Figures 3 and 4 in Carvajal- Rodríguez et al (2005a). Table 1. CONCLUSION MODICOS is a computer program with user-friendly Windows 95/98/2000/NT/XP interface. It has a friendly on-line help interface with detailed information on input formats, output, methods and program features. By running MODICOS users can perform morphometric analysis onto a data set, getting for each individual one quantitative trait phenotype as is centroid size, two more phenotypes as uniform components of shape variation and, in the case of, say, using 12 landmarks, up to 18 phenotypes of local components of shape variation. All these phenotypes can be immediately used to estimate heritable genetic variance components within and between populations. As shown via the example above, it could be of interest to consider shape separated from size in inter-population quantitative genetic analysis. 10

11 REFERENCES Arqvinst, G. and Thornhill, R. (1998). Evolution of animal genitalia: patterns of phenotypic and genotypic variation and condition dependence of genital and non-genital morphology in water strider (Heteroptera: Gerridae: Insecta). Genet. Res., 71, Bookstein, FL. (1991). Morphometric tools for landmark data. Cambridge University Press. Carballo, M., Garcia, C. and Rolán-Alvarez, E. (2001). Heritability of shell traits in wild Littorina saxatilis populations: results across a hybrid zone. Journal of shellfish research, 20, Carvajal-Rodríguez, A., Conde-Padín, P. and Rolán-Alvarez, E. (2005a). Decomposing shell form into size and shape by geometric morphometric methods in two sympatric ecotypes of Littorina saxatilis. Journal of Molluscan Studies. In Press. Carvajal-Rodríguez, A., Rolán-Álvarez, E. and Caballero, A. (2005b). Quantitative variation as a tool for detecting human-induced impacts on genetic diversity. Biological Conservation. In Press. Cavalcanti, MJ., Monteiro, RL. and Lopes, PRD. (1999). Landmark-based morphometric analysis in selected species of serranid fishes (Perciformes: Teleostei). Zoological Studies, 38, Douglas, ME., Douglas, MR., Lynch, JM. and McElroy, DM. (2001). Use of geometric morphometrics to differentiate Gila (Cyprinidae) within the upper Colorado river basin. Copeia, 2, Falconer, DS. and MacKay, TFC. (1996). Introduction to quantitative genetics. Longman, Essex. Klingenberg, CP., Leamy, LJ., Routman, EJ. and Cheverud, JM. (2001). Genetic architecture of mandible shape in mice: effects of quantitative trait loci analyzed by geometric morphometrics. Genetics, 157,

12 McKay, J.K. and Latta, R.G. (2002). Adaptive population divergence: markers, QTL and traits. Trends Ecol. Evol., 17, Monteiro, RL., Bordin, B. and Furtado dos Reis, S. (2000). Shape distances, shape spaces and the comparison of morphometric methods. TREE, 15(6), Palsson, A. and Gibson, G. (2004). Association between nucleotide variation in Egfr and wing shape in Drosophila melanogaster. Genetics, 167, Rohlf, FJ. (1993). Relative warp analysis and an example of its application to mosquito wings. Pages in Contributions to morphometrics, volume 8 (L.F Marcus, E. Bello and A. García Valdecasas, eds.). Museo Nacional de Ciencias Naturales, Madrid. Rohlf, FJ. (1998). TPSrelw: relative warps, version N.Y.: State Univ. at Stony Brook. Rohlf, FJ., Loy, A. and Corti, M. (1996). Morphometric analysis of old world Talpidae (Mammalia, Insectivora) using partial-warp scores. Systematic Biology, 45(3), Rohlf, FJ. and Bookstein, FL. (2003). Computing the uniform component of shape variation. Systematic Biology, 52(1), Rohlf, FJ. and Marcus, LF. (1993). A revolution in morphometrics. TREE, 8, Rohlf, FJ. and Slice, D. (1990). Extensions of the Procustes method for the optimal superimposition of landmarks. Syst. Zool, 39, Slice, D. (1993). Morpheus et al. N.Y.: State University at Stony Brook. Spitze, K. (1993). Population structure in Daphnia obtusa: Quantitative genetic and allozymic variation. Genetics, 135, Wright, S. (1951). The genetic structure of populations. Annu. Eugenics, 15, Acknowledgements 12
.")
13 We wish to thanks Emilio Rolán-Alvarez for comments on the manuscript and also the original idea from which MODICOS arise. Professor Rohlf F.J provided very useful comments for the debugging work of Procrustes superimposition and RWA algorithm implementations. Conde-Padín kindly gave her data for the example. Thanks also to D. Posada for English corrections. Some freely available software was used to check morphometric computations in MODICOS: Morpheus (Slice, 1993) and tpsrelw (Rohlf, 1998). This work is part of Eumar european biodiversity project (EUK3-CT ). 13
 and tpsrelw (Rohlf, 1998).")
14 CAPTION TO FIGURES Figure 1. Morphometric data file format used in MODICOS: The first individual identifier, , represents population 111, family 1 and individual 0; is the individual 1 from same population and family. The pairs separated by commas under each individual identifier are the coordinate points of each individual configuration. Figure 2. Screen shots of Morphometric analysis window. Figure 3. Distribution of landmark points for the morphometric analysis used in Littorina saxatilis. 14

15 FIGURES [MODICOS - POINTS] , , , , , , , , , , , ,539 Figure 1 15

16 Figure 2 16
17 Figure 3 17

18 TABLE Table 1. Result of two factor nested ANOVA in Q ST computation for the phenotypes: centroid size (CS), uniform components of shape (U1 and U2) and first two relative warps (RW1 and RW2). Phenotype F among populations QST CS 30.2 *** 0.26 U *** 0.26 U ns 0.0 RW *** 0.60 RW ***
. Phenotype F among populations QST CS 30.2 *** 0.")
MORPHOJ: an integrated software package for geometric morphometrics
 Molecular Ecology Resources (2011) 11, 353 357 doi: 10.1111/j.1755-0998.2010.02924.x COMPUTER PROGRAM NOTE MORPHOJ: an integrated software package for geometric morphometrics CHRISTIAN PETER KLINGENBERG
Dimensionality Reduction: Principal Components Analysis
 Dimensionality Reduction: Principal Components Analysis In data mining one often encounters situations where there are a large number of variables in the database. In such situations it is very likely
Multivariate Analysis of Ecological Data
 Multivariate Analysis of Ecological Data MICHAEL GREENACRE Professor of Statistics at the Pompeu Fabra University in Barcelona, Spain RAUL PRIMICERIO Associate Professor of Ecology, Evolutionary Biology
Course Text. Required Computing Software. Course Description. Course Objectives. StraighterLine. Business Statistics
 Course Text Business Statistics Lind, Douglas A., Marchal, William A. and Samuel A. Wathen. Basic Statistics for Business and Economics, 7th edition, McGraw-Hill/Irwin, 2010, ISBN: 9780077384470 [This
Data Mining: Exploring Data. Lecture Notes for Chapter 3. Introduction to Data Mining
 Data Mining: Exploring Data Lecture Notes for Chapter 3 Introduction to Data Mining by Tan, Steinbach, Kumar Tan,Steinbach, Kumar Introduction to Data Mining 8/05/2005 1 What is data exploration? A preliminary
Medical Information Management & Mining. You Chen Jan,15, 2013 You.chen@vanderbilt.edu
 Medical Information Management & Mining You Chen Jan,15, 2013 You.chen@vanderbilt.edu 1 Trees Building Materials Trees cannot be used to build a house directly. How can we transform trees to building materials?
COM CO P 5318 Da t Da a t Explora Explor t a ion and Analysis y Chapte Chapt r e 3
 COMP 5318 Data Exploration and Analysis Chapter 3 What is data exploration? A preliminary exploration of the data to better understand its characteristics. Key motivations of data exploration include Helping
Business Statistics. Successful completion of Introductory and/or Intermediate Algebra courses is recommended before taking Business Statistics.
 Business Course Text Bowerman, Bruce L., Richard T. O'Connell, J. B. Orris, and Dawn C. Porter. Essentials of Business, 2nd edition, McGraw-Hill/Irwin, 2008, ISBN: 978-0-07-331988-9. Required Computing
Iris Sample Data Set. Basic Visualization Techniques: Charts, Graphs and Maps. Summary Statistics. Frequency and Mode
 Iris Sample Data Set Basic Visualization Techniques: Charts, Graphs and Maps CS598 Information Visualization Spring 2010 Many of the exploratory data techniques are illustrated with the Iris Plant data
15.062 Data Mining: Algorithms and Applications Matrix Math Review
 .6 Data Mining: Algorithms and Applications Matrix Math Review The purpose of this document is to give a brief review of selected linear algebra concepts that will be useful for the course and to develop
How to Explore Morphological Integration in Human Evolution and Development?
 Evol Biol (2012) 39:536 553 DOI 10.1007/s11692-012-9178-3 SYNTHESIS PAPER How to Explore Morphological Integration in Human Evolution and Development? Philipp Mitteroecker Philipp Gunz Simon Neubauer Gerd
Logistic Regression (1/24/13)
") STA63/CBB540: Statistical methods in computational biology Logistic Regression (/24/3) Lecturer: Barbara Engelhardt Scribe: Dinesh Manandhar Introduction Logistic regression is model for regression used
STA63/CBB540: Statistical methods in computational biology Logistic Regression (/24/3) Lecturer: Barbara Engelhardt Scribe: Dinesh Manandhar Introduction Logistic regression is model for regression used
Data Mining Clustering (2) Sheets are based on the those provided by Tan, Steinbach, and Kumar. Introduction to Data Mining
 Sheets are based on the those provided by Tan, Steinbach, and Kumar. Introduction to Data Mining") Data Mining Clustering (2) Toon Calders Sheets are based on the those provided by Tan, Steinbach, and Kumar. Introduction to Data Mining Outline Partitional Clustering Distance-based K-means, K-medoids,
Data Mining Clustering (2) Toon Calders Sheets are based on the those provided by Tan, Steinbach, and Kumar. Introduction to Data Mining Outline Partitional Clustering Distance-based K-means, K-medoids,
Introduction to General and Generalized Linear Models
 Introduction to General and Generalized Linear Models General Linear Models - part I Henrik Madsen Poul Thyregod Informatics and Mathematical Modelling Technical University of Denmark DK-2800 Kgs. Lyngby
Subspace Analysis and Optimization for AAM Based Face Alignment
 Subspace Analysis and Optimization for AAM Based Face Alignment Ming Zhao Chun Chen College of Computer Science Zhejiang University Hangzhou, 310027, P.R.China zhaoming1999@zju.edu.cn Stan Z. Li Microsoft
Recall that two vectors in are perpendicular or orthogonal provided that their dot
 Orthogonal Complements and Projections Recall that two vectors in are perpendicular or orthogonal provided that their dot product vanishes That is, if and only if Example 1 The vectors in are orthogonal
Least Squares Estimation
 Least Squares Estimation SARA A VAN DE GEER Volume 2, pp 1041 1045 in Encyclopedia of Statistics in Behavioral Science ISBN-13: 978-0-470-86080-9 ISBN-10: 0-470-86080-4 Editors Brian S Everitt & David
AP Biology Essential Knowledge Student Diagnostic
 AP Biology Essential Knowledge Student Diagnostic Background The Essential Knowledge statements provided in the AP Biology Curriculum Framework are scientific claims describing phenomenon occurring in
Data Exploration Data Visualization
 Data Exploration Data Visualization What is data exploration? A preliminary exploration of the data to better understand its characteristics. Key motivations of data exploration include Helping to select
α = u v. In other words, Orthogonal Projection
 Orthogonal Projection Given any nonzero vector v, it is possible to decompose an arbitrary vector u into a component that points in the direction of v and one that points in a direction orthogonal to v
DISCRIMINANT FUNCTION ANALYSIS (DA)
") DISCRIMINANT FUNCTION ANALYSIS (DA) John Poulsen and Aaron French Key words: assumptions, further reading, computations, standardized coefficents, structure matrix, tests of signficance Introduction Discriminant
DISCRIMINANT FUNCTION ANALYSIS (DA) John Poulsen and Aaron French Key words: assumptions, further reading, computations, standardized coefficents, structure matrix, tests of signficance Introduction Discriminant
0.1 What is Cluster Analysis?
 Cluster Analysis 1 2 0.1 What is Cluster Analysis? Cluster analysis is concerned with forming groups of similar objects based on several measurements of different kinds made on the objects. The key idea
Data Analysis Tools. Tools for Summarizing Data
 Data Analysis Tools This section of the notes is meant to introduce you to many of the tools that are provided by Excel under the Tools/Data Analysis menu item. If your computer does not have that tool
Data Mining: Exploring Data. Lecture Notes for Chapter 3. Introduction to Data Mining
 Data Mining: Exploring Data Lecture Notes for Chapter 3 Introduction to Data Mining by Tan, Steinbach, Kumar What is data exploration? A preliminary exploration of the data to better understand its characteristics.
Additional sources Compilation of sources: http://lrs.ed.uiuc.edu/tseportal/datacollectionmethodologies/jin-tselink/tselink.htm
 Mgt 540 Research Methods Data Analysis 1 Additional sources Compilation of sources: http://lrs.ed.uiuc.edu/tseportal/datacollectionmethodologies/jin-tselink/tselink.htm http://web.utk.edu/~dap/random/order/start.htm
Simulation Model of Mating Behavior in Flies
 Simulation Model of Mating Behavior in Flies MEHMET KAYIM & AYKUT Ecological and Evolutionary Genetics Lab. Department of Biology, Middle East Technical University International Workshop on Hybrid Systems
Data Mining Cluster Analysis: Basic Concepts and Algorithms. Lecture Notes for Chapter 8. Introduction to Data Mining
 Data Mining Cluster Analysis: Basic Concepts and Algorithms Lecture Notes for Chapter 8 Introduction to Data Mining by Tan, Steinbach, Kumar Tan,Steinbach, Kumar Introduction to Data Mining 4/8/2004 Hierarchical
Orthogonal Projections
 Orthogonal Projections and Reflections (with exercises) by D. Klain Version.. Corrections and comments are welcome! Orthogonal Projections Let X,..., X k be a family of linearly independent (column) vectors
Linear Codes. Chapter 3. 3.1 Basics
 Chapter 3 Linear Codes In order to define codes that we can encode and decode efficiently, we add more structure to the codespace. We shall be mainly interested in linear codes. A linear code of length
GENOMIC SELECTION: THE FUTURE OF MARKER ASSISTED SELECTION AND ANIMAL BREEDING
 GENOMIC SELECTION: THE FUTURE OF MARKER ASSISTED SELECTION AND ANIMAL BREEDING Theo Meuwissen Institute for Animal Science and Aquaculture, Box 5025, 1432 Ås, Norway, theo.meuwissen@ihf.nlh.no Summary
They can be obtained in HQJHQH format directly from the home page at: http://www.engene.cnb.uam.es/downloads/kobayashi.dat
 HQJHQH70 *XLGHG7RXU This document contains a Guided Tour through the HQJHQH platform and it was created for training purposes with respect to the system options and analysis possibilities. It is not intended
The Method of Least Squares
 Hervé Abdi 1 1 Introduction The least square methods (LSM) is probably the most popular technique in statistics. This is due to several factors. First, most common estimators can be casted within this
DnaSP, DNA polymorphism analyses by the coalescent and other methods.
 DnaSP, DNA polymorphism analyses by the coalescent and other methods. Author affiliation: Julio Rozas 1, *, Juan C. Sánchez-DelBarrio 2,3, Xavier Messeguer 2 and Ricardo Rozas 1 1 Departament de Genètica,
Why Taking This Course? Course Introduction, Descriptive Statistics and Data Visualization. Learning Goals. GENOME 560, Spring 2012
 Why Taking This Course? Course Introduction, Descriptive Statistics and Data Visualization GENOME 560, Spring 2012 Data are interesting because they help us understand the world Genomics: Massive Amounts
STATISTICA. Clustering Techniques. Case Study: Defining Clusters of Shopping Center Patrons. and
 Clustering Techniques and STATISTICA Case Study: Defining Clusters of Shopping Center Patrons STATISTICA Solutions for Business Intelligence, Data Mining, Quality Control, and Web-based Analytics Table
CS3220 Lecture Notes: QR factorization and orthogonal transformations
 CS3220 Lecture Notes: QR factorization and orthogonal transformations Steve Marschner Cornell University 11 March 2009 In this lecture I ll talk about orthogonal matrices and their properties, discuss
Model Selection. Introduction. Model Selection
 Model Selection Introduction This user guide provides information about the Partek Model Selection tool. Topics covered include using a Down syndrome data set to demonstrate the usage of the Partek Model
Section 1.1. Introduction to R n
 The Calculus of Functions of Several Variables Section. Introduction to R n Calculus is the study of functional relationships and how related quantities change with each other. In your first exposure to
EM Clustering Approach for Multi-Dimensional Analysis of Big Data Set
 EM Clustering Approach for Multi-Dimensional Analysis of Big Data Set Amhmed A. Bhih School of Electrical and Electronic Engineering Princy Johnson School of Electrical and Electronic Engineering Martin
The primary goal of this thesis was to understand how the spatial dependence of
 5 General discussion 5.1 Introduction The primary goal of this thesis was to understand how the spatial dependence of consumer attitudes can be modeled, what additional benefits the recovering of spatial
Common factor analysis
 Common factor analysis This is what people generally mean when they say "factor analysis" This family of techniques uses an estimate of common variance among the original variables to generate the factor
18.06 Problem Set 4 Solution Due Wednesday, 11 March 2009 at 4 pm in 2-106. Total: 175 points.
 806 Problem Set 4 Solution Due Wednesday, March 2009 at 4 pm in 2-06 Total: 75 points Problem : A is an m n matrix of rank r Suppose there are right-hand-sides b for which A x = b has no solution (a) What
Exploratory data analysis for microarray data
 Eploratory data analysis for microarray data Anja von Heydebreck Ma Planck Institute for Molecular Genetics, Dept. Computational Molecular Biology, Berlin, Germany heydebre@molgen.mpg.de Visualization
For example, estimate the population of the United States as 3 times 10⁸ and the
 CCSS: Mathematics The Number System CCSS: Grade 8 8.NS.A. Know that there are numbers that are not rational, and approximate them by rational numbers. 8.NS.A.1. Understand informally that every number
Data Mining: Exploring Data. Lecture Notes for Chapter 3. Slides by Tan, Steinbach, Kumar adapted by Michael Hahsler
 Data Mining: Exploring Data Lecture Notes for Chapter 3 Slides by Tan, Steinbach, Kumar adapted by Michael Hahsler Topics Exploratory Data Analysis Summary Statistics Visualization What is data exploration?
CLUSTER ANALYSIS. Kingdom Phylum Subphylum Class Order Family Genus Species. In economics, cluster analysis can be used for data mining.
 CLUSTER ANALYSIS Introduction Cluster analysis is a technique for grouping individuals or objects hierarchically into unknown groups suggested by the data. Cluster analysis can be considered an alternative
Introduction to Principal Components and FactorAnalysis
 Introduction to Principal Components and FactorAnalysis Multivariate Analysis often starts out with data involving a substantial number of correlated variables. Principal Component Analysis (PCA) is a
Accurate and robust image superresolution by neural processing of local image representations
 Accurate and robust image superresolution by neural processing of local image representations Carlos Miravet 1,2 and Francisco B. Rodríguez 1 1 Grupo de Neurocomputación Biológica (GNB), Escuela Politécnica
Standardization and Its Effects on K-Means Clustering Algorithm
 Research Journal of Applied Sciences, Engineering and Technology 6(7): 399-3303, 03 ISSN: 040-7459; e-issn: 040-7467 Maxwell Scientific Organization, 03 Submitted: January 3, 03 Accepted: February 5, 03
CHAPTER 8 FACTOR EXTRACTION BY MATRIX FACTORING TECHNIQUES. From Exploratory Factor Analysis Ledyard R Tucker and Robert C.
 CHAPTER 8 FACTOR EXTRACTION BY MATRIX FACTORING TECHNIQUES From Exploratory Factor Analysis Ledyard R Tucker and Robert C MacCallum 1997 180 CHAPTER 8 FACTOR EXTRACTION BY MATRIX FACTORING TECHNIQUES In
Geometric morphometrics
 Geometric morphometrics An introduction P. David Polly Department of Geology, Indiana (Biology and Anthropology) University, 1001 E. 10th Street, Bloomington, IN 47405, USA pdpolly@indiana.edu http://mypage.iu.edu/~pdpolly/
3. INNER PRODUCT SPACES
 . INNER PRODUCT SPACES.. Definition So far we have studied abstract vector spaces. These are a generalisation of the geometric spaces R and R. But these have more structure than just that of a vector space.
Graph/Network Visualization
 Graph/Network Visualization Data model: graph structures (relations, knowledge) and networks. Applications: Telecommunication systems, Internet and WWW, Retailers distribution networks knowledge representation
How To Cluster
 Data Clustering Dec 2nd, 2013 Kyrylo Bessonov Talk outline Introduction to clustering Types of clustering Supervised Unsupervised Similarity measures Main clustering algorithms k-means Hierarchical Main
Inner Product Spaces and Orthogonality
 Inner Product Spaces and Orthogonality week 3-4 Fall 2006 Dot product of R n The inner product or dot product of R n is a function, defined by u, v a b + a 2 b 2 + + a n b n for u a, a 2,, a n T, v b,
THE ALGORITHMIC AUDITORIUM. A computational model for auditorium design. 1. Introduction
 THE ALGORITHMIC AUDITORIUM A computational model for auditorium design GANAPATHY MAHALINGAM Department of Architecture and Landscape Architecture North Dakota State University Fargo, North Dakota USA Abstract.
Computer program review
 Journal of Vegetation Science 16: 355-359, 2005 IAVS; Opulus Press Uppsala. - Ginkgo, a multivariate analysis package - 355 Computer program review Ginkgo, a multivariate analysis package Bouxin, Guy Haute
AP: LAB 8: THE CHI-SQUARE TEST. Probability, Random Chance, and Genetics
 Ms. Foglia Date AP: LAB 8: THE CHI-SQUARE TEST Probability, Random Chance, and Genetics Why do we study random chance and probability at the beginning of a unit on genetics? Genetics is the study of inheritance,
Chapter 7. Lyapunov Exponents. 7.1 Maps
 Chapter 7 Lyapunov Exponents Lyapunov exponents tell us the rate of divergence of nearby trajectories a key component of chaotic dynamics. For one dimensional maps the exponent is simply the average
Joint models for classification and comparison of mortality in different countries.
 Joint models for classification and comparison of mortality in different countries. Viani D. Biatat 1 and Iain D. Currie 1 1 Department of Actuarial Mathematics and Statistics, and the Maxwell Institute
Clustering. Chapter 7. 7.1 Introduction to Clustering Techniques. 7.1.1 Points, Spaces, and Distances
 240 Chapter 7 Clustering Clustering is the process of examining a collection of points, and grouping the points into clusters according to some distance measure. The goal is that points in the same cluster
Tutorial on Exploratory Data Analysis
 Tutorial on Exploratory Data Analysis Julie Josse, François Husson, Sébastien Lê julie.josse at agrocampus-ouest.fr francois.husson at agrocampus-ouest.fr Applied Mathematics Department, Agrocampus Ouest
Performance Level Descriptors Grade 6 Mathematics
 Performance Level Descriptors Grade 6 Mathematics Multiplying and Dividing with Fractions 6.NS.1-2 Grade 6 Math : Sub-Claim A The student solves problems involving the Major Content for grade/course with
CONTROLLABILITY. Chapter 2. 2.1 Reachable Set and Controllability. Suppose we have a linear system described by the state equation
 Chapter 2 CONTROLLABILITY 2 Reachable Set and Controllability Suppose we have a linear system described by the state equation ẋ Ax + Bu (2) x() x Consider the following problem For a given vector x in
STATISTICAL ANALYSIS OF UBC FACULTY SALARIES: INVESTIGATION OF
 STATISTICAL ANALYSIS OF UBC FACULTY SALARIES: INVESTIGATION OF DIFFERENCES DUE TO SEX OR VISIBLE MINORITY STATUS. Oxana Marmer and Walter Sudmant, UBC Planning and Institutional Research SUMMARY This paper
D-optimal plans in observational studies
 D-optimal plans in observational studies Constanze Pumplün Stefan Rüping Katharina Morik Claus Weihs October 11, 2005 Abstract This paper investigates the use of Design of Experiments in observational
2. Simple Linear Regression
 Research methods - II 3 2. Simple Linear Regression Simple linear regression is a technique in parametric statistics that is commonly used for analyzing mean response of a variable Y which changes according
business statistics using Excel OXFORD UNIVERSITY PRESS Glyn Davis & Branko Pecar
 business statistics using Excel Glyn Davis & Branko Pecar OXFORD UNIVERSITY PRESS Detailed contents Introduction to Microsoft Excel 2003 Overview Learning Objectives 1.1 Introduction to Microsoft Excel
Solving Simultaneous Equations and Matrices
 Solving Simultaneous Equations and Matrices The following represents a systematic investigation for the steps used to solve two simultaneous linear equations in two unknowns. The motivation for considering
Common Core Unit Summary Grades 6 to 8
 Common Core Unit Summary Grades 6 to 8 Grade 8: Unit 1: Congruence and Similarity- 8G1-8G5 rotations reflections and translations,( RRT=congruence) understand congruence of 2 d figures after RRT Dilations
INDISTINGUISHABILITY OF ABSOLUTELY CONTINUOUS AND SINGULAR DISTRIBUTIONS
 INDISTINGUISHABILITY OF ABSOLUTELY CONTINUOUS AND SINGULAR DISTRIBUTIONS STEVEN P. LALLEY AND ANDREW NOBEL Abstract. It is shown that there are no consistent decision rules for the hypothesis testing problem
Assessment. Presenter: Yupu Zhang, Guoliang Jin, Tuo Wang Computer Vision 2008 Fall
 Automatic Photo Quality Assessment Presenter: Yupu Zhang, Guoliang Jin, Tuo Wang Computer Vision 2008 Fall Estimating i the photorealism of images: Distinguishing i i paintings from photographs h Florin
1816 IEEE TRANSACTIONS ON IMAGE PROCESSING, VOL. 15, NO. 7, JULY 2006. Principal Components Null Space Analysis for Image and Video Classification
 1816 IEEE TRANSACTIONS ON IMAGE PROCESSING, VOL. 15, NO. 7, JULY 2006 Principal Components Null Space Analysis for Image and Video Classification Namrata Vaswani, Member, IEEE, and Rama Chellappa, Fellow,
Review Jeopardy. Blue vs. Orange. Review Jeopardy
 Review Jeopardy Blue vs. Orange Review Jeopardy Jeopardy Round Lectures 0-3 Jeopardy Round $200 How could I measure how far apart (i.e. how different) two observations, y 1 and y 2, are from each other?
Multivariate Analysis of Variance. The general purpose of multivariate analysis of variance (MANOVA) is to determine
 is to determine") 2 - Manova 4.3.05 25 Multivariate Analysis of Variance What Multivariate Analysis of Variance is The general purpose of multivariate analysis of variance (MANOVA) is to determine whether multiple levels
2 - Manova 4.3.05 25 Multivariate Analysis of Variance What Multivariate Analysis of Variance is The general purpose of multivariate analysis of variance (MANOVA) is to determine whether multiple levels
Eladio J. Márquez. Current Appointment. Past Appointments. The Jackson Laboratory for Genomic Medicine Ten Discovery Drive Farmington, CT 06032-2352
 Eladio J. Márquez The Jackson Laboratory for Genomic Medicine Ten Discovery Drive Farmington, CT 06032-2352 E-mail: Phone: (860) 837-2354 Website: www-personal.umich.edu/~emarquez Updated November 2014
Linear Threshold Units
 Linear Threshold Units w x hx (... w n x n w We assume that each feature x j and each weight w j is a real number (we will relax this later) We will study three different algorithms for learning linear
Chapter 6: The Information Function 129. CHAPTER 7 Test Calibration
 Chapter 6: The Information Function 129 CHAPTER 7 Test Calibration 130 Chapter 7: Test Calibration CHAPTER 7 Test Calibration For didactic purposes, all of the preceding chapters have assumed that the
Data Visualization Techniques
 Data Visualization Techniques From Basics to Big Data with SAS Visual Analytics WHITE PAPER SAS White Paper Table of Contents Introduction.... 1 Generating the Best Visualizations for Your Data... 2 The
Exploratory data analysis (Chapter 2) Fall 2011
 Fall 2011") Exploratory data analysis (Chapter 2) Fall 2011 Data Examples Example 1: Survey Data 1 Data collected from a Stat 371 class in Fall 2005 2 They answered questions about their: gender, major, year in school,
Exploratory data analysis (Chapter 2) Fall 2011 Data Examples Example 1: Survey Data 1 Data collected from a Stat 371 class in Fall 2005 2 They answered questions about their: gender, major, year in school,
Data, Measurements, Features
 Data, Measurements, Features Middle East Technical University Dep. of Computer Engineering 2009 compiled by V. Atalay What do you think of when someone says Data? We might abstract the idea that data are
Statistical Data Mining. Practical Assignment 3 Discriminant Analysis and Decision Trees
 Statistical Data Mining Practical Assignment 3 Discriminant Analysis and Decision Trees In this practical we discuss linear and quadratic discriminant analysis and tree-based classification techniques.
Homework 11. Part 1. Name: Score: / null
 Name: Score: / Homework 11 Part 1 null 1 For which of the following correlations would the data points be clustered most closely around a straight line? A. r = 0.50 B. r = -0.80 C. r = 0.10 D. There is
State of Stress at Point
 State of Stress at Point Einstein Notation The basic idea of Einstein notation is that a covector and a vector can form a scalar: This is typically written as an explicit sum: According to this convention,
What is Visualization? Information Visualization An Overview. Information Visualization. Definitions
 What is Visualization? Information Visualization An Overview Jonathan I. Maletic, Ph.D. Computer Science Kent State University Visualize/Visualization: To form a mental image or vision of [some
2013 MBA Jump Start Program. Statistics Module Part 3
 2013 MBA Jump Start Program Module 1: Statistics Thomas Gilbert Part 3 Statistics Module Part 3 Hypothesis Testing (Inference) Regressions 2 1 Making an Investment Decision A researcher in your firm just
A Toolbox for Bicluster Analysis in R
 Sebastian Kaiser and Friedrich Leisch A Toolbox for Bicluster Analysis in R Technical Report Number 028, 2008 Department of Statistics University of Munich http://www.stat.uni-muenchen.de A Toolbox for
Data Mining Techniques Chapter 5: The Lure of Statistics: Data Mining Using Familiar Tools
 Data Mining Techniques Chapter 5: The Lure of Statistics: Data Mining Using Familiar Tools Occam s razor.......................................................... 2 A look at data I.........................................................
Vector storage and access; algorithms in GIS. This is lecture 6
 Vector storage and access; algorithms in GIS This is lecture 6 Vector data storage and access Vectors are built from points, line and areas. (x,y) Surface: (x,y,z) Vector data access Access to vector
MATH BOOK OF PROBLEMS SERIES. New from Pearson Custom Publishing!
 MATH BOOK OF PROBLEMS SERIES New from Pearson Custom Publishing! The Math Book of Problems Series is a database of math problems for the following courses: Pre-algebra Algebra Pre-calculus Calculus Statistics
Comparison of Non-linear Dimensionality Reduction Techniques for Classification with Gene Expression Microarray Data
 CMPE 59H Comparison of Non-linear Dimensionality Reduction Techniques for Classification with Gene Expression Microarray Data Term Project Report Fatma Güney, Kübra Kalkan 1/15/2013 Keywords: Non-linear
-3- TWO SOFTWARE PACKAGES FOR ARCHAEOLOGICAL QUANTITATIVE DATA ANALYSIS. S.G.H.Daniels 1, Gwendrock Villas, Fernleigh Road, Wadebridge, Cornwall
 -3- TWO SOFTWARE PACKAGES FOR ARCHAEOLOGICAL QUANTITATIVE DATA ANALYSIS S.G.H.Daniels 1, Gwendrock Villas, Fernleigh Road, Wadebridge, Cornwall The two analytical packages AQUA and ARCHON share many features
Projects Involving Statistics (& SPSS)
") Projects Involving Statistics (& SPSS) Academic Skills Advice Starting a project which involves using statistics can feel confusing as there seems to be many different things you can do (charts, graphs,
Projects Involving Statistics (& SPSS) Academic Skills Advice Starting a project which involves using statistics can feel confusing as there seems to be many different things you can do (charts, graphs,
Mehtap Ergüven Abstract of Ph.D. Dissertation for the degree of PhD of Engineering in Informatics
 INTERNATIONAL BLACK SEA UNIVERSITY COMPUTER TECHNOLOGIES AND ENGINEERING FACULTY ELABORATION OF AN ALGORITHM OF DETECTING TESTS DIMENSIONALITY Mehtap Ergüven Abstract of Ph.D. Dissertation for the degree
FUZZY CLUSTERING ANALYSIS OF DATA MINING: APPLICATION TO AN ACCIDENT MINING SYSTEM
 International Journal of Innovative Computing, Information and Control ICIC International c 0 ISSN 34-48 Volume 8, Number 8, August 0 pp. 4 FUZZY CLUSTERING ANALYSIS OF DATA MINING: APPLICATION TO AN ACCIDENT
Summarizing and Displaying Categorical Data
 Summarizing and Displaying Categorical Data Categorical data can be summarized in a frequency distribution which counts the number of cases, or frequency, that fall into each category, or a relative frequency
IBM SPSS Statistics 20 Part 4: Chi-Square and ANOVA
 CALIFORNIA STATE UNIVERSITY, LOS ANGELES INFORMATION TECHNOLOGY SERVICES IBM SPSS Statistics 20 Part 4: Chi-Square and ANOVA Summer 2013, Version 2.0 Table of Contents Introduction...2 Downloading the
Nonlinear Iterative Partial Least Squares Method
 Numerical Methods for Determining Principal Component Analysis Abstract Factors Béchu, S., Richard-Plouet, M., Fernandez, V., Walton, J., and Fairley, N. (2016) Developments in numerical treatments for
NCSS Statistical Software Principal Components Regression. In ordinary least squares, the regression coefficients are estimated using the formula ( )
") Chapter 340 Principal Components Regression Introduction is a technique for analyzing multiple regression data that suffer from multicollinearity. When multicollinearity occurs, least squares estimates
Chapter 340 Principal Components Regression Introduction is a technique for analyzing multiple regression data that suffer from multicollinearity. When multicollinearity occurs, least squares estimates
Metric Multidimensional Scaling (MDS): Analyzing Distance Matrices
: Analyzing Distance Matrices") Metric Multidimensional Scaling (MDS): Analyzing Distance Matrices Hervé Abdi 1 1 Overview Metric multidimensional scaling (MDS) transforms a distance matrix into a set of coordinates such that the (Euclidean)
Metric Multidimensional Scaling (MDS): Analyzing Distance Matrices Hervé Abdi 1 1 Overview Metric multidimensional scaling (MDS) transforms a distance matrix into a set of coordinates such that the (Euclidean)