Amendment List Date Amended by Incorporated No Date i
|
|
|
- Molly Lane
- 7 years ago
- Views:
Transcription
1

2 No Amendment List Date Amended by Date Incorporated i

3 ACP 32 NAVIGATION CONTENTS Volume 1... Map reading Volume 2... Basic Navigation Volume 3... Air Navigation Volume 4... Pilot Navigation Volume 1 Map Reading Chapter 1... What is a Map Chapter 2... Map Language Chapter 3... Scales Chapter 4... Grids Chapter 5... Relief Chapter 6... Gradients and Intervisibility ISSUED 1999 ii

4 iii
5 WHAT IS A MAP? CHAPTER 1 WHAT IS A MAP? Introduction Why do we need maps? 1. Even from the earliest days the urge for man to explore has been great. The early travellers used natural features to help them find their way from place to place. By noting the position of the stars, the moon and the sun, man devised a method of finding out where he was. This meant exploration past known boundaries was now possible. As the explorer ventured further and further from home and recognisable features disappeared, he would often sketch his surroundings so that the way home could be found more easily. These early maps where often drawn on animal hide, stone or reed paper. Fig th Century Britain (courtesy of the British Library) Finding your position on the earth 2. If we think of the earth as a sphere, we can imagine how it could be covered with imaginary lines to help pinpoint a position on the surface. First of all the earth has an axis, running from the True North pole to the True South pole - the only 2 points on earth that do not rotate. Next, imagine a line that runs around the middle of the earth half way between the North and South poles- this circular line is called the equator

6 CHAPTER 1 3. If we add more lines running parallel to the equator, they will also be circular, though smaller than the equator; they are called lines of latitude. Lines on the Earth s surface drawn from pole to pole are called lines of longitude. Longitude Prime Meridian Lines of Longitude Degrees and minutes 4. Longitude lines, also called meridians, are circular. They are numbered and have a starting point at Greenwich in England. This line is numbered zero and called the prime meridian- all other lines are either east or west of it. Every meridian - from one pole to the other - is a semi-circle, and has an anti-meridian on the opposite side of the earth. A meridian and its anti-meridian together make a full circle round the earth. 5. By numbering the lines, it means that the whole of the earth can be covered. The position of each line is expressed in degrees away from the prime meridian. For example in the diagram point A is about 20 (degrees) west of the prime meridian. Point B is about 40 east of the prime meridian. Although this system can give reasonably accurate positioning it is not accurate enough for everyday use, so each degree is further broken down into 60 minutes. This now gives us a system of describing a point s location in terms of degrees and minutes either east or west of the prime meridian (Greenwich). NORTH POLE NORTH POLE NORTH LATITUDE GREENWICH PRIME MERIDIAN EQUATOR SOUTH LATITUDE SOUTH POLE Fig 1-2 Lines of Longitude SOUTH POLE Fig 1-3 Lines of Latitude Latitude Lines of Latitude 6. Lines of latitude are circles drawn around the earth, parallel to the equator. The equator, at zero degrees, splits the earth into two halves, the northern hemisphere and southern hemisphere. Using the lines of latitude you can descibe any point s location in degrees and minutes either north or south of the equator

7 WHAT IS A MAP? 7. The parallels of latitude are often drawn at 15 intervals covering the globe, although other intervals may be chosen. The examples in Fig 1-3 show point A to be 15 north, point B to be 30 south and point C to be 20 north. Recording a Position Recording your position 8. If you put the latitude and longitude lines together on the same globe you will get a matrix. With this system you can give a point s exact position by stating its latitude, followed by its longitude in degrees and minutes. For example point A would be at 20 N 56 W, point B at 17 S 17 W and point C at 45 N 15 E. Note that Latitude must always be given first. NORTH POLE Fig 1-4 Latitude and Longitude matrix SOUTH POLE Curved or Flat The curved surface of the earth is flattened to fit on paper Maps are made using satellites 9. Since the world is curved a truly representative map would also need to be curved. This would be too difficult for normal use so the curved surface of the earth is flattened out to fit on to a sheet of paper. This means that there are some differences between a map and the actual ground it represents. If however, only small areas of ground are considered when map making, these errors are reduced to a negligible amount. The need for accurately drawn maps gave rise to the art of cartography (map making). 10. This art has now become a science where today, every area of ground is covered either by survey or by satellite to give up-to-date maps of the world. Ordnance Survey M726 series map 11. The UK is fortunate because it is served by possibly the best cartographers anywhere. The Ordnance Survey (OS) is a Government department based in

8 CHAPTER 1 Southampton and produced its first map in 1791 for the Army (hence ordnance). These maps were initially 1 inch to 1 mile (M722 series) and it took 190 sheets to cover the UK. OS are constantly up-dating the information and map availability. At this time there are 204 sheets in the Metric 726 Series 1:50,000 covering the whole of the UK. OS have done a very good job producing this series and you should find them easy to use. It is this map series that the Air Training Corps use most and will be the main reference in this publication. What Do You Want From A Map? 12. If you need to get from A to B it is important that you find the best route so that you can avoid rivers, lakes, motorways and other such obstacles. By the end of this publication you should be able to interpret (read) a map, that will include: Symbols Grid references Distances Most of the basic work can be carried out in the classroom but getting familiar with the map and what it tells you is the first priority. Topographical maps 13. The M726 Series is classed as a topographical map which means that it particularly shows the shape and surface detail of the land, including natural and man-made features. A typical map would show: Rivers Valleys Hills Streams Mountains Woods Marshes 14. Man-made features would include: Roads Railways Villages Canals Towns Power lines

9 WHAT IS A MAP? 15. The M726 Series is not the only type of map available, there are maps for several other user groups, including: a. Administrative maps (eg. for population surveys or council boundaries) b. Historical maps (giving details on layout of monuments and buildings). c. Marine maps (estuaries, sandbanks or wrecks). d. Road maps (motorist route planning). e. Outline maps (giving very brief description of specific area). Map Selection Which map to use? Types of maps 16. The map you will require will depend on your activity. Here are some of the choices available: SCALE POSSIBLE USES 1: 10,000 (1cm = 100m) Orienteering, town planning 1: 25,000 (1cm = 250m) Walking (you may need more than one) 1: 50,000 (1cm = 500m) Walking (most popular) 1: 63,360 (1inch = 1 mile) Walking (replaced by 1: 50,000) 1: 100,000 (1cm = 1,000m) Cycling, hostelling, route planning 1: 250,000 (1cm = 2,500m) Cycling, motoring, flying 1: 1,000,000 (1cm = 10km) Long distance air navigation Remember - the larger the number on the right hand side of the scale ratio, the larger the area covered and so less detail
 Orienteering, town planning 1: 25,000 (1cm = 250m) Walking (you may need more than one) 1: 50,000 (1cm = 500m)")
10 CHAPTER The most popular maps that are used by walkers are: a. Landranger series (OS) 1: 50,000 b. Outdoor Leisure (OS) 1: 25,000 c. Tourist (OS) 1: 63,360 or 2.5 cm :1 Mile 18. The detail required on a map will depend on the area being covered. An area which is small is best served with a very detailed map but if touring in a car a less detailed map is more useful. Revision (the latest edition) Use the latest revision 19. A map is most accurate on the day that it is produced and will continue to be accurate until the features on it are changed. If you had planned an expedition in the classroom then went to the start point to find the valley had been dammed and the river is now a reservoir, this could prove to be a heavy dampener on the walk and your enjoyment. Some maps may stay fairly constant - for example, those of mountainous areas, as it takes many years to erode mountains and the area is not likely to be developed. You must be aware of urban areas like towns and villages because they can grow or have road bypasses built. Maps covering these areas may therefore change frequently. Before you start check the revision date of the map you are about to use. Looking After Your Map NEVER mark maps 20. Some maps are now produced laminated (plastic covered) and you can also treat maps with a waterproof coating. You may decide to protect your map by using a map case, clear map holder or even a plastic bag. Whatever method you choose you must always take care of your map. Always keep your map folded because in high winds you may lose control of it (flapping around) or lose it altogether. NEVER mark a map surface with ink as this will damage the surface when you try to remove the mark. If you need to mark a map use a soft pencil and use it very lightly so the marks can be removed easily with a soft clean eraser. Try to avoid getting your map wet but if it does then allow the map to dry naturally at the earliest possible chance. Remember maps are expensive - treat them with care

11 WHAT IS A MAP? Folding your map Fig 1-5 Folding your map
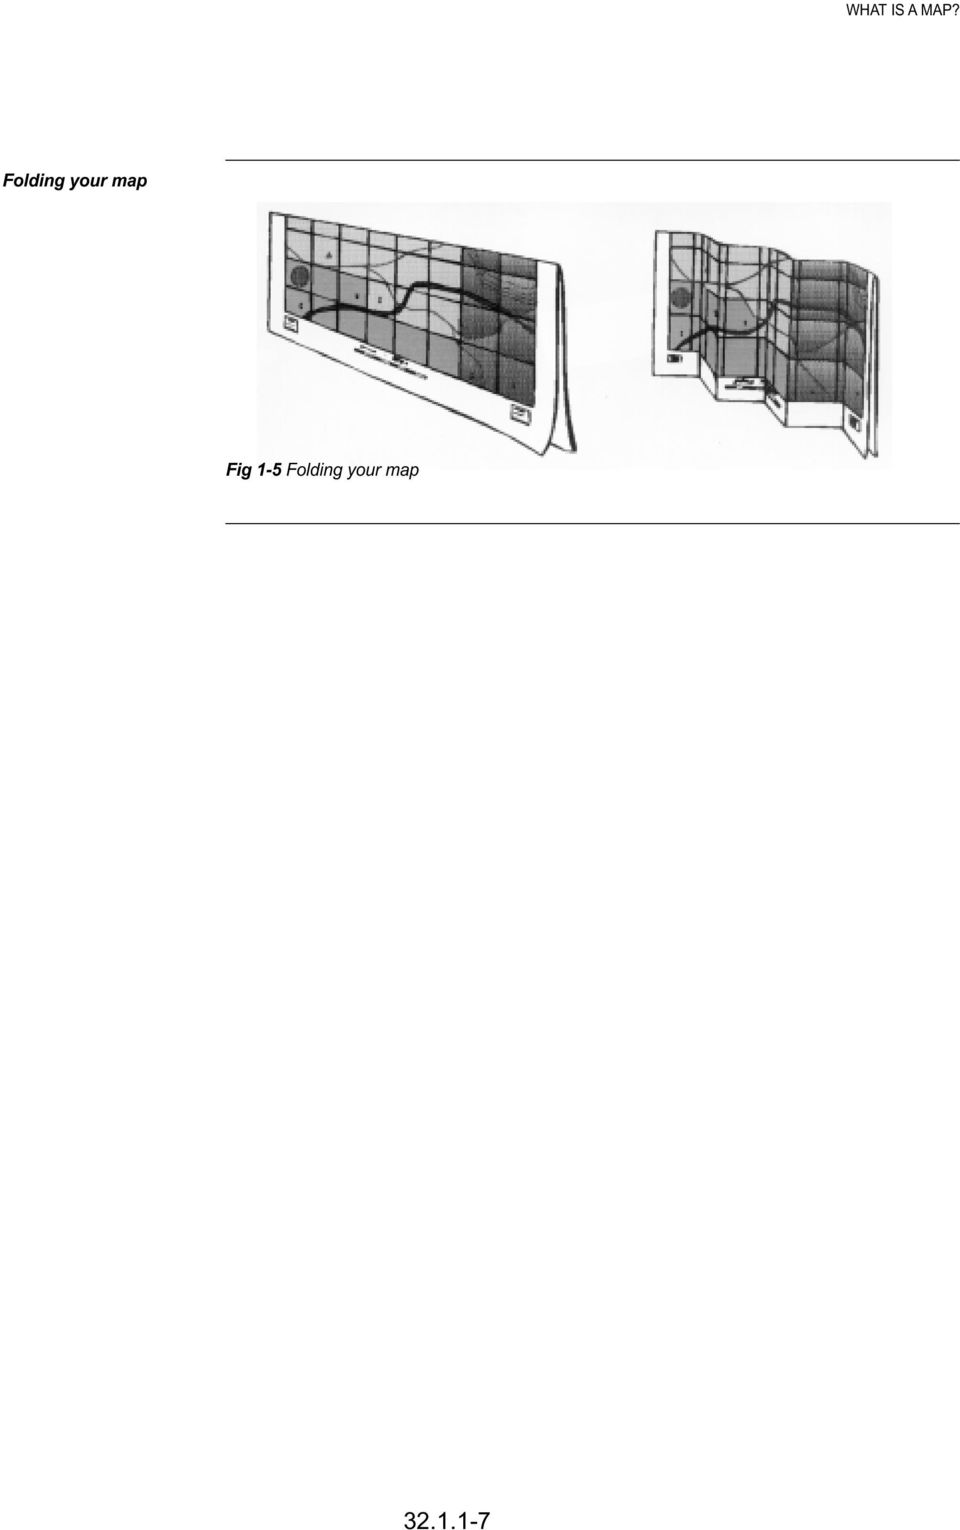
12 CHAPTER 1 Sample Questions Do not mark the paper in any way - write your answers on a separate piece of paper, in the form of a sentence. 1. Which of these best describes a topographical map? It shows: a. The shape and surface detail of the land b. Underlying geological features c. The distribution of climates d. The distribution of minerals 2. The Series M726, 1:50,000 maps are: a. Geological b. Synoptic c. Topographical d. Demographical 3. Which one of these maps shows the greatest detail: a. 1:25,000 b. 1:250,000 c. 1:500,000 d. 1:1,000, How should a map be folded so that it does not suffer too much damage in use and yet ensures the maximum area of map is accessible for reference? a. Fold back each of the four edges until the piece required is exposed b. Fold into four equal quarters c. Fold up from the bottom concertinawise d. Fold in half length wise with the outwards, then concertinawise

13 MAP LANGUAGE CHAPTER 2 MAP LANGUAGE Introduction 1. The first time you look at a map it will probably be very confusing. It will no doubt take you a while to understand what is on the sheet and how it gives you information. Make sure you have a Series M726, 1:50,000 map to look at while you are working through this chapter. Outside of the main grid, in the margins, there is a host of useful information and in this chapter you will find a breakdown of what s what. Whether you are in the classroom or out in the field, if in doubt look in the margin. KEY 1. Units of elevation (Metres) 2. Angular difference true, grid & magnetic north 3. Degrees and minutes of longitude 4. Map title 5. Sheet Identification 6. Conventional signs 7. How to give a grid reference 8. Height conversion 9. Adjoining sheet details 10. North points 11. Compilation and revision 12. Deviation of contours 13. Scale and scale lines 14. Grid numbers (eastings) 15. Degrees and minutes of latitude 16. Grid numbers (northings) Elevation Check the units of height 2. When you are using a map you must first check the units of height or elevation. They will either be in feet or metres. In older maps the units of elevation are normally in feet, so to avoid confusion, check. The units of elevation are displayed on the map in the top left hand corner, key position 1 in the diagram. It is essential when you are calculating timings that you know the correct units of height

14 CHAPTER 2 Latitude/Longitude Information on Latitude and Longitude 3 Norths 3. The lines of latitude are expressed in degrees and minutes and are marked along the right and left (east and west) hand side of the map in key position 15. The lines of longitude are marked along the top and bottom (north and south) of the map in key position 3. The lines of latitude and longitude are not actually drawn on the map itself- it would be too confusing. 4. In map reading there are always references to north. There are in fact 3 norths: a. True north b. Grid north c. Magnetic north True North 5. This is the geographical north pole of the earth - the point where the earth s axis meet the surface. Grid North 6. This north takes its name from the National Grid system, a system of imaginary lines drawn vertically and horizontally which divide your map into a series of squares. Because grid lines are drawn on a flat map and not on the curved surface of the earth as are the lines of latitude and longitude, the two systems are different. This difference is shown on the map, key position 10, as a difference between true north and grid north. Magnetic North 7. Magnetic north is the point where a magnetic needle will align itself if freely suspended. The earth has its own magnetic field, similar to that produced by a giant bar magnet running along the earth s axis. Unfortunately, the earth s north and south magnetic poles do not coincide with the geographical poles - in fact they are about 1200 miles apart!

15 MAP LANGUAGE Map Identification How to identify your map 8. On the M726 Series of maps the identification box is found at key position 5, at both the top and bottom of the right hand column. This gives details such as: a. SERIES M726 (type and scaling of map) b. SHEET 139 (particular area covered by map) What does GSGS stand for? c. EDITION 6-GSGS (Geographical Section General Staff, Authority in UK) 9. There will be times when the information in this box will change. The most noticeable change will be the edition number. You may also find the adjoining sheet information useful if you are not quite sure of the sheet number you require. Title 10. In the top right hand area of the column you will find the title of the sheet at key position 4. This will be a rough guide to the area covered by the map. For example: Birmingham, Grantham, East Kent and Black Mountains. Scale and Scale Lines Where are scale lines on your map? 11. The scales are situated along the bottom of the sheet at key position 13 and they give you: distances in nautical miles, statute miles and kilometres. A nautical mile = 6080 feet = 1.85km A statute mile = 1760 yrds = 1,6093 km A kilometre = mile or 5/8 of a mile 12. These scales can be used to obtain measurements for calculations of distances when route planning in the field

16 CHAPTER 2 Revision Which revision is best? 13. The revision date is an important feature on a map because it gives the user an idea how up-to-date it is. The revision date can be found under the heading COMPILATION AND REVISION which is in the lower quarter of the right hand column at key position 11. The date will tell when the last set of changes to effect the map were added. Changes include such things as: new motorways, major industrial developments or new housing estates. The Map 14. Having checked all the information and ensured that you have chosen the correct map, you are now ready to take a closer look at the main grid to see what it tells you. 15. When a map maker compiles information to put on to a map the aim is to give an accurate representation of what is on the ground. An aerial photograph of an area the same size as your map, would not give you all the information you require and would not be very clear. A map improves on an aerial photograph by using a set of convenient signs and symbols (a kind of shorthand depicting features on the ground). After a little practice using these signs and symbols you will soon find it quite easy to read a map and interpret what you see. General Features 16. You must be able to SEE what is on a map and know what the features would actually look like if you were standing in front of them. To help you in this, some of these features are graded to signify the degree of importance they hold. Sometimes the same symbol is shown in different colours to signify a difference; for example, red National Trust symbols show the area is open all year, whilst the same symbol in blue indicates it has a restricted opening period. It is worth noting that if a feature is fenced-in then it will have a solid line on the map but if it is a natural boundary it will have a broken line around it. Triangulation Points Trig points 17. Surveyors build up a map from a large number of triangles. The angles that are calculated from field work go into giving an accurate measurement on the ground

17 MAP LANGUAGE The points from where this information is taken are called triangulation points (trig points). Trig points are actually small concrete pillars with a 3 channelled plate on top. On the map they are shown as a small blue triangle with a dot in the middle with its height printed next to it (to the nearest metre). Conventional signs

18 CHAPTER 2 Roads and Paths 18. There are some signs and symbols that will be more important to you when you are planning an expedition on foot - they will be roads, paths and tracks. Note the different colours representing different types of road. Conventional signs

19 MAP LANGUAGE Spot Heights 19. Spot heights appear on maps as an added guide and are used to back up triangulation points. They are represented by a dot with the height next to it (to the nearest metre). Contour Lines Contour lines Vertical Interval 20. A contour line is a reddish brown line drawn on the map joining all points of equal height above mean sea level (MSL). Mean sea level is a fixed height approximately half way between high and low tides calculated at Newlyn in Cornwall over many years. This MSL gives a common baseline so that anywhere in the UK can be measured to give an accurate height. By joining all the points at the same height you can achieve a picture and shape of the land. These contour lines will wander all over the map and eventually rejoin at the starting point to show an area of equal height. There is an exception to this rule and that is where a contour line meets a cliff face. If you look at a contour line and cannot find the height try following it round until you come across the figure. These heights are shown in small breaks in the contour line itself and every fifth line is shown slightly thicker to make them easier to read. These contour lines are situated at 10 metre intervals on the M726 Series and the rise or fall between contours is called the vertical interval (VI). Conventional signs Railways and Waterways 21. Railway conventional signs are used to indicate either double or single track. Special features include tunnels, cuttings, sidings and embankments. Stations that are open to the public are shown in red, whereas a station that is closed is shown in white. Bridges, viaducts and tunnels especially those connected with roads, railways and waterways are shown as solid objects when above ground and as dotted or broken lines when below ground

20 CHAPTER 2 Conventional signs Tourist Information 22. This information is often very useful. The long distance path information shown at the bottom simply indicates the route of the path across the sheet. Conventional signs

21 MAP LANGUAGE Conclusion 23. Remember - conventional signs are appropriate ONLY to the map that you are using. They may be different on a different version of the same map. These signs and symbols are easy to learn and the best way to improve your understanding is to get as much practice using them as possible, then follow it up by groundwork. There may be one or two signs that you come across that you don t recognise - if in doubt look in the margin
22 CHAPTER 2 Sample Questions Do not mark the paper in any way - write your answers on a separate piece of paper, in the form of a sentence. 1. On an M726 series map the letters PC represent: a. Public convenience b. Police communications centre c. Private chapel d. Picnic site 2. Contour lines are continuous (ie wherever they run they eventually return to their starting point), with one exception. The exception is: a. At a cliff edge b. At the North or South Pole c. At a river d. When the land is very flat 3. To help in reading and counting contours to determine heights, some contours are drawn using thicker lines than the rest. The thicker ones occur: a. Every 2nd contour b. Every 3rd contour c. Every 5th contour d. Every 10th contour 4. On the M726 series map, spot heights are shown in: a. Kilometres b. Metres c. Feet d. Yards
23 SCALES CHAPTER 3 SCALES Why use a scale? Introduction 1. If your map is to cover a reasonable area then everything on the map has to be reduced considerably from its real size. The choice of scale would be determined by the user or the task required. How do you express scale? 2. There are 3 ways to express scale Different ways to express a scale a. In words- by saying so many centimetres to the kilometre. For example a scale of 2cm to 1km means that for every 2cm on the map you would travel 1km on the ground. Measuring the distance from the Squadron Headquarters to the local Police Headquarters as 12cm on this scale would be equal to 6 km on the ground. b. As a Representative Fraction (RF)- in this method the scale is expressed 1 in the form of a fraction, for example 50,000 Using this method you are saying that any distances measured on the map are one-fiftythousandth of the real distance on the ground. c. As a ratio: very similar to b. but is written as: 1:50,000 The meaning is also the same as b. Calculation Understanding scale 3. In the case of RF and ratio the expression of the distance, whether it is in inches, centimetres or metres, is the measurement on the ground. So a 1:50,000 ratio would be equally valid for 1 inch on the map 50,000 inches on the ground 1 cm on the map 50,000 cm on the ground 1 m on the map 50,000 m on the ground
24 CHAPTER 3 4. If the scale is expressed in words it may be necessary to convert it into either a RF or a ratio. For example, to convert a scale of 1 inch to 1 mile, you have to calculate the number of inches in a mile: There are 1,760 yards in a mile There are 5,280 feet in a mile (1760 x 3) There are 63,360 inches in a mile (5280 x 12) 5. So the scale of 1 inch to 1 mile can be expressed as a ratio of 1:63,360. This type of calculation is made easier using the metric system, but it will still require careful thought. Area Reducing areas 6. When using scales, areas of ground will also be proportionately reduced but remember that areas contract rapidly on small scale maps. For example if you take a map that is half the scale of another then the area is reduced by a quarter (not a half). This is because the area of a rectangular figure is length multiplied by breadth. If you therefore halved the scale you will quarter the area of the map Km square at 1:12,500 4 x 4 = x 2 = 4 1Km square at 1:25,000 1Km square at 1:50,000 The same area of ground in three different scales (Half the scale = one quarter of the area) 7. From this you can see that a large scale map is very detailed in area. As a rough guide: Different types of map use different scales Large scale Medium scale Small scale - city or town maps (defined buildings) - Larger areas (buildings as symbols) - atlas (large towns in name only)
25 SCALES Visualisation 8. If you can get into the habit of checking your scale when you use your map you will soon become familiar with distances and areas covered by that scale. This will also make your task of route planning easier to achieve. Air Photography 9. Photographs from the air can provide an almost instant representation of what is on the ground. Air photographs, like maps, can become out of date very quickly. The examples below show the differences between maps and photographs (both black and white and colour). By using a special lens you can obtain a 3-D picture of the ground which will show relief. The scale of the photograph is fairly small and therefore to give adequate detail for use on the ground a very large photograph would be needed. Which would you prefer to use, a photograph or a map? Fig 3-1 Blackpool Airport
26 CHAPTER 3 Fig 3-2 Telford in Shropshire
27 SCALES Sample Questions Do not mark the paper in any way - write your answers on a separate piece of paper, in the form of a sentence. 1. If you measured the distance between two places on a 1:50,000 map and it came to 26 centimetres, what would be the real ditance over the ground in Kilometres? a. 52 b. 26 c. 13 d On a 1:50,000 M726 series map, what distance on the ground is represented by 2cm on the map? a. 4Km b. 2Km c. 1Km d. 0.5Km 3. On a 1:50,000 M726 series map, what distance on the ground is represented by one side of a 2cm grid square? a. 1Km b. 10Km c. 0.5Km d. 5Km 4. For which of the following uses would a map with a scale of 1:1,000,000 be suitable? a. Showing street and houses in great detail b. Motoring in the UK c. Navigating on foot, as in an expedition d. Long distance aeronautical navigatioin
28 CHAPTER 4 CHAPTER 4 GRID REFERENCES Grid Lines UTM 1. If you look at a M726 Series map you will notice that it is covered in squares. These squares make up a grid that covers the whole area of the map. The lines are better known as grid lines and allow you accurately to locate points on the map. This system also allows you to route plan using grid references (GR). For ease, the numbers are printed around the grid and inside at every 10th grid line in both directions across the map. 2. These grid lines belong to a much bigger system that covers the UK and is known as the National Grid (there is no connection with the electricity supply!). Kilometres Northings FALSE ORIGIN OF NATIONAL GRID Kilometres Eastings
29 GRID REFERENCES The UK s National Grid is not the only one of its kind as nearly every country will have its own National Grid. There is a world wide grid called Universal Transverse Mercator Grid (known as UTM Grid), which is used on aviation and maritime charts because of the much larger distances involved. The National Grid 3. Every grid system must have a starting point so that the grid can be built up from it. From the diagram at the previous paragraph you can see that the UK s starting point is off Lands End. To cover the UK there is a need for seven 100 kilometre lines of eastings (vertical lines) and thirteen 100 kilometre lines of northings (horizontal lines) from the starting point. These squares of 100 kilometres (Km) are further identified by two letters. Grid References (GR) 4. You will understand that a map drawn on the scale to fit a 100km square will have very little detail at all. A map that will be useful to you has to be based on a much smaller area. The M726 Series covers an area of about 40km 2 which is less than a quarter of the 100km 2 area. The M726 Series map has squares of 1km in size giving an accurate scale map for most types of use. The number printed against each vertical line indicates the number of kilometres that line is east of the starting point for the 100km square to which your map belongs. The number printed against the horizontal grid line indicates the number of kilometres the line is north of the same starting point. There is on a M726 Series map a British National Grid legend that tells you where your map is in relation to the 100km square. The need for these grid lines will now become obvious and can be referred to as eastings and northings lines. GRs point to the South West corners 5. It is fairly easy to locate an object within a 1km square as long as you know what square it is in. This can be done using Easting and Northing to indicate the south west (SW) corner of the square you wish to identify. By using the SW corner of the square, the grid reference is standardised so everyone knows what it means
30 CHAPTER 4 6. As shown by the examples you end up with two sets of figures. If you put them together they form a 4-figure reference. You always quote the eastings first followed by the northings. There is a saying that might help you remember this sequence: Across the hall (eastings) and up the stairs (northings) Fig 4-1 GR 1825 Fig 4-2 GR 0536 Fig 4-3 GR This 4-figure reference system is a good method of pinpointing objects on the ground like a church or a farm but if there are more than one of the same object in that particular square it may get confusing. To overcome this problem you need to increase your accuracy. There is a system of 6-figure referencing you can use. 6 Figure GR 8. In the following examples each 1km square has been subdivided into 10 equal parts (1/10ths). Each of the small squares now represents 100m 2 on the ground. So to give a 6-figure reference you start in the SW corner and get your 1km grid number (say 33) as before, then mentally divide the grid into ten parts and estimate how far into the square the object is (say 4). Once this is done add the figure to the first (giving 334)- now you have your easting. Repeat the process for the northing and you will end up with a 6-figure reference number. Judging tenths across the square (both up and down) may be difficult to begin with but with practice it soon becomes an easy system to use
31 GRID REFERENCES Fig 4-4 GR Fig 4-5 GR Fig 4-6 GR Noughts 9. When you are compiling your GR you may find it contains noughts. You must remember to include them. If the object you seek is on the easting or northing lines then the third number in your grid reference will be a nought, you must include it. In this example the GR would be: Fig 4-7 GR Letters The full GR 10. In the diagram at paragraph 2 showing the National Grid, the 100Km squares are identified by the use of letters. You would not normally refer to these but there are some cases where you would need to (in the completion of a long trek, crossing into another 100Km square). To provide clarity and to avoid uncertainty the letters would also be added to the grid reference, for example: SO
32 CHAPTER 4 Plotting A Grid Reference 11. If you had been tasked to locate an object at a given reference on Sheet 130 on a M726 Series 1:50,000 map, this is how you might go about it: a. Mentally divide the number into two segments. b. This gives you 875 and 303. c. Use the 87 from the first set (easting). d. Locate that number across the sheet. e. Use the 30 from the second set (northing). f. Locate that number up or down the sheet. g. You will now be able to locate the SW corner of the square where the object lies h. Now use third number from the first set (5). i. Move half way across the easting line. j. Use the third number of the second set (3). k. Move up the grid 3 tenths. l. At this point you will find a trig point at 141m. 12. This may seem a long process but once you have gained some experience you will no doubt develop your own method and increase your speed. 13. So far you have been estimating the 10 divisions required for a 6 figure reference. There are more accurate methods of taking this measurement. One such method is a useful device called a Roamer. This device has tenths marked out in several different scales along various edges. You can find these scales on most compasses designed for navigation on foot
33 GRID REFERENCES
34 CHAPTER 4 Sample Questions Do not mark the paper in any way - write your answers on a separate piece of paper, in the form of a sentence. 1. A Roamer would be used in finding: a. The direction of a track b. The grid reference point c. The average gradient d. A relative bearing 2. When using an M726 1:50,000 map, a 4-figure grid reference will define a 1 Kilometre square on the map. The 4-figure reference refers to a particular corner of the square: whcih corner? a. NE b. SE c. NW d. SW 3. Each side of each Grid square on a 1:50,000 map represents on the ground: a. 1/2 Kilometre b. 1.5 Kilometre c. 1 Kilometre d. 2 Kilometre 4. What is the meaning of the two letters in a Grid Reference using the UK National Grid e.g. a GR of TL307624? a. The point is located in one of the Grid squares with sides of 500Km b. The point is located in one of the Grid squares with sides of 1Km c. The point is located in one of the Grid squares with sides of 100Km d. The point is located 30Km East and 62Km North of origins of the grid
35 RELIEF CHAPTER 5 RELIEF Introduction What is relief? 1. The word relief means the rise and fall of the ground or, in other words such features as hills and valleys. This involves both the height and the shape of the land. As a map is drawn on a flat sheet of paper the representation of height and shape is difficult. Map makers have various ways of doing this, but whatever method, it is left to the reader (you!) to interpret the information. This chapter introduces you to relief on a map. Height 2. Methods of showing height on a map include: Methods of showing height a. Spot heights and triangulation points, which are used to give an accurate height above sea level at given points. They give an indication of height but not shape. b. Layer tinting, which uses colours that may vary depending on the type of map you are using. For example, land up to 60 metres may be coloured green, rising higher ground may be light brown and higher ground still may be in dark brown. If this system is in use on a map you will find a key legend for the colours in the margin. Layer tinting gives you some idea of the shape as well as height and its main advantage is that it gives a quick impression of the highest and lowest ground. However, because of its general nature it is best to use it only as a rough guide. Unit Of Measurement CHECK the units of height 3. Units of height are important. In particular you must appreciate the difference between feet and metres, a foot being about the size of your shoe whereas a metre is a full stride. You can imagine your group s reaction if you were planning to climb a hill of a 1,000 feet which was going to take two hours, only to find that it was actually 1,000 metres taking six or seven hours to climb. Hence it is vital to know the units of height from the planning stage right through to the execution of an exercise
36 CHAPTER 5 Shape Showing steep ground 4. Methods of showing shape include: a. Hachures. These are short tadpole-shaped strokes, the thicker end of the stroke being in the direction of the higher ground. When depicting steep ground they are drawn thickly and close together. On areas where the ground is a gentle slope, the hachures are drawn thinly and wider apart. This method gives no definite height indication and is seldom used except to show cuttings, embankments and steep slopes. Fig 5-1 Hachures b. Hill Shading. Hill shading is similar to hachures, but using an oblique stroke to achieve a depth of shading. This means that the darkest shading is the steepest ground. Another form of shading is based on a convention that light is shed from the NW corner and the hills are shaded accordingly. This method does not in itself give any indication of height. Contour Lines Contour lines 5. Contour lines on a map join all the points of the same height together and, with a little practice you can get from them a very good idea of the shape of the ground. So much so, they are the standard way in which height is depicted. There are some points to bear in mind before you start interpreting information from contour lines: a. Between any two contour lines there must be a slope either up or down. b. Contour lines are continuous and only stop abruptly at a cliff edge. c. Heights on contour lines are printed so that when you read them the right way up, you are facing uphill
37 RELIEF Contour Plans 6. Contour lines represent an area on the ground and can be thought of as a plan of that ground. If you take a map and look at the contour lines you will see something like the plan view shown below. From this representation you can build up a picture in your minds eye as to what it will look like on the ground (side view). The perspective is the combination of plan and side views and gives both the shape and height of the object. Fig 5-2 Visualising the shape of the land Steepness and direction Slopes Steep or gentle slopes? Contour markings face uphill 7. If two contour lines are far apart it would suggest there is a greater distance to travel from one to the other to gain the height. This is better described as a gentle slope. If you see two contour lines very close together you would expect to see a very steep slope. The next few figures demonstrate these points well and with practice you too will be able to see when a climb will be hard (steep) or easy (gentle). It is not always easy to tell in the classroom whether a set of contours represents a steep upward or a steep downward slope. Remembering that contour
38 CHAPTER 5 values are always printed facing uphill this should give you a good guide in telling which way the slope is going. Other clues may be available to you, like rivers or lakes as these tend to be at the bottom of a slope. Fig 5-3 Photograph from GR
39 RELIEF Fig 5-4 Photograph from GR
40 CHAPTER 5 Convex/Concave 8. As well as being gradual or steep, slopes may be convex or concave. The diagram shows in line CXYD that the slope is convex (YD) because the contours are closer together at the bottom. If the contours are further apart at the bottom as in (CX) the slope is concave. It follows that if the contour lines are more evenly spaced, then the slope will be relatively uniform or straight. Fig 5-5 Convex and Concave slopes Lie of the land 9. Where contours meander and are varying distances apart, but never very close, the ground is undulating and relatively flat. You can only gain a little knowledge of the ground from the sparse detail, but the land will fall gentle from the higher contour to the lower one
41 RELIEF Fig 5-6 Photograph from GR Ridges Saddles and Cols A ridge is a long narrow stretch of elevated ground; it is also known as a saddle. Where a ridge has a peak at each end, the lower part of the ridge between the summits is called a col
42 CHAPTER 5 Fig 5-7 Ridge and Col Fig 5-8 Photograph from GR
43 RELIEF Fig 5-9 Photograph from GR Spurs And Re-entrants Difference between Spurs and Re-entrants 11. A spur is a piece of high ground jutting from a range of hills into lower ground. A re-entrant is a narrow valley closed at one end, separating two spurs. They are very similar on the map because the contours for both will have a hairpin shape. You will need to study the contour heights and decide whether the closed part of the hairpin points to the high or low ground. If the closed part points in the direction of the lower ground it is a spur - shown in the diagram. If the closed part points towards the higher ground it is a re-entrant
44 CHAPTER 5 Fig 5-10 Spurs and Re-entrants Escarpment and Knoll An escarpment is a landform with sides sloping in opposite directions consisting of a steep scarp slope and a more gentle dip or back slope. A knoll is a small isolated hill. Fig 5-11 Escarpment Fig 5-12 An Escarpment
45 RELIEF For expamples of Knolls and peaks at different grid references see over. Conclusion If you use the information that is provided by a contour map the lie of the land will become easy to interpret with experience and practice. Once gained, this experience will allow you to build a mental picture of the ground when reading the map in the planning stage
46 CHAPTER
47 RELIEF Fig 5-13 Brent Knoll from GR Fig 5-15 Brent Knoll from GR Fig 5-14 Crook Peak from GR Fig 5-16 Crook Peak from GR
48 CHAPTER 5 Sample Questions Do not mark the paper in any way - write your answers on a separate piece of paper, in the form of a sentence. 1. In map reading, what does the word relief mean? a. Hill shading b. Layer tinting c. The rise and fall of the land d. Hachuring 2. What shape would the contours be for a spur? a. Round b. Elliptical c. Hairpin d. Straight 3. If you were to rotate the map so that the figures on the contour lines were the right way up, which way would you be looking? a. Down the slope depicted by the contours b. Up the slope depicted by the contours c. Grid North d. True North 4. What must there be between any two adjacent contour lines (on a map) which have different values? a. Flat land b. A slope c. A ridge d. A spur
49 GRADIENTS CHAPTER 6 GRADIENTS AND INTERVISIBILITY 1. In this chapter you will learn more about slopes. You will see how the steepness of a slope is expressed and how to work out what you should be able to see from a given point. Gradients Gradients expressed as a ratio 2. The angle or degree of a slope is called a gradient and is expressed as a ratio. Imagine a slope with a gradient of 1:5. This would mean that for every 5 units along the ground (horizontally) the slope will rise or fall by 1 unit. If this ratio is small the slope will be very steep and if the ratio is large the slope will be gentle. Very steep roads in the UK are specially marked on maps so that you may avoid them if you wish. Fig 6-1 Slopes - gentle or steep AC = VERTICAL INTERVAL (VI) CB and CD = HORIZONTAL EQUIVALENT (HE) Measurement Of A Gradient From A Map VI and HE 3. To work out a gradient from a map you need to know both the vertical interval (VI) and the horizontal equivalent (HE). Given 2 points A and B, it is possible to calculate the VI by measuring the distance between the contour lines. In the example this measurement would be 40 metres. To obtain the HE use the map s scale and measure the distance between the 2 points. In the example the HE is measured out to be 2000 metres. IT IS IMPORTANT THAT YOU USE THE SAME UNITS OF MEASUREMENT IN BOTH THE HE AND THE VI. You now have two figures and you must reduce these to a ratio in which the VI is
50 CHAPTER 6 VI= 40 HE= 2000 Fig 6-2 Calculating a gradient SCALE - KILOMETRES 4. The ratio is 40:2000 which (if 2000 is divided by 40) gives1: 50. The ratio of 1:50 for this slope means that for every 1 unit you ascend you have moved forward 50 units. If you are looking at a map and your planned route takes you across some steep ground (where the contours are so close together that short measurements are difficult), measure the HE over several contours. Visualising Gradients 5. The eye tends to exaggerate slopes and so in order to visualise an area of ground accurately from a map a great deal of practice is required. To find gradients you must measure the distances between contours, which may be small and difficult to measure accurately on a M726 Series 1:50,000 map. However, it is quite easy to construct a table that will assist you in visualising gradients. 6. Begin with contours that are as close as 1mm to each other. From the scale you know that 1mm on the map equals 50,000mm on the ground, which is 5000cm or 50 metres. Thus you have an HE of 50m. On the M726 map the VI between contours is 10m. A VI of 10 with an HE of 50 gives a gradient of 10:50 or 1:5. Similar calculations for contour lines that are 2mm apart give a gradient of 10:100 or 1:10. For a 3mm spacing the gradient is 10:150 or 1:15, and so on. In this way you can build up your own copy of the table on the next page. The table also shows a column for expressing gradients as a percentage; you may wish to complete this column if you are familiar with percentages - your instructor will help if you need it
51 GRADIENTS Do not mark the table below but use it as a guide. You may like to draw it or use a photocopy. GRADIENTS DISTANCE BETWEEN GRADIENT APPROX ADJACENT CONTOURS AS % GRADIENT (IN MILLIMETRES) : : : : : : : : :45 10 (1cm) 2 1: : : : : : : : : :
52 CHAPTER 6 Intervisibility What is Intervisibility? 7. When you are map reading it may be necessary to know whether you can pick out a feature or point to help in the next stage of your route. Be very careful because as these examples show interpreting the lie of the ground can be tricky. CONCAVE SLOPE B can be seen from A CONVEX SLOPE B cannot be seen from A Fig 6-3 Concave slope Fig 6-4 Convex slope No Intervening high ground (B can be seen from A) Fig 6-5 Visible ground
53 GRADIENTS When to draw a section 8. If the ground between you and your goal is not clear you may have to draw a section. Your instructor will help you if have any problems understanding how it is done. 9. Cover the diagrams with tracing paper and using a pencil, lightly mark the shape of the land in the following examples
54 CHAPTER Intervisibility problems cannot always be solved accurately from a map. Buildings and trees are not always shown on maps, especially if they have been added since the map was drawn. If visibility is critical for what you are doing then a reconnaissance visit must be made. Fig 6-6 Beware of unseen ground 11. Now that you have had some practice drawing sections, try this example. Remember to use tracing paper and pencil ONLY
55 GRADIENTS Sample Questions Do not mark the paper in any way - write your answers on a separate piece of paper, in the form of a sentence. 1. If the Vertical Interval between two places is 90 metres and the Horizontal Equivalent is 2 kilometres, what is the gradient (to the nearest whole figure)? a. 1:11 b. 1:22 c. 1:33 d. 1:44 2. Which of these gradients is the steepest? a. 1:7 b. 1:11 c. 1:14 d. 1:17 3. If, by studying a map, you cannot be sure whether one place can be seen from another, what can you do to decide? a. Draw a cross-section of the land between them b. Calculate the gradient between them c. Calculate the mean contour line d. Calculate the height of the land by reference to the spot heights in the area
56 CHAPTER 6 GENERAL EXERCISE Give the 6 figure Grid Reference of the points of detail indicated by the arrows
57 GRADIENTS GENERAL EXERCISE 2 Identify the conventional signs by the numbered arrows without reference to a legend
58 CHAPTER 6 1. Name the relief features numbered What are the types of slopes under the lines numbered 6 and 7? 3. What is the approximate height, above sea level of Long Loch? 4. What is the difference in height between the Kinloch Mountain Rescue Post and Hallival ( )? 5.What is the name of the feature numbered 8, and what is its highest point GENERAL EXERCISE 3 Identify the relief features indicated below
59 INSTRUCTOR S GUIDE CHAPTER 1 INSTRUCTORS GUIDE MAP READING WHAT IS A MAP? Page Para Once you have selected your map - HOW do you use it? It is necessary that the cadets know the following points in connection with the subject. Planning is a very important part of any activity and time should be spent on getting to know the area you intend to go. The sort of things to look out for are those features which stand out on the map and would be easily recognisable on the ground. This is particularly useful if you or your party run into problems - remember your reaction will be quicker if you familiar with the map. Once you are happy with your map and feel confident to use it you need to go out and gain some experience of comparing the map to the ground area. This may be achieved in towns, cities or local country side. Any map may be used even a street map as long as it gives the cadets practice in moving from one point to another. 2. If you look at any atlas of the world, you will get a good idea of how continental landmasses lie compared to oceans. When the surface of the earth is shown on a flat piece of paper some distortion takes place. You can spot errors of distortion if you look closely. For example Greenland is shown to be larger than India but in fact India is approximately four times the size of Greenland. This happens because the surface of the earth is stretched at the poles and squeezed at the equator to make it lie flat. Maps tend to be accurate in shape and position (bearing) - they are inaccurate as far as distance and area are concerned. To allow more detail to be shown the world map can be broken down into many single sheet maps. You might think of it as using a microscope with the world under the lens. The more you zoom in the clearer the picture becomes and the more accurate the image you get. 3. To make map reading more enjoyable and to make cadets think, you may like to try some of the following ideas. a. Blindfold a cadet and then pace out a set distance in a straight line. Make a note of how much drift there is and in what direction it was. b. Have one cadet blindfolded and have another direct the first through a small obstacle course (using paces and direction only). c. Have the cadets draw a map of the town/village or city centre (from memory) then compare the results to an actual map. d. Try comparing old maps to new ones to see what changes have taken place in your area. e. Mark out a route on an aerial photograph and have the cadets follow it. f. Use different types of ground to find out different pace numbers and times i.e. 100m on - paths, road, tracks, bracken, heather, sand, uphill and downhill. 4. Map reading can be fun but it also has a serious side. If you decide to go out for a walk locally it is possible to get lost. A map can be a good friend to you when you are out walking - don t leave home without one! a NOTES
Map reading made easy
 Map reading made easy What is a map? A map is simply a plan of the ground on paper. The plan is usually drawn as the land would be seen from directly above. A map will normally have the following features:
WHAT MAPS SHOW US Maps do 4 things:
 WHAT MAPS SHOW US Maps show us a range of features, for example: Landforms: Settlement: Communication: Land Use: Geology: Other Info: - hills - valleys - mountains - isolated dwellings - farms - villages
The Basics of Navigation
 The Basics of Navigation Knowledge of map reading and the use of the compass is an indispensable skill of bushcraft. Without this skill, a walker is a passenger and mere follower on a trip. To become a
Topographic Maps Practice Questions and Answers Revised October 2007
 Topographic Maps Practice Questions and Answers Revised October 2007 1. In the illustration shown below what navigational features are represented by A, B, and C? Note that A is a critical city in defining
Earth Coordinates & Grid Coordinate Systems
 Earth Coordinates & Grid Coordinate Systems How do we model the earth? Datums Datums mathematically describe the surface of the Earth. Accounts for mean sea level, topography, and gravity models. Projections
SECOND GRADE 1 WEEK LESSON PLANS AND ACTIVITIES
 SECOND GRADE 1 WEEK LESSON PLANS AND ACTIVITIES UNIVERSE CYCLE OVERVIEW OF SECOND GRADE UNIVERSE WEEK 1. PRE: Discovering stars. LAB: Analyzing the geometric pattern of constellations. POST: Exploring
CONTENTS. Page 3 What is orienteering? Page 4 Activity: orienteering map bingo. Page 5 Activity: know your colours. Page 6 Choosing your compass
 THE RIGHT DIRECTION SCOUT ORIENTEER ACTIVITY BADGE CONTENTS Page What is orienteering? Page 4 Activity: orienteering map bingo Page 5 Activity: know your colours Page 6 Choosing your compass Page 7 Activity:
Map Patterns and Finding the Strike and Dip from a Mapped Outcrop of a Planar Surface
 Map Patterns and Finding the Strike and Dip from a Mapped Outcrop of a Planar Surface Topographic maps represent the complex curves of earth s surface with contour lines that represent the intersection
Maps A Primer for Content & Production of Topographic Base Maps For Design Presented by SurvBase, LLC
 Maps A Primer for Content & Production of Topographic Base Maps For Design Presented by Definition and Purpose of, Map: a representation of the whole or a part of an area. Maps serve a wide range of purposes.
Numeracy and mathematics Experiences and outcomes
 Numeracy and mathematics Experiences and outcomes My learning in mathematics enables me to: develop a secure understanding of the concepts, principles and processes of mathematics and apply these in different
Numeracy Targets. I can count at least 20 objects
 Targets 1c I can read numbers up to 10 I can count up to 10 objects I can say the number names in order up to 20 I can write at least 4 numbers up to 10. When someone gives me a small number of objects
Chapter 5: Working with contours
 Introduction Contoured topographic maps contain a vast amount of information about the three-dimensional geometry of the land surface and the purpose of this chapter is to consider some of the ways in
Chapter 4: Representation of relief
 Introduction To this point in our discussion of maps we have been concerned only with their planimetric properties, those relating to the location of features in two-dimensional space. But of course we
MAP READING AND NAVIGATION
 Emergency Management Australia MAP READING AND NAVIGATION safer sustainable communities Emergency Management Australia is a Division of the Attorney-General s Department PART IV Skills for Emergency Services
Weekend Cabin Retreat Project Site Plans
 Weekend Cabin Retreat Project Site Plans Sacramento City College EDT 300/ENGR 306 EDT 300/ENGR 306 - Site Plans 1 Cabin Project Site Plan/Bubble Diagram - Assignment 1 =10-0 Floor Plan - Assignment 1/4
Experiment 5: Magnetic Fields of a Bar Magnet and of the Earth
 MASSACHUSETTS INSTITUTE OF TECHNOLOGY Department of Physics 8.02 Spring 2005 Experiment 5: Magnetic Fields of a Bar Magnet and of the Earth OBJECTIVES 1. To examine the magnetic field associated with a
Motion & The Global Positioning System (GPS)
") Grade Level: K - 8 Subject: Motion Prep Time: < 10 minutes Duration: 30 minutes Objective: To learn how to analyze GPS data in order to track an object and derive its velocity from positions and times.
Grade Level: K - 8 Subject: Motion Prep Time: < 10 minutes Duration: 30 minutes Objective: To learn how to analyze GPS data in order to track an object and derive its velocity from positions and times.
OBJECTIVES. Identify the means by which latitude and longitude were created and the science upon which they are based.
 Name: Key OBJECTIVES Correctly define: isolines, gradient, topographic map, contour interval, hachured lines, profile, latitude, longitude, hydrosphere, lithosphere, atmosphere, elevation, model EARTH
Geometry Notes PERIMETER AND AREA
 Perimeter and Area Page 1 of 57 PERIMETER AND AREA Objectives: After completing this section, you should be able to do the following: Calculate the area of given geometric figures. Calculate the perimeter
Revision Notes Adult Numeracy Level 2
 Revision Notes Adult Numeracy Level 2 Place Value The use of place value from earlier levels applies but is extended to all sizes of numbers. The values of columns are: Millions Hundred thousands Ten thousands
The Map Grid of Australia 1994 A Simplified Computational Manual
 The Map Grid of Australia 1994 A Simplified Computational Manual The Map Grid of Australia 1994 A Simplified Computational Manual 'What's the good of Mercator's North Poles and Equators, Tropics, Zones
Reflection and Refraction
 Equipment Reflection and Refraction Acrylic block set, plane-concave-convex universal mirror, cork board, cork board stand, pins, flashlight, protractor, ruler, mirror worksheet, rectangular block worksheet,
Lesson 26: Reflection & Mirror Diagrams
 Lesson 26: Reflection & Mirror Diagrams The Law of Reflection There is nothing really mysterious about reflection, but some people try to make it more difficult than it really is. All EMR will reflect
Freehand Sketching. Sections
 3 Freehand Sketching Sections 3.1 Why Freehand Sketches? 3.2 Freehand Sketching Fundamentals 3.3 Basic Freehand Sketching 3.4 Advanced Freehand Sketching Key Terms Objectives Explain why freehand sketching
Level 1 - Maths Targets TARGETS. With support, I can show my work using objects or pictures 12. I can order numbers to 10 3
 Ma Data Hling: Interpreting Processing representing Ma Shape, space measures: position shape Written Mental method s Operations relationship s between them Fractio ns Number s the Ma1 Using Str Levels
SESSION 8: GEOGRAPHIC INFORMATION SYSTEMS AND MAP PROJECTIONS
 SESSION 8: GEOGRAPHIC INFORMATION SYSTEMS AND MAP PROJECTIONS KEY CONCEPTS: In this session we will look at: Geographic information systems and Map projections. Content that needs to be covered for examination
Unit 6 Direction and angle
 Unit 6 Direction and angle Three daily lessons Year 4 Spring term Unit Objectives Year 4 Recognise positions and directions: e.g. describe and find the Page 108 position of a point on a grid of squares
Searching Land Records thru the BLM General Land Office Records.
 Searching Land Records thru the BLM General Land Office Records. Land Records can be an exciting addition to your family history search. The United States Government transferred ownership of land to millions
MD5-26 Stacking Blocks Pages 115 116
 MD5-26 Stacking Blocks Pages 115 116 STANDARDS 5.MD.C.4 Goals Students will find the number of cubes in a rectangular stack and develop the formula length width height for the number of cubes in a stack.
Three daily lessons. Year 5
 Unit 6 Perimeter, co-ordinates Three daily lessons Year 4 Autumn term Unit Objectives Year 4 Measure and calculate the perimeter of rectangles and other Page 96 simple shapes using standard units. Suggest
Topographic Survey. Topographic Survey. Topographic Survey. Topographic Survey. CIVL 1101 Surveying - Introduction to Topographic Modeling 1/8
 IVL 1 Surveying - Introduction to Topographic Modeling 1/8 Introduction Topography - defined as the shape or configuration or relief or three dimensional quality of a surface Topography maps are very useful
PREFACE. The many TRADOC service schools and DOD agencies that produce the ACCP materials administered by the AIPD develop them to the DETC standards.
 PREFACE The Army Institute for Professional Development (AIPD) administers the consolidated Army Correspondence Course Program (ACCP), which provides highquality, economical training to its users. The
PLOTTING SURVEYING DATA IN GOOGLE EARTH
 PLOTTING SURVEYING DATA IN GOOGLE EARTH D M STILLMAN Abstract Detail surveys measured with a total station use local coordinate systems. To make the data obtained from such surveys compatible with Google
3D Drawing. Single Point Perspective with Diminishing Spaces
 3D Drawing Single Point Perspective with Diminishing Spaces The following document helps describe the basic process for generating a 3D representation of a simple 2D plan. For this exercise we will be
Unit 8 Angles, 2D and 3D shapes, perimeter and area
 Unit 8 Angles, 2D and 3D shapes, perimeter and area Five daily lessons Year 6 Spring term Recognise and estimate angles. Use a protractor to measure and draw acute and obtuse angles to Page 111 the nearest
CHAPTER 4 LEGAL DESCRIPTION OF LAND DESCRIBING LAND METHODS OF DESCRIBING REAL ESTATE
 r CHAPTER 4 LEGAL DESCRIPTION OF LAND DESCRIBING LAND A legal description is a detailed way of describing a parcel of land for documents such as deeds and mortgages that will be accepted in a court of
Area and Circumference
 4.4 Area and Circumference 4.4 OBJECTIVES 1. Use p to find the circumference of a circle 2. Use p to find the area of a circle 3. Find the area of a parallelogram 4. Find the area of a triangle 5. Convert
Basic Elements of Reading Plans
 Center for Land Use Education and Research at the University of Connecticut Basic Elements of Reading Plans University of Connecticut. The University of Connecticut supports all state and federal laws
Coordinate Systems. Orbits and Rotation
 Coordinate Systems Orbits and Rotation Earth orbit. The earth s orbit around the sun is nearly circular but not quite. It s actually an ellipse whose average distance from the sun is one AU (150 million
LIGHT SECTION 6-REFRACTION-BENDING LIGHT From Hands on Science by Linda Poore, 2003.
 LIGHT SECTION 6-REFRACTION-BENDING LIGHT From Hands on Science by Linda Poore, 2003. STANDARDS: Students know an object is seen when light traveling from an object enters our eye. Students will differentiate
3D Drawing. Single Point Perspective with Diminishing Spaces
 3D Drawing Single Point Perspective with Diminishing Spaces The following document helps describe the basic process for generating a 3D representation of a simple 2D plan. For this exercise we will be
Watershed Delineation
 ooooo Appendix D: Watershed Delineation Department of Environmental Protection Stream Survey Manual 113 Appendix D: Watershed Delineation Imagine a watershed as an enormous bowl. As water falls onto the
Mathematics K 6 continuum of key ideas
 Mathematics K 6 continuum of key ideas Number and Algebra Count forwards to 30 from a given number Count backwards from a given number in the range 0 to 20 Compare, order, read and represent to at least
Which month has larger and smaller day time?
 ACTIVITY-1 Which month has larger and smaller day time? Problem: Which month has larger and smaller day time? Aim: Finding out which month has larger and smaller duration of day in the Year 2006. Format
Lesson #13 Congruence, Symmetry and Transformations: Translations, Reflections, and Rotations
 Math Buddies -Grade 4 13-1 Lesson #13 Congruence, Symmetry and Transformations: Translations, Reflections, and Rotations Goal: Identify congruent and noncongruent figures Recognize the congruence of plane
FUNDAMENTALS OF LANDSCAPE TECHNOLOGY GSD Harvard University Graduate School of Design Department of Landscape Architecture Fall 2006
 FUNDAMENTALS OF LANDSCAPE TECHNOLOGY GSD Harvard University Graduate School of Design Department of Landscape Architecture Fall 2006 6106/ M2 BASICS OF GRADING AND SURVEYING Laura Solano, Lecturer Name
Roof Tutorial. Chapter 3:
 Chapter 3: Roof Tutorial The majority of Roof Tutorial describes some common roof styles that can be created using settings in the Wall Specification dialog and can be completed independent of the other
Stellarium a valuable resource for teaching astronomy in the classroom and beyond
 Stellarium 1 Stellarium a valuable resource for teaching astronomy in the classroom and beyond Stephen Hughes Department of Physical and Chemical Sciences, Queensland University of Technology, Gardens
ELEMENTS OF SURVEYING FOR CADASTRAL MAPPING
 ELEMENTS OF SURVEYING FOR CADASTRAL MAPPING Chapter 4 2015 Cadastral Mapping Manual 4-0 Elements of Surveying and Mapping Utah's system of land surveying is the rectangular survey system as set forth on
ALGEBRA. sequence, term, nth term, consecutive, rule, relationship, generate, predict, continue increase, decrease finite, infinite
 ALGEBRA Pupils should be taught to: Generate and describe sequences As outcomes, Year 7 pupils should, for example: Use, read and write, spelling correctly: sequence, term, nth term, consecutive, rule,
12-1 Representations of Three-Dimensional Figures
 Connect the dots on the isometric dot paper to represent the edges of the solid. Shade the tops of 12-1 Representations of Three-Dimensional Figures Use isometric dot paper to sketch each prism. 1. triangular
Cambridge International Examinations Cambridge International General Certificate of Secondary Education
 Cambridge International Examinations Cambridge International General Certificate of Secondary Education *0123456789* GEOGRAPHY 0460/02 Paper 2 Geographical skills For Examination from 2016 SPECIMEN PAPER
Slope Density. Appendix F F-1 STATEMENT OF PURPOSE DISCUSSION OF SLOPE
 Appendix F Slope Density F-1 STATEMENT OF PURPOSE This document has been prepared with the intent of acquainting the general reader with the slope-density approach to determining the intensity of residential
Advice For the multiple-choice questions, completely fill in the circle alongside the appropriate answer(s).
.") SPECIMEN ASSESSMENT MATERIAL GCSE GEOGRAPHY Paper 1 Living with the physical environment Specimen Materials For this paper you must have: a pencil a ruler. Time allowed: 1 hour 30 minutes Instructions
SPECIMEN ASSESSMENT MATERIAL GCSE GEOGRAPHY Paper 1 Living with the physical environment Specimen Materials For this paper you must have: a pencil a ruler. Time allowed: 1 hour 30 minutes Instructions
10-4-10 Year 9 mathematics: holiday revision. 2 How many nines are there in fifty-four?
 DAY 1 Mental questions 1 Multiply seven by seven. 49 2 How many nines are there in fifty-four? 54 9 = 6 6 3 What number should you add to negative three to get the answer five? 8 4 Add two point five to
EDEXCEL FUNCTIONAL SKILLS PILOT TEACHER S NOTES. Maths Level 2. Chapter 5. Shape and space
 Shape and space 5 EDEXCEL FUNCTIONAL SKILLS PILOT TEACHER S NOTES Maths Level 2 Chapter 5 Shape and space SECTION H 1 Perimeter 2 Area 3 Volume 4 2-D Representations of 3-D Objects 5 Remember what you
6. The greatest atmospheric pressure occurs in the 1) troposphere 3) mesosphere 2) stratosphere 4) thermosphere
 troposphere 3) mesosphere 2) stratosphere 4) thermosphere") 1. The best evidence of the Earth's nearly spherical shape is obtained through telescopic observations of other planets photographs of the Earth from an orbiting satellite observations of the Sun's altitude
1. The best evidence of the Earth's nearly spherical shape is obtained through telescopic observations of other planets photographs of the Earth from an orbiting satellite observations of the Sun's altitude
Pre and post-visit activities - Navigating by the stars
 Pre and post-visit activities - Navigating by the stars Vocabulary List Adult Education at Scienceworks Pre-visit Activity 1: What is longitude and latitude? Activity 2: Using the Southern Cross to find
Navigation: Latitude and Longitude
 Sextants and Chronometers Help Sailors Find Their Position at Sea Latitude lines run horizontally across the globe and are used to measure distances north and south of the equator. Sailors used a sextant
Unit 4 Measures time, mass and area
 Unit 4 Measures time, mass and area Five daily lessons Year 4 Spring term (Key objectives in bold) Unit Objectives Year 4 Estimate/check times using seconds, minutes, hours. Page 98 Know and use the relationships
4 The Rhumb Line and the Great Circle in Navigation
 4 The Rhumb Line and the Great Circle in Navigation 4.1 Details on Great Circles In fig. GN 4.1 two Great Circle/Rhumb Line cases are shown, one in each hemisphere. In each case the shorter distance between
compass Encyclopedic Entry
 This website would like to remind you: Your browser (Apple Safari 7) is out of date. Update your browser for more security, comfort and the best experience on this site. Encyclopedic Entry compass For
International Specification for Ski Orienteering Maps ISSkiOM
 International Specification for Ski Orienteering Maps ISSkiOM Rev 12 February 2015 corrected mistake (PMS 345-> PMS 354), page 3 2014 Approved by IOF Ski Orienteering Commission, October 2014 Approved
Organizing a class orienteering event
 Organizing a class orienteering event Orienteering is a wonderful teaching tool. It allows the teacher to illustrate many abstract ideas in concrete terms. The sport also appeals to students operating
Geometric Optics Converging Lenses and Mirrors Physics Lab IV
 Objective Geometric Optics Converging Lenses and Mirrors Physics Lab IV In this set of lab exercises, the basic properties geometric optics concerning converging lenses and mirrors will be explored. The
Year 9 mathematics test
 Ma KEY STAGE 3 Year 9 mathematics test Tier 5 7 Paper 1 Calculator not allowed First name Last name Class Date Please read this page, but do not open your booklet until your teacher tells you to start.
MECHANICS OF SOLIDS - BEAMS TUTORIAL 2 SHEAR FORCE AND BENDING MOMENTS IN BEAMS
 MECHANICS OF SOLIDS - BEAMS TUTORIAL 2 SHEAR FORCE AND BENDING MOMENTS IN BEAMS This is the second tutorial on bending of beams. You should judge your progress by completing the self assessment exercises.
Charlesworth School Year Group Maths Targets
 Charlesworth School Year Group Maths Targets Year One Maths Target Sheet Key Statement KS1 Maths Targets (Expected) These skills must be secure to move beyond expected. I can compare, describe and solve
The Globe Latitudes and Longitudes
 INDIAN SCHOOL MUSCAT MIDDLE SECTION DEPARTMENT OF SOCIAL SCIENCE The Globe Latitudes and Longitudes NAME: CLASS VI SEC: ROLL NO: DATE:.04.2015 I NAME THE FOLLOWING: 1. A small spherical model of the Earth:
Technical Drawing Specifications Resource A guide to support VCE Visual Communication Design study design 2013-17
 A guide to support VCE Visual Communication Design study design 2013-17 1 Contents INTRODUCTION The Australian Standards (AS) Key knowledge and skills THREE-DIMENSIONAL DRAWING PARALINE DRAWING Isometric
Stage 4. Geography. Blackline Masters. By Karen Devine
 1 Devine Educational Consultancy Services Stage 4 Geography Blackline Masters By Karen Devine Updated January 2010 2 This book is intended for the exclusive use in NSW Secondary Schools. It is meant to
EARTH SCIENCES - TYPES OF MAPS TEACHER GUIDE
 EARTH SCIENCES - TYPES OF MAPS TEACHER GUIDE MATERIALS: Electronic Reader - Maps 5 different types of maps (see lab) inflatable globes local topographical map Objective: To understand the uses and importance
How do you find a place on a globe? How do you look up a place based on latitude and longitude?
 Why are globes tilted? Most Replogle globes are made to tilt at an angle of 23.5º to match the actual tilt of the earth in relationship to our sun. Incidentally, it is this tilting of the earth relative
Unit 5 Length. Year 4. Five daily lessons. Autumn term Unit Objectives. Link Objectives
 Unit 5 Length Five daily lessons Year 4 Autumn term Unit Objectives Year 4 Suggest suitable units and measuring equipment to Page 92 estimate or measure length. Use read and write standard metric units
Phonics. High Frequency Words P.008. Objective The student will read high frequency words.
 P.008 Jumping Words Objective The student will read high frequency words. Materials High frequency words (P.HFW.005 - P.HFW.064) Choose target words. Checkerboard and checkers (Activity Master P.008.AM1a
Geomatics Guidance Note 3
 Geomatics Guidance Note 3 Contract area description Revision history Version Date Amendments 5.1 December 2014 Revised to improve clarity. Heading changed to Geomatics. 4 April 2006 References to EPSG
Mathematics. Steps to Success. and. Top Tips. Year 5
 Pownall Green Primary School Mathematics and Year 5 1 Contents Page 1. Multiplication and Division 3 2. Positive and Negative Numbers 4 3. Decimal Notation 4. Reading Decimals 5 5. Fractions Linked to
Principles of groundwater flow
 Principles of groundwater flow Hydraulic head is the elevation to which water will naturally rise in a well (a.k.a. static level). Any well that is not being pumped will do for this, but a well that is
UNIVERSITY OF WASHINGTON Facilities Services Design Guide. Civil. Topographical Survey. Design Evaluation. Construction Submittals
 This section applies to design standards and procedures involved in the field location and plotting of all natural objects and surface improvements. This section also includes the requirements for submittal
Graphical Integration Exercises Part Four: Reverse Graphical Integration
 D-4603 1 Graphical Integration Exercises Part Four: Reverse Graphical Integration Prepared for the MIT System Dynamics in Education Project Under the Supervision of Dr. Jay W. Forrester by Laughton Stanley
Allows teachers to print reports for individual students or an entire class.
 Map and Globe Skills Developed by teachers and geography specialists, Map and Globe Skills provides the strategies, skills and practice your students need to develop a strong understanding of basic mapping
Excel -- Creating Charts
 Excel -- Creating Charts The saying goes, A picture is worth a thousand words, and so true. Professional looking charts give visual enhancement to your statistics, fiscal reports or presentation. Excel
Wednesday 13 June 2012 Morning
 THIS IS A NEW SPECIFICATION F Wednesday 13 June 2012 Morning GCSE MATHEMATICS B J567/02 Paper 2 (Foundation Tier) *J517120612* Candidates answer on the Question Paper. OCR supplied materials: None Other
Cambridge International Examinations Cambridge Primary Checkpoint
 Cambridge International Examinations Cambridge Primary Checkpoint MATHEMATICS 0845/02 Paper 2 For Examination from 2014 SPECIMEN PAPER 45 minutes Candidates answer on the Question Paper. Additional Materials:
PRACTICAL BLOCK COMPASS BASICS. Compass Basics. Introduction. The Silva Compass
 Compass Basics Introduction The first compass was, no doubt, a magnetised ore-bearing rock or stone, that when suspended, would always point the same way. No one knows who first discovered the compass;
Learning about GPS and GIS
 Learning about GPS and GIS Standards 4.4 Understand geographic information systems (G.I.S.). B12.1 Understand common surveying techniques used in agriculture (e.g., leveling, land measurement, building
Focus On You Photography TRT from Brockway Summit to Watson Lake
 Tahoe Rim Trail (TRT) From Hwy 267 (Brockway Summit) west to Watson Lake (Strong Intermediate Advanced) This trail is very demanding. It is almost 2100 ft. of climbing. The trail is up and down, up and
Traditional Drawing Tools
 Engineering Drawing Traditional Drawing Tools DRAWING TOOLS DRAWING TOOLS 1. T-Square 2. Triangles DRAWING TOOLS HB for thick line 2H for thin line 3. Adhesive Tape 4. Pencils DRAWING TOOLS 5. Sandpaper
Mapping the Magnetic Field
 I Mapping the Magnetic Field Mapping the Magnetic Field Vector Fields The electric field, E, and the magnetic field, B, are two examples of what are termed vector fields, quantities which have both magnitude
Investigation 6: What happens when plates collide?
 Tectonics Investigation 6: Teacher Guide Investigation 6: What happens when plates collide? In this activity, students will use the distribution of earthquakes and volcanoes in a Web GIS to learn about
How To Read Maps And Aerial Photos
 3 Read Maps and Aerial Photos WRITING SAMPLE (training guide) Stephen X. Arthur, technical writer 2005 www.transcanfilm.com/stephenarthur First draft. Copyright 1996, BC Ministry of Forests / BC Institute
UTM: Universal Transverse Mercator Coordinate System
 Practical Cartographer s Reference #01 UTM: Universal Transverse Mercator Coordinate System 180 174w 168w 162w 156w 150w 144w 138w 132w 126w 120w 114w 108w 102w 96w 90w 84w 78w 72w 66w 60w 54w 48w 42w
Physical Quantities and Units
 Physical Quantities and Units 1 Revision Objectives This chapter will explain the SI system of units used for measuring physical quantities and will distinguish between vector and scalar quantities. You
Lines on Maps and Globes. Cross Curricular Writing Activity Social Studies Grade 4
 Lines on Maps and Globes Cross Curricular Writing Activity Social Studies Grade 4 Fourth Grade Social Studies Standard Map: Chart/Globe The learner will be able to use maps, charts, graphs, and globes
Session 7 Bivariate Data and Analysis
 Session 7 Bivariate Data and Analysis Key Terms for This Session Previously Introduced mean standard deviation New in This Session association bivariate analysis contingency table co-variation least squares
ME 111: Engineering Drawing
 ME 111: Engineering Drawing Lecture # 14 (10/10/2011) Development of Surfaces http://www.iitg.ernet.in/arindam.dey/me111.htm http://www.iitg.ernet.in/rkbc/me111.htm http://shilloi.iitg.ernet.in/~psr/ Indian
The Dynamic Crust 2) EVIDENCE FOR CRUSTAL MOVEMENT
 EVIDENCE FOR CRUSTAL MOVEMENT") The Dynamic Crust 1) Virtually everything you need to know about the interior of the earth can be found on page 10 of your reference tables. Take the time to become familiar with page 10 and everything
The Dynamic Crust 1) Virtually everything you need to know about the interior of the earth can be found on page 10 of your reference tables. Take the time to become familiar with page 10 and everything
Geometry and Measurement
 The student will be able to: Geometry and Measurement 1. Demonstrate an understanding of the principles of geometry and measurement and operations using measurements Use the US system of measurement for
Grade 1 Geometric Shapes Conceptual Lessons Unit Outline Type of Knowledge & SBAC Claim Prerequisite Knowledge:
 Grade 1 Geometric Shapes Conceptual Lessons Unit Outline Type of Knowledge & SBAC Claim Prerequisite Knowledge: Standards: Lesson Title and Objective/Description Shape names: square, rectangle, triangle,
2After completing this chapter you should be able to
 After completing this chapter you should be able to solve problems involving motion in a straight line with constant acceleration model an object moving vertically under gravity understand distance time