Non-parametric estimation of seasonal variations in GNSS-derived time series
|
|
|
- Coral Pope
- 8 years ago
- Views:
Transcription

1 Military University of Technology, Poland Seasonal variations in the frame sites can bias the frame realization. I would like to invite you to click on each of the four steps outlined on this slide in order to obtain more information on the particular subject. Figures can be enlarged by clicking on that figure.
 were even 22 years long (1992-2014).")
2 The details concerning the processing of the GNSS observations can be found at DATA DATA We analysed 294 globally distributed IGS stations with the minimum data length of 6.5 years. The longest (DRAO, GRAZ, STJO, YELL) were even 22 years long ( ). We used position obtained by the Jet Propulsion Laboratory (JPL) using the GIPSY- OASIS software in a Precise Point Positioning (PPP) mode.
3 DATA Daily position changes from PPP (Precise Point Positioning) solution obtained by JPL (Jet Propulsion Laboratory) processed in the GIPSY-OASIS software. DATA Daily position changes from PPP (Precise Point Positioning) solution obtained by JPL (Jet Propulsion Laboratory) processed in the GIPSY-OASIS software.
4 DATA The seasonal variations in GNSS station s position may arise from geophysical excitations, thermal changes combined with hydrodynamics or various errors which, when superimposed, cause the seasonal oscillations. It are not exactly of real geodynamical origin, but still have to be included in modelling. These variations with different periods included in frequency band from Chandler up to quarter-annual ones will all affect the reliability of permanent station s velocity, which in turn, strictly influences the quality of kinematic reference frames. The annual (dominant) sine curve, has the amplitude and phase that both change in time due to different reasons. In this research we focused on the determination of annual changes in GNSS-derived of North, East and Up components.
5 DATA The figure shows a Lomb-Scargle periodogram of the GLSV station s.
6 DATA x( t) x n m 0 vx t i i i x j j x t i 1 j 1 off A sin( t ) O p x ( ) The potential contributors to seasonal variations can be grouped into: 1. gravitation excitation (Sun and Moon) 2. impact of environment: hydrodynamics, atmosphere, antenna thermal changes 3. system errors: satellite orbital models, phase center variation models, local multipath...
7 DATA The outliers from were removed by means of the median absolute deviation criterion (MAD). The offsets were removed by STARS algoritm (Sequential t-test Analusis of Regime Shifts), which is a combianation of the t-student and the standard deviation test. The linear trend was removed from the using least squares estimation (LSE). Figure. Blue curve represents the without outlieres, offsets and linear trend for the North, East and Up component of BRAZ station.

8 Non-parametric estimation of DATA The linear trend was removed from the time series using least squares estimation (LSE).

9 STACKED Each of the topocentric (North, East and Up) was divided into years (from January to December), then the observations gathered in the same days of year were stacked and the weighted medians obtained for all of them such that each of was represented by matrix of size 365xn where n is the data length. Figure. Blue dots represent the stacked data.
10
11 STACKED We obtainted the weighted median for each day of year with their WMAD (the weighted median absolute deviation). Figure right. Blue dots represent the stacked data and black curve represents the daily medians. Figure left. Blue curve with red dots represents the computed weighted median for each day of year. Grey lines represent the weighted median absolute deviation.
12

13 Non-parametric estimation of
14 Wavelet decomposition The wavelet transform allows us to decompose the original time series into a number of new, each with a different degree of resolution. We used a symmetric and orthogonal Meyer s wavelet for this task, because it is compact in the frequency domain. Figures. The Meyer wavelet decomposition frequency levels for the North, East and Up component of the BRAZ station. Red curve represents an original signal, green curve represents a wavelet quasi-annual approximation of 7 levels and blue curves represent the detail levels D1 - D7, respectively.
15 Wavelet decomposition The wavelet transform provides a framework to decompose original into a number of new, each one of them with a different degree of resolutions.
16 Wavelet decomposition The wavelet transform provides a framework to decompose original into a number of new, each one of them with a different degree of resolutions.
17 Wavelet decomposition The wavelet transform provides a framework to decompose original into a number of new, each one of them with a different degree of resolutions.
18 Wavelet decomposition Transformation into different frequency bands was done using wavelet decomposition with Meyer wavelet. We assumed here 7 levels of decomposition, with annual curve as the last approximation of it. The signal approximations made us obtain the seasonal peaks that prevail in North, East and Up data for globally distributed stations. Figure. Blue dots represent the stacked data, black curve represents the daily medians; red curve represents a wavelet quasi-annual approximation.

19 Non-parametric estimation of Wavelet decomposition
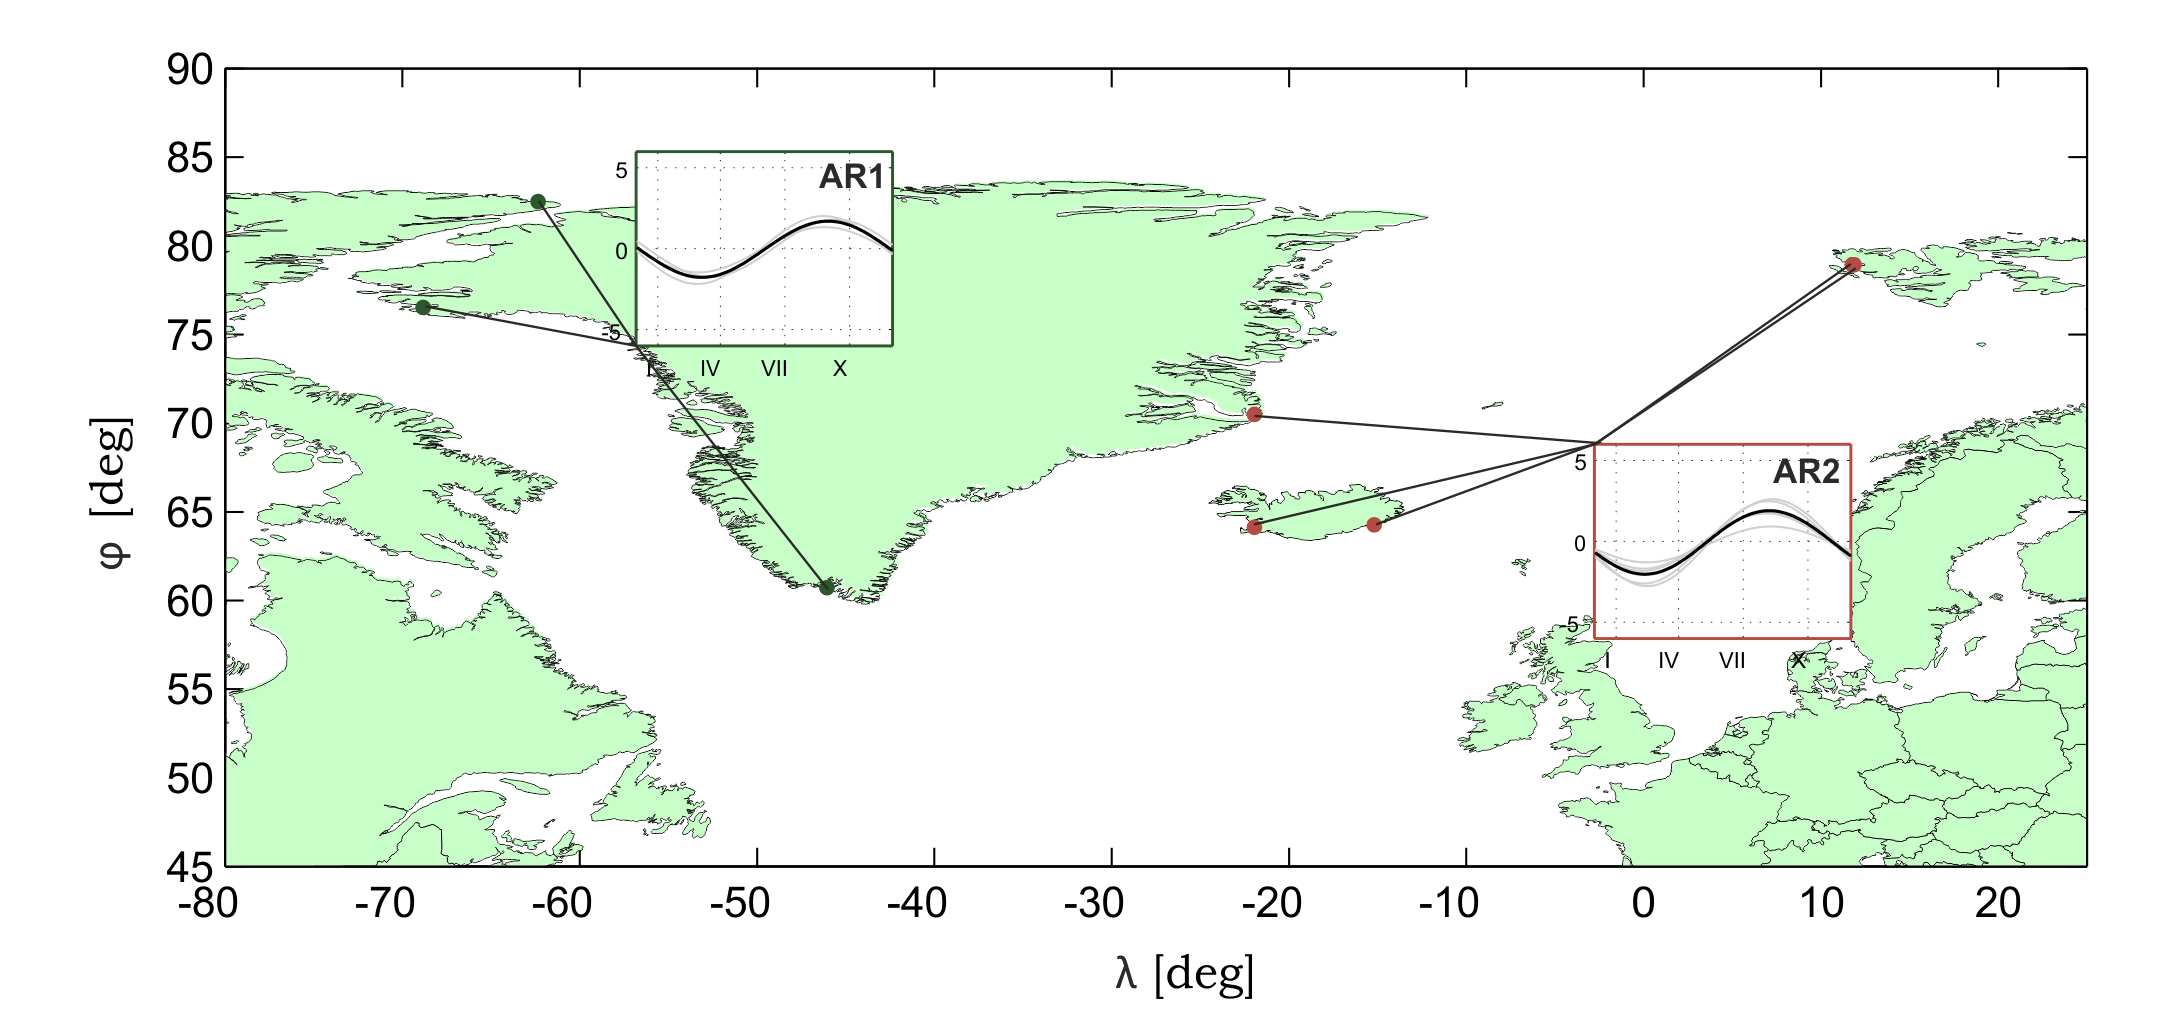
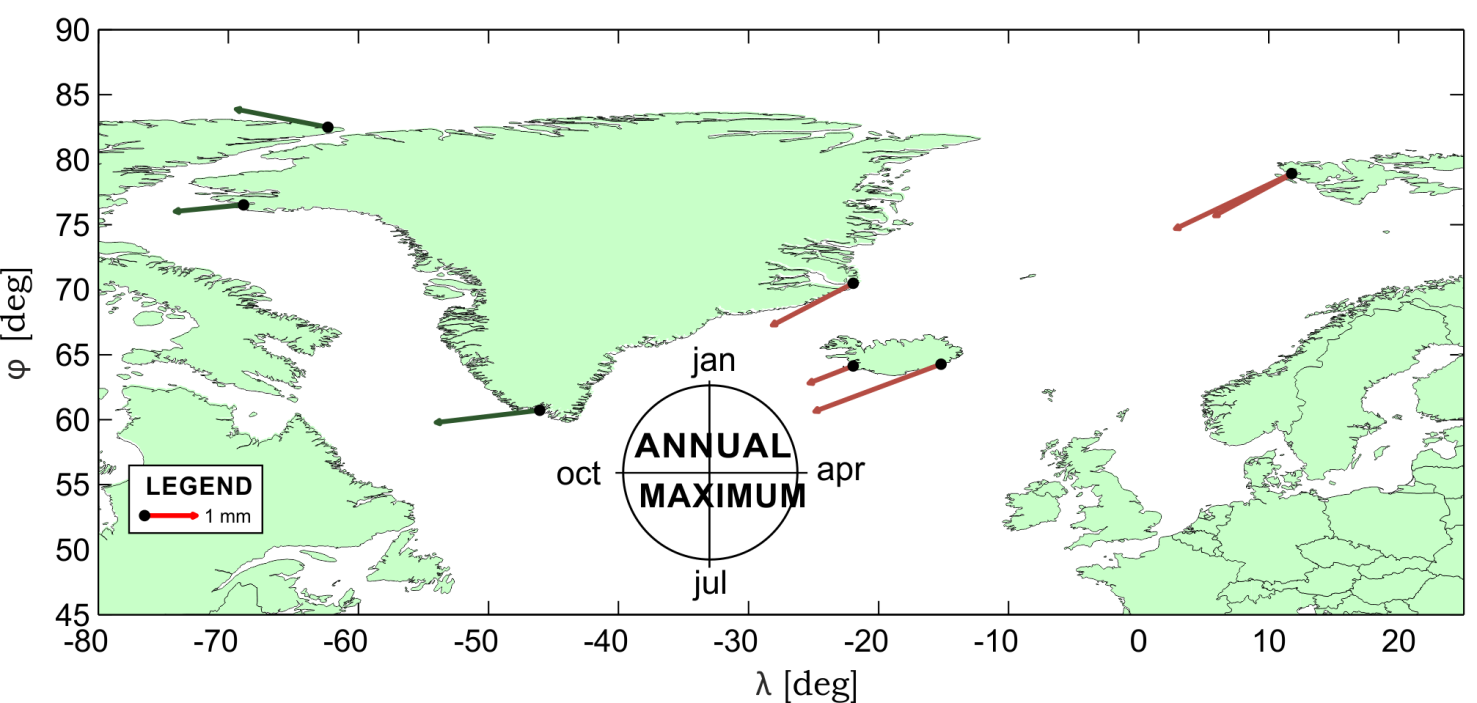
20 CLUSTERING The vast majority of stations is characterized by amplitudes of 2 to 4 mm. The maximum vertical amplitude was noticed to be at the level of 9 mm with the minimum of it equal to -9 mm, what gives the position change of 18 mm when peak-to-peak changes are considered. The amplitudes and phases of quasi-annual curves in the vertical direction. The length of the arrow means the value of the amplitude, while the azimuth-like angle stays for phase of the quasiannual maximum.

21 CLUSTERING The analysis of annual curves (approximations), led to divide the stations into clusters for which the similar signal were noticed. The amplitudes and phases of quasi-annual curves in the vertical direction. The length of the arrow means the value of the amplitude, while the azimuth-like angle stays for phase of the quasi-annual maximum.

22 The analysis of annual curves, by means of non-parametric estimation of amplitudes CLUSTERING and phases, led us to divide the IGS stations into different clusters for which the similar signals were noticed. We define a parameter, = 30 days, which specifies the maximum acceptable phase difference for stations classified within a cluster. The next parameter, Y, is defined as the maximum distance between any two stations within a cluster (e.g. Europe Y=2000 km). We obtained 36 clusters for the Up component. The division of IGS stations into a few different clusters led us to obtain the mean seasonal signal for different regions of the world. The quasi-annual signals were then averaged within each cluster and the average annual signal was revealed.
23 CLUSTERING
24 CLUSTERING
25 CLUSTERING Arctic All stations were grouped into 9 sets North America Europe Asia of clusters in order to present the results better. This division is related to the location of continents (e.g. Pacific Ocean South America Africa Indian Ocean & Australia Africa, North America), the ocean (Pacific Ocean) and the region Antarctica (Indian Ocean and Australia). The division the IGS stations into different clusters was presented for each of the group. The results can be viewed by clicking on the yellow rectangle with the set of cluster name.
26 CLUSTERING North America Arctic Europe Asia Pacific Ocean South America Africa Indian Ocean & Australia Antarctica The analysis of annual curves (approximations), led to divide the stations into clusters for which the similar signal were noticed. The results can be viewed by clicking on the yellow rectangle with the set of cluster name.
27 ARCTIC The stations in the Arctic were divided into two clusters: AR1 and AR2. Both of them have the maximum of annual signal in September. These stations can be characterized by vertical changes of 1-3 mm with their maximum in autumn.
28 NORTH
29 NORTH
30 NORTH
. The cluster NA3 has the maximum in summer.")
31 NORTH AMERICA Military University of Technology, Poland The stations in the North America were divided into six clusters: NA1 to NA6. For the majority of the clusters, the annual signal in the vertical coordinates was observed to have its maximum in autumn (NA1, NA2, NA4, NA5). The cluster NA3 has the maximum in summer. The cluster NA6 has the maximum in spring and includes the station situated the closest to the ocean.

32 NORTH AMERICA

33 NORTH AMERICA
34 NORTH AMERICA
 observe the 6-month twist in phase from South to North in the annual signals. The AMERICA cluster SA1 has the maximum in September and the cluster SA2 has in March.")
35 The stations in the South America were divided into two clusters: SA1 and SA2. We can Military University SOUTH of Technology, Poland observe the 6-month twist in phase from South to North in the annual signals. The AMERICA cluster SA1 has the maximum in September and the cluster SA2 has in March. It is worth noting that stations situated in the South America (especially ANTC, BRAZ) have the greatest annual amplitudes when compared with the rest of the stations.
36 SOUTH AMERICA

37 SOUTH AMERICA
38 SOUTH AMERICA
39 The stations in the Antarctica were divided into two clusters: AN1 and AN2. The ANTARCTICA cluster AN1 has the maximum in autumn and the cluster AN2 has the maximum in winter. These stations are characterized by amplitudes of 2-4 mm.

40 SOUTH

41 SOUTH
42 SOUTH The annual curves in vertical direction for different clusters.

43 The stations in the Europe were divided into eight clusters: E1 to E8. For the majority of the clusters, the annual signal in the vertical coordinates has a minimum in Spring EUROPE and a maximum in Autumn. The clusters differ in terms of their quasi-annual amplitude. The clusters E2 and E7 have a clear maximum in Spring and include the stations situated the closest to the ocean. It is worth noting that stations situated in the eastern Europe (especially clusters E5 and E8) have the greatest annual amplitudes when compared with the rest of the clusters.
44 EUROPE
45 EUROPE
46 EUROPE
47 PACIFIC OCEAN Military University of Technology, Poland The stations in the Pacific Ocean were divided into two clusters: P1 and P2. Both of them have the maximum of annual signal in April. These stations are characterized by mean annual amplitude of 2.5 mm.
48 PACIFIC OCEAN
49 PACIFIC OCEAN
50 PACIFIC OCEAN
 significantly different average mean annual signals in the vertical coordinates, whereby the mainly continental clusters AS1 - AS4 have the maximum in Autumn.")
51 ASIA The stations in the Asia were divided into six clusters: AS1 to AS6. All of the Asian Military University of Technology, clusters Poland have significantly different average mean annual signals in the vertical coordinates, whereby the mainly continental clusters AS1 - AS4 have the maximum in Autumn. For the majority of the clusters in the east Asia, the annual signal has its maximum in Spring (AS5, AS6). These stations are situated the closest to the ocean and have the greatest annual amplitudes when compared with the rest of the stations.
52 ASIA

53 ASIA
54 ASIA

55 AFRICA The stations in the Africa were divided into two clusters: AF1 and AF2. Both of them have the maximum of annual signal in April. These stations are characterized by vertical amplitudes of 1-4 mm.
56 AFRICA

57 AFRICA
58 AFRICA
59 The stations in the Indian Ocean and the Australia were divided into six clusters. For the majority of the clusters, the annual signal in the vertical coordinates has its INDIAN OCEAN & AUSTRALIA maximum in Autumn (AU2, AU3, AU4, AU5 and IO1). These stations are characterized by vertical changes of 1-2 mm. The cluster AU1 on the north coast of Australia does not have its maximum annual signal in April or May, as the other stations, only twisted 6-months (in Spring).
60 Indian Ocean & Australia
61 Indian Ocean & Australia
62 Indian Ocean & Australia
63 CLUSTERING Our results show that the station s location has the impact on annual curve character and can be related to ocean s vicinity or climate changes. Here, the greatest seasonal amplitudes were noticed for Up component what may arise from atmospheric and hydrospheric influences. The reason of wavelet decomposition usage is the fact that the majority of determined seasonal curves is far from being a sine wave. The division of IGS stations into a few different clusters led us to obtain the mean seasonal signal for different regions of the world.
64 This research was financed by the Faculty of Civil Engineering and Geodesy of the Military University of Technology statutory research funds.
GPS Precise Point Positioning as a Method to Evaluate Global TanDEM-X Digital Elevation Model
 GPS Precise Point Positioning as a Method to Evaluate Global TanDEM-X Digital Elevation Model 7 th FIG Regional Conference TS 1C Advances in GNSS Positioning and Applications I Volker Schwieger 1, Jürgen
The Status and Development of the APREF GNSS Network Guorong Hu
 The Status and Development of the APREF GNSS Network Guorong Hu Geodesy, Geoscience Australia, Canberra, Australia Outline Introduction Objectives How the reference frame is derived Services and applications
Geography affects climate.
 KEY CONCEPT Climate is a long-term weather pattern. BEFORE, you learned The Sun s energy heats Earth s surface unevenly The atmosphere s temperature changes with altitude Oceans affect wind flow NOW, you
The following words and their definitions should be addressed before completion of the reading:
 Seasons Vocabulary: The following words and their definitions should be addressed before completion of the reading: sphere any round object that has a surface that is the same distance from its center
Tropical Horticulture: Lecture 2
 Lecture 2 Theory of the Tropics Earth & Solar Geometry, Celestial Mechanics The geometrical relationship between the earth and sun is responsible for the earth s climates. The two principal movements of
Intra-seasonal and Annual variability of the Agulhas Current from satellite observations
 Intra-seasonal and Annual variability of the Agulhas Current from satellite observations Marjolaine Krug Ecosystem Earth Observation (CSIR NRE) Pierrick Penven Laboratoire de Physique des Océans (IRD)
Online GPS processing services: an initial study
 GPS Solut (2006) 10: 12 20 DOI 10.1007/s10291-005-0147-5 ORIGINAL ARTICLE Reza Ghoddousi-Fard Peter Dare Online GPS processing services: an initial study Received: 15 September 2004 Accepted: 3 May 2005
Prof. Ludovico Biagi. Satellite Navigation and Monitoring
 Prof. Ludovico Biagi Satellite Navigation and Monitoring Navigation: trajectories control positions estimations in real time, at high frequency popular applications: low accuracy (10 m) required specific
Günter Seeber. Satellite Geodesy 2nd completely revised and extended edition
 Günter Seeber Satellite Geodesy 2nd completely revised and extended edition Walter de Gruyter Berlin New York 2003 Contents Preface Abbreviations vii xvii 1 Introduction 1 1.1 Subject of Satellite Geodesy...
IAntarcticaI. IArctic Ocean I. Where in the World? Arctic Ocean. Pacific Ocean. Pacific Ocean. Atlantic Ocean. North America.
 Name ------------------------------ Where in the World? Continents and s Arctic Pacific Pacific Atlantic.1.... 0" o ". North America South America Antarctica Arctic 261 Name Where in the World Continents
How Do Oceans Affect Weather and Climate?
 How Do Oceans Affect Weather and Climate? In Learning Set 2, you explored how water heats up more slowly than land and also cools off more slowly than land. Weather is caused by events in the atmosphere.
Robot Perception Continued
 Robot Perception Continued 1 Visual Perception Visual Odometry Reconstruction Recognition CS 685 11 Range Sensing strategies Active range sensors Ultrasound Laser range sensor Slides adopted from Siegwart
Name Period 4 th Six Weeks Notes 2015 Weather
 Name Period 4 th Six Weeks Notes 2015 Weather Radiation Convection Currents Winds Jet Streams Energy from the Sun reaches Earth as electromagnetic waves This energy fuels all life on Earth including the
Solar System. 1. The diagram below represents a simple geocentric model. Which object is represented by the letter X?
 Solar System 1. The diagram below represents a simple geocentric model. Which object is represented by the letter X? A) Earth B) Sun C) Moon D) Polaris 2. Which object orbits Earth in both the Earth-centered
GPS Precise Point Positioning with a Difference*
 GPS Precise Point Positioning with a Difference* Pierre Héroux and Jan Kouba Geodetic Survey Division, Geomatics Canada Natural Resources Canada 615 Booth Street Ottawa, Ontario K1A E9 heroux@geod.nrcan.gc.ca
Leica AR25 White Paper
 Leica AR25 White Paper February 2009 Lennon Bedford, Neil Brown, Justin Walford Leica Geosystems AG Heerbrugg, Switzerland 2 Biography Lennon Bedford graduated from the University of Otago in 2003 with
Assessing Long Term Trends in the Atmospheric Water Vapor Content by Combining Data From VLBI, GPS, Radiosondes and Microwave Radiometry
 Assessing Long Term Trends in the Atmospheric Water Vapor Content by Combining Data From VLBI, GPS, Radiosondes and Microwave Radiometry 1 Introduction Onsala Space Observatory, Chalmers University of
Temporal variation in snow cover over sea ice in Antarctica using AMSR-E data product
 Temporal variation in snow cover over sea ice in Antarctica using AMSR-E data product Michael J. Lewis Ph.D. Student, Department of Earth and Environmental Science University of Texas at San Antonio ABSTRACT
Graphing Sea Ice Extent in the Arctic and Antarctic
 Graphing Sea Ice Extent in the Arctic and Antarctic Summary: Students graph sea ice extent (area) in both polar regions (Arctic and Antarctic) over a three-year period to learn about seasonal variations
Global Seasonal Phase Lag between Solar Heating and Surface Temperature
 Global Seasonal Phase Lag between Solar Heating and Surface Temperature Summer REU Program Professor Tom Witten By Abstract There is a seasonal phase lag between solar heating from the sun and the surface
Dancing in the Dark: How GNSS Satellites Cross the Earth s Shadow
 Dancing in the Dark: How GNSS Satellites Cross the Earth s Shadow F. Dilssner, T. Springer, G. Gienger, R. Zandbergen European Space Operations Centre (ESOC), Darmstadt 24 January 2011 Technische Universität
Reasons for Seasons. Question: TRUE OR FALSE. Question: TRUE OR FALSE? What causes the seasons? What causes the seasons?
 Reasons for Seasons Question: TRUE OR FALSE? Earth is closer to the Sun in summer and farther from the Sun in winter. Question: TRUE OR FALSE? Earth is closer to the Sun in summer and farther from the
2.3 Spatial Resolution, Pixel Size, and Scale
 Section 2.3 Spatial Resolution, Pixel Size, and Scale Page 39 2.3 Spatial Resolution, Pixel Size, and Scale For some remote sensing instruments, the distance between the target being imaged and the platform,
European Position Determination System. Guideline for EUPOS Reference Frame Fixing
 European Position Determination System Guideline for EUPOS Reference Frame Fixing Version 1.0 21 September 2007 Copyright: Publisher: 2007 by the International EUPOS Steering Committee Office of the International
1. In the diagram below, the direct rays of the Sun are striking the Earth's surface at 23 º N. What is the date shown in the diagram?
 1. In the diagram below, the direct rays of the Sun are striking the Earth's surface at 23 º N. What is the date shown in the diagram? 5. During how many days of a calendar year is the Sun directly overhead
Ionospheric Research with the LOFAR Telescope
 Ionospheric Research with the LOFAR Telescope Leszek P. Błaszkiewicz Faculty of Mathematics and Computer Science, UWM Olsztyn LOFAR - The LOw Frequency ARray The LOFAR interferometer consist of a large
Radiative effects of clouds, ice sheet and sea ice in the Antarctic
 Snow and fee Covers: Interactions with the Atmosphere and Ecosystems (Proceedings of Yokohama Symposia J2 and J5, July 1993). IAHS Publ. no. 223, 1994. 29 Radiative effects of clouds, ice sheet and sea
Satellite Posi+oning. Lecture 5: Satellite Orbits. Jan Johansson jan.johansson@chalmers.se Chalmers University of Technology, 2013
 Lecture 5: Satellite Orbits Jan Johansson jan.johansson@chalmers.se Chalmers University of Technology, 2013 Geometry Satellite Plasma Posi+oning physics Antenna theory Geophysics Time and Frequency GNSS
AIR TEMPERATURE IN THE CANADIAN ARCTIC IN THE MID NINETEENTH CENTURY BASED ON DATA FROM EXPEDITIONS
 PRACE GEOGRAFICZNE, zeszyt 107 Instytut Geografii UJ Kraków 2000 Rajmund Przybylak AIR TEMPERATURE IN THE CANADIAN ARCTIC IN THE MID NINETEENTH CENTURY BASED ON DATA FROM EXPEDITIONS Abstract: The paper
Post Processing Service
 Post Processing Service The delay of propagation of the signal due to the ionosphere is the main source of generation of positioning errors. This problem can be bypassed using a dual-frequency receivers
Bandwidth-dependent transformation of noise data from frequency into time domain and vice versa
 Topic Bandwidth-dependent transformation of noise data from frequency into time domain and vice versa Authors Peter Bormann (formerly GeoForschungsZentrum Potsdam, Telegrafenberg, D-14473 Potsdam, Germany),
Computer Networks and Internets, 5e Chapter 6 Information Sources and Signals. Introduction
 Computer Networks and Internets, 5e Chapter 6 Information Sources and Signals Modified from the lecture slides of Lami Kaya (LKaya@ieee.org) for use CECS 474, Fall 2008. 2009 Pearson Education Inc., Upper
Which month has larger and smaller day time?
 ACTIVITY-1 Which month has larger and smaller day time? Problem: Which month has larger and smaller day time? Aim: Finding out which month has larger and smaller duration of day in the Year 2006. Format
astronomy 2008 1. A planet was viewed from Earth for several hours. The diagrams below represent the appearance of the planet at four different times.
 1. A planet was viewed from Earth for several hours. The diagrams below represent the appearance of the planet at four different times. 5. If the distance between the Earth and the Sun were increased,
Tides and Water Levels
 Tides and Water Levels What are Tides? Tides are one of the most reliable phenomena in the world. As the sun rises in the east and the stars come out at night, we are confident that the ocean waters will
Examination Space Missions and Applications I (AE2103) Faculty of Aerospace Engineering Delft University of Technology SAMPLE EXAM
 Faculty of Aerospace Engineering Delft University of Technology SAMPLE EXAM") Examination Space Missions and Applications I AE2103 Faculty of Aerospace Engineering Delft University of Technology SAMPLE EXAM Please read these instructions first: This are a series of multiple-choice
Examination Space Missions and Applications I AE2103 Faculty of Aerospace Engineering Delft University of Technology SAMPLE EXAM Please read these instructions first: This are a series of multiple-choice
Rotational Errors in IGS Orbit & ERP Products
 Rotational Errors in IGS Orbit & ERP Products Systematic rotations are a leading IGS error they affect all core products except probably clocks Sources include defects in: IERS model for 12h + 24h tidal
Ionosphere Properties and Behaviors - Part 2 By Marcel H. De Canck, ON5AU
 Ionosphere Properties and Behaviors - Part 2 By Marcel H. De Canck, ON5AU I n the previous issue I explained that gyrofrequency depends on the earth s magnetic field and mentioned that this magnetic field
GNSS satellite attitude characteristics during eclipse season
 GNSS satellite attitude characteristics during eclipse season F. Dilssner 1, T. Springer 1, J. Weiss 2, G. Gienger 1, W. Enderle 1 1 ESA/ESOC, Darmstadt, Germany 2 JPL, Pasadena, USA July 26, 2012 IGS
Drought in the Czech Republic in 2015 A preliminary summary
 Drought in the Czech Republic in 2015 A preliminary summary October 2015, Prague DISCLAIMER All data used in this preliminary report are operational and might be a subject of change during quality control.
Development of new hybrid geoid model for Japan, GSIGEO2011. Basara MIYAHARA, Tokuro KODAMA, Yuki KUROISHI
 Development of new hybrid geoid model for Japan, GSIGEO2011 11 Development of new hybrid geoid model for Japan, GSIGEO2011 Basara MIYAHARA, Tokuro KODAMA, Yuki KUROISHI (Published online: 26 December 2014)
Tide - rhythmic oscillation of the ocean surface due to gravitational & centrifugal forces ( inertia ) between the Earth, Moon and Sun.
 between the Earth, Moon and Sun.") Chapter 4: The Changing Level of the Sea Tides Longer Scale Variations Influence on Beaches Tide - rhythmic oscillation of the ocean surface due to gravitational & centrifugal forces ( inertia ) between
Chapter 4: The Changing Level of the Sea Tides Longer Scale Variations Influence on Beaches Tide - rhythmic oscillation of the ocean surface due to gravitational & centrifugal forces ( inertia ) between
ART 269 3D Animation Fundamental Animation Principles and Procedures in Cinema 4D
 ART 269 3D Animation Fundamental Animation Principles and Procedures in Cinema 4D Components Tracks An animation track is a recording of a particular type of animation; for example, rotation. Some tracks
Earth, Moon, and Sun Study Guide. (Test Date: )
") Earth, Moon, and Sun Study Guide Name: (Test Date: ) Essential Question #1: How are the Earth, Moon, and Sun alike and how are they different? 1. List the Earth, Moon, and Sun, in order from LARGEST to
Earth, Moon, and Sun Study Guide Name: (Test Date: ) Essential Question #1: How are the Earth, Moon, and Sun alike and how are they different? 1. List the Earth, Moon, and Sun, in order from LARGEST to
Modelling, Extraction and Description of Intrinsic Cues of High Resolution Satellite Images: Independent Component Analysis based approaches
 Modelling, Extraction and Description of Intrinsic Cues of High Resolution Satellite Images: Independent Component Analysis based approaches PhD Thesis by Payam Birjandi Director: Prof. Mihai Datcu Problematic
Agilent AN 1316 Optimizing Spectrum Analyzer Amplitude Accuracy
 Agilent AN 1316 Optimizing Spectrum Analyzer Amplitude Accuracy Application Note RF & Microwave Spectrum Analyzers Table of Contents 3 3 4 4 5 7 8 8 13 13 14 16 16 Introduction Absolute versus relative
Trends in US foreign policy before 1900
 Trends in US foreign policy before 1900 Instances of the Use of U.S. Armed forces the 19 th and 20th Centuries Scope N.A. C-L.A. AF ME-CA Asia Europe Pac Total 1801-1900 2 7 3 0 4 1 6 23 1901-2000 1 8
The Applanix SmartBase TM Software for Improved Robustness, Accuracy, and Productivity of Mobile Mapping and Positioning
 The Applanix SmartBase TM Software for Improved Robustness, Accuracy, and Productivity of Mobile Mapping and Positioning Joe Hutton and Edith Roy, Applanix Corporation Introduction Applanix, along with
Agilent Television Power Consumption Testing. Application Note
 Agilent Television Power Consumption Testing Application Note Introduction Today, there are many types of televisions (TVs) on the market: the cathode ray tube (CRT) TV, liquid crystal display (LCD) TV,
Bandwidth analysis of multimode fiber passive optical networks (PONs)
") Optica Applicata, Vol. XXXIX, No. 2, 2009 Bandwidth analysis of multimode fiber passive optical networks (PONs) GRZEGORZ STEPNIAK *, LUKASZ MAKSYMIUK, JERZY SIUZDAK Institute of Telecommunications, Warsaw
Optica Applicata, Vol. XXXIX, No. 2, 2009 Bandwidth analysis of multimode fiber passive optical networks (PONs) GRZEGORZ STEPNIAK *, LUKASZ MAKSYMIUK, JERZY SIUZDAK Institute of Telecommunications, Warsaw
Chapter Overview. Seasons. Earth s Seasons. Distribution of Solar Energy. Solar Energy on Earth. CHAPTER 6 Air-Sea Interaction
 Chapter Overview CHAPTER 6 Air-Sea Interaction The atmosphere and the ocean are one independent system. Earth has seasons because of the tilt on its axis. There are three major wind belts in each hemisphere.
TIDES. 1. Tides are the regular rise and fall of sea level that occurs either once a day (every 24.8 hours) or twice a day (every 12.4 hours).
 or twice a day (every 12.4 hours).") TIDES What causes tides? How are tides predicted? 1. Tides are the regular rise and fall of sea level that occurs either once a day (every 24.8 hours) or twice a day (every 12.4 hours). Tides are waves
TIDES What causes tides? How are tides predicted? 1. Tides are the regular rise and fall of sea level that occurs either once a day (every 24.8 hours) or twice a day (every 12.4 hours). Tides are waves
Chapter Overview. Bathymetry. Measuring Bathymetry. Echo Sounding Record. Measuring Bathymetry. CHAPTER 3 Marine Provinces
 Chapter Overview CHAPTER 3 Marine Provinces The study of bathymetry charts ocean depths and ocean floor topography. Echo sounding and satellites are efficient bathymetric tools. Most ocean floor features
GENERAL INFORMATION ON GNSS AUGMENTATION SYSTEMS
 GENERAL INFORMATION ON GNSS AUGMENTATION SYSTEMS 1. INTRODUCTION Navigation technologies with precision approach and landing systems, for civilian and military purposes, enable aircrafts to perform their
A SURVEY OF CLOUD COVER OVER MĂGURELE, ROMANIA, USING CEILOMETER AND SATELLITE DATA
 Romanian Reports in Physics, Vol. 66, No. 3, P. 812 822, 2014 ATMOSPHERE PHYSICS A SURVEY OF CLOUD COVER OVER MĂGURELE, ROMANIA, USING CEILOMETER AND SATELLITE DATA S. STEFAN, I. UNGUREANU, C. GRIGORAS
ENVIRONMENTAL STRUCTURE AND FUNCTION: CLIMATE SYSTEM Vol. II - Low-Latitude Climate Zones and Climate Types - E.I. Khlebnikova
 LOW-LATITUDE CLIMATE ZONES AND CLIMATE TYPES E.I. Khlebnikova Main Geophysical Observatory, St. Petersburg, Russia Keywords: equatorial continental climate, ITCZ, subequatorial continental (equatorial
Earth in the Solar System
 Copyright 2011 Study Island - All rights reserved. Directions: Challenge yourself! Print out the quiz or get a pen/pencil and paper and record your answers to the questions below. Check your answers with
Harmonic oscillations of spiral springs Springs linked in parallel and in series
 .3.26 Related topics Spring constant, Hooke s Law, oscillations, limit of elasticity, parallel springs, serial springs, use of an interface. Principle and task The spring constant D is determined for different
Week 1. Week 2. Week 3
 Week 1 1. What US city has the largest population? 2. Where is Aachen? 3. What is the capitol of Florida? 4. What is the longest mountain range in Spain? 5. What countries border Equador? Week 2 1. What
Global Positioning System
 B. Hofmann-Wellenhof, H. Lichtenegger, and J. Collins Global Positioning System Theory and Practice Third, revised edition Springer-Verlag Wien New York Contents Abbreviations Numerical constants xix xxiii
ESCI 107/109 The Atmosphere Lesson 2 Solar and Terrestrial Radiation
 ESCI 107/109 The Atmosphere Lesson 2 Solar and Terrestrial Radiation Reading: Meteorology Today, Chapters 2 and 3 EARTH-SUN GEOMETRY The Earth has an elliptical orbit around the sun The average Earth-Sun
Thompson/Ocean 420/Winter 2005 Tide Dynamics 1
 Thompson/Ocean 420/Winter 2005 Tide Dynamics 1 Tide Dynamics Dynamic Theory of Tides. In the equilibrium theory of tides, we assumed that the shape of the sea surface was always in equilibrium with the
School of Electrical and Information Engineering. The Remote Laboratory System. Electrical and Information Engineering Project 2006.
 School of Electrical and Information Engineering The Remote Laboratory System Electrical and Information Engineering Project 2006 By Ben Loud Project Number: Supervisors: 2006A Jan Machotka Zorica Nedic
On May 27, 2010, the U.S. Air. Satellite. Antenna Phase Center and Attitude Modeling
 GPS IIF-1 Satellite Antenna Phase Center and Attitude Modeling Florian Dilssner Logica/European Space Agency Calculating the distances between satellites and user equipment is a basic operation for GNSS
Near Real Time Blended Surface Winds
 Near Real Time Blended Surface Winds I. Summary To enhance the spatial and temporal resolutions of surface wind, the remotely sensed retrievals are blended to the operational ECMWF wind analyses over the
DIURNAL CYCLE OF CLOUD SYSTEM MIGRATION OVER SUMATERA ISLAND
 DIURNAL CYCLE OF CLOUD SYSTEM MIGRATION OVER SUMATERA ISLAND NAMIKO SAKURAI 1, FUMIE MURATA 2, MANABU D. YAMANAKA 1,3, SHUICHI MORI 3, JUN-ICHI HAMADA 3, HIROYUKI HASHIGUCHI 4, YUDI IMAN TAUHID 5, TIEN
A Few Facts about Antarctica
 A Few Facts about Antarctica Antarctica is the continent that surrounds the South Pole, the southernmost point at the bottom of the earth. Antarctica is a continent because it is land that is covered by
Physics 9e/Cutnell. correlated to the. College Board AP Physics 1 Course Objectives
 Physics 9e/Cutnell correlated to the College Board AP Physics 1 Course Objectives Big Idea 1: Objects and systems have properties such as mass and charge. Systems may have internal structure. Enduring
Simpler Options. Indicator guide. An informative reference for John Carter s commonly used trading indicators. www.simpleroptions.
 Simpler Options Indicator guide An informative reference for John Carter s commonly used trading indicators At Simpler Options you will see a handful of proprietary indicators on John Carter s charts.
Soil Dynamics Prof. Deepankar Choudhury Department of Civil Engineering Indian Institute of Technology, Bombay
 Soil Dynamics Prof. Deepankar Choudhury Department of Civil Engineering Indian Institute of Technology, Bombay Module - 2 Vibration Theory Lecture - 8 Forced Vibrations, Dynamic Magnification Factor Let
Start Up. On the right screen, click on the following icon in order to launch the program for EDS analysis.
 Start Up On the right screen, click on the following icon in order to launch the program for EDS analysis. You must start up SEM application before starting EDS application. Don t forget to switch off
Use the following information to deduce that the gravitational field strength at the surface of the Earth is approximately 10 N kg 1.
 IB PHYSICS: Gravitational Forces Review 1. This question is about gravitation and ocean tides. (b) State Newton s law of universal gravitation. Use the following information to deduce that the gravitational
Monsoon Variability and Extreme Weather Events
 Monsoon Variability and Extreme Weather Events M Rajeevan National Climate Centre India Meteorological Department Pune 411 005 rajeevan@imdpune.gov.in Outline of the presentation Monsoon rainfall Variability
Encoders for Linear Motors in the Electronics Industry
 Technical Information Encoders for Linear Motors in the Electronics Industry The semiconductor industry and automation technology increasingly require more precise and faster machines in order to satisfy
ENSO Cycle: Recent Evolution, Current Status and Predictions. Update prepared by Climate Prediction Center / NCEP 9 May 2011
 ENSO Cycle: Recent Evolution, Current Status and Predictions Update prepared by Climate Prediction Center / NCEP 9 May 2011 Outline Overview Recent Evolution and Current Conditions Oceanic Niño Index (ONI)
Newton s Law of Gravity
 Gravitational Potential Energy On Earth, depends on: object s mass (m) strength of gravity (g) distance object could potentially fall Gravitational Potential Energy In space, an object or gas cloud has
South Africa. General Climate. UNDP Climate Change Country Profiles. A. Karmalkar 1, C. McSweeney 1, M. New 1,2 and G. Lizcano 1
 UNDP Climate Change Country Profiles South Africa A. Karmalkar 1, C. McSweeney 1, M. New 1,2 and G. Lizcano 1 1. School of Geography and Environment, University of Oxford. 2. Tyndall Centre for Climate
GEOPHYSICAL EFFECTS ON SITE DISPLACEMENTS FOR PERMANENT GPS TRACKING STATIONS IN TAIWAN
 GEOPHYSICAL EFFECTS ON SITE DISPLACEMENTS FOR PERMANENT GPS TRACKING STATIONS IN TAIWAN C. C. Chang Department of Surveying and Mapping Engineering Chung Cheng Institute of Technology Tahsi, Taoyuan 335,
Infrared Spectroscopy: Theory
 u Chapter 15 Infrared Spectroscopy: Theory An important tool of the organic chemist is Infrared Spectroscopy, or IR. IR spectra are acquired on a special instrument, called an IR spectrometer. IR is used
Data Sets of Climate Science
 The 5 Most Important Data Sets of Climate Science Photo: S. Rahmstorf This presentation was prepared on the occasion of the Arctic Expedition for Climate Action, July 2008. Author: Stefan Rahmstorf, Professor
MEASURES OF VARIATION
 NORMAL DISTRIBTIONS MEASURES OF VARIATION In statistics, it is important to measure the spread of data. A simple way to measure spread is to find the range. But statisticians want to know if the data are
Analysis of RTN Measurement Results Referring to ASG-EUPOS Network
 GEOMATICS AND ENVIRONMENTAL ENGINEERING Volume 4 Number 1/1 2010 Andrzej Uznañski* Analysis of RTN Measurement Results Referring to ASG-EUPOS Network 1. Introduction In June 2008 ASG-EUPOS network system,
The Four Seasons. A Warm Up Exercise. A Warm Up Exercise. A Warm Up Exercise. The Moon s Phases
 The Four Seasons A Warm Up Exercise What fraction of the Moon s surface is illuminated by the Sun (except during a lunar eclipse)? a) Between zero and one-half b) The whole surface c) Always half d) Depends
VOLATILITY AND DEVIATION OF DISTRIBUTED SOLAR
 VOLATILITY AND DEVIATION OF DISTRIBUTED SOLAR Andrew Goldstein Yale University 68 High Street New Haven, CT 06511 andrew.goldstein@yale.edu Alexander Thornton Shawn Kerrigan Locus Energy 657 Mission St.
How To Find Natural Oil Seepage In The Dreki Area Using An Envisat Image
 rn ORKUSTOFNUN National Energy Authority Searching for natural oil seepage in the Dreki area using ENVISAT radar images. Ingibjorg J6nsd6ttir and Arni Freyr Valdimarsson, Faculty of Earth Sciences School
5-Axis Test-Piece Influence of Machining Position
 5-Axis Test-Piece Influence of Machining Position Michael Gebhardt, Wolfgang Knapp, Konrad Wegener Institute of Machine Tools and Manufacturing (IWF), Swiss Federal Institute of Technology (ETH), Zurich,
International Year of Light 2015 Tech-Talks BREGENZ: Mehmet Arik Well-Being in Office Applications Light Measurement & Quality Parameters
 www.led-professional.com ISSN 1993-890X Trends & Technologies for Future Lighting Solutions ReviewJan/Feb 2015 Issue LpR 47 International Year of Light 2015 Tech-Talks BREGENZ: Mehmet Arik Well-Being in
Chapter 3 Earth - Sun Relations
 3.1 Introduction We saw in the last chapter that the short wave radiation from the sun passes through the atmosphere and heats the earth, which in turn radiates energy in the infrared portion of the electromagnetic
2. Contest Period 1200 UTC 21 March - 1159 UTC 22 March 2015. 3. Categories:
 RUSSIAN DX CONTEST - 2015 1. Contest sponsors The "Soyuz Radioljubitelej Rossii" (Union of Radioamateurs of Russia), SRR is pleased to announce 22 International "Russian DX Contest" 2. Contest Period 1200
MECH 450F/580 COURSE OUTLINE INTRODUCTION TO OCEAN ENGINEERING
 Department of Mechanical Engineering MECH 450F/580 COURSE OUTLINE INTRODUCTION TO OCEAN ENGINEERING Spring 2014 Course Web Site See the MECH 450F Moodle site on the UVic Moodle system. Course Numbers:
VCO Phase noise. Characterizing Phase Noise
 VCO Phase noise Characterizing Phase Noise The term phase noise is widely used for describing short term random frequency fluctuations of a signal. Frequency stability is a measure of the degree to which
Active Vibration Isolation of an Unbalanced Machine Spindle
 UCRL-CONF-206108 Active Vibration Isolation of an Unbalanced Machine Spindle D. J. Hopkins, P. Geraghty August 18, 2004 American Society of Precision Engineering Annual Conference Orlando, FL, United States
5 Transforming Time Series
 5 Transforming Time Series In many situations, it is desirable or necessary to transform a time series data set before using the sophisticated methods we study in this course: 1. Almost all methods assume
Motions of Earth, Moon, and Sun
 Motions of Earth, Moon, and Sun Apparent Motions of Celestial Objects An apparent motion is a motion that an object appears to make. Apparent motions can be real or illusions. When you see a person spinning
WAVELET ANALYSES OF SOME ATMOSPHERIC PARAMETERS AT BLACK SEA REGION Zafer ASLAN, Zehra Nevin ÇAĞLAR and D.Nail YENİÇERİ
 INTERNATIONAL JOURNAL OF ELECTRONICS; MECHANICAL and MECHATRONICS ENGINEERING Vol.3 Num.1 pp.(419-426) WAVELET ANALYSES OF SOME ATMOSPHERIC PARAMETERS AT BLACK SEA REGION Zafer, ASLAN 1 ; Zehra Nevin,
IN-FLIGHT CALIBRATION OF THE MICROSCOPE SPACE MISSION INSTRUMENT: DEVELOPMENT OF THE SIMULATOR
 SF2A 2011 G. Alecian, K. Belkacem, R. Samadi and D. Valls-Gabaud (eds) IN-FLIGHT CALIBRATION OF THE MICROSCOPE SPACE MISSION INSTRUMENT: DEVELOPMENT OF THE SIMULATOR E. Hardy 1, A. Levy 1, G. Métris 2,
GEOGRAPHIC INFORMATION SYSTEMS Lecture 21: The Global Positioning System
 GEOGRAPHIC INFORMATION SYSTEMS Lecture 21: The Global Positioning System The Global Positioning System - recognize that GPS is only one of several Global Navigation Satellite Systems (GNSS) - the Russian
Chapter 2: Solar Radiation and Seasons
 Chapter 2: Solar Radiation and Seasons Spectrum of Radiation Intensity and Peak Wavelength of Radiation Solar (shortwave) Radiation Terrestrial (longwave) Radiations How to Change Air Temperature? Add
Twelve. Figure 12.1: 3D Curved MPR Viewer Window
 Twelve The 3D Curved MPR Viewer This Chapter describes how to visualize and reformat a 3D dataset in a Curved MPR plane: Curved Planar Reformation (CPR). The 3D Curved MPR Viewer is a window opened from
Evolving a new Geodetic Positioning Framework: An Australian Perspective
 Evolving a new Geodetic Positioning Framework: An Australian Perspective G. Johnston, J. Dawson Outline Introduction Precise Positioning National Geospatial Reference Systems Asia Pacific Reference Frame