CHAPTER 7 EFFECTIVE DECISION SUPPORT FOR NURSE SCHEDULING
|
|
|
- George Freeman
- 8 years ago
- Views:
Transcription
1 CHAPTER EFFECTIVE DECISION SUPPORT FOR NURSE SCHEDULING The third chapter described three hypotheses. Two of these hypotheses the hypothesis of formalization and the hypothesis of robustness have been confirmed. This chapter describes the scheduling experiment, an experiment which was designed to test the third and last hypothesis: the hypothesis of effectiveness. This hypothesis states that the task of nurse scheduling can be effectively supported by means of quality indication. In the scheduling experiment, nurse schedulers were asked to arrange a nursing schedule for a fictitious nursing unit. This experiment investigates the effect of supporting the nurse schedule with information about the factor values on the quality of the arranged nursing schedules. The following sections discuss the design, results and conclusions of this scheduling experiment.. DESIGN OF THE SCHEDULING EXPERIMENT The objective of the scheduling experiment is to test the hypothesis of effectiveness. This hypothesis states that quality indication can be effectively used to support the task of nurse scheduling. To attain this objective, the scheduling experiment was based on a pre-test post-test design. In this design, the pre-test condition concerns the old situation, while the post-test measures the new situation. Both situations are separate steps in the scheduling experiment. Below, the first subsection describes these steps. The second subsection discusses the variables used in this experiment. And the third subsection describes additional characteristics of the East- nursing unit, essential for the scheduling experiment.

2 8 Chapter.. Steps of the scheduling experiment In the second step of the scheduling experiment, a number of nurse schedulers were given an initial four-week schedule for the fictitious nursing unit of East-. This initial schedule resulted from the initialization. In the scheduling experiment, this initialization has already been completed. In the second step of the scheduling experiment, the nurse schedulers were asked to arrange a high-quality nursing schedule for this nursing unit on the basis of this initial schedule with the assistance of a nurse scheduling support system (i.e. the ZKR system; see also Appendix C). This step is called traditional scheduling, and the results of this step are called the original final schedule. Normally, nurse scheduling only involves the two steps mentioned above. In the scheduling experiment, a third step is added. In this third step, each nurse scheduler was informed about the factor values of the arranged nursing schedule as computed by an additional software module which computes the values of the quality indicators according to the formulas described in the fifth chapter. Then, the nurse schedulers decided if and how they would use this information to rearrange the original final schedule into a new final schedule. Figure. shows these three steps of the scheduling experiment and the resulting status of the schedule... Variables of the scheduling experiment The objective of the scheduling experiment is to determine the effectiveness of quality indication scheduling, the third step discussed above. This effectiveness concerns the quality of the new final schedules compared to the quality of the original final schedules. Therefore, the nursing schedule quality is the dependent variable. This variable will be estimated as a non-weighted sum of the factor values. This estimation does not need the determination of the individual summation weights, which requires an analysis like the one discussed in the previous chapter. An average (i.e. non-weighted) sum of the factor values will provide a valid estimation of the required average value of nursing schedule quality. Receiving additional quality indication is the independent variable. In the second step of the scheduling experiment, the nurse schedulers did not receive quality indication, whereas they did receive this quality indication in the third step of the scheduling experiment.

3 Effective decision support for nurse scheduling 9 Figure. STEPS OF THE SCHEDULING EXPERIMENT initialization initial schedule traditional scheduling original final schedule quality indication scheduling new final schedule The difference in nursing schedule quality between the original final schedule (Q o ) n and the new final schedule (Q ) will determine the effectiveness of quality n o indication. The null hypothesis is that this difference will be zero (H : Q - Q = ), while the alternative hypothesis is that this difference will be greater than zero n o (H : Q - Q > ).

4 Chapter.. Characteristics of the East- nursing unit The nursing staff of the East- nursing unit consists of nine registered nurses and fourteen nursing assistants. Some of these twenty-three nurses work full-time. In this study, this means that these nurses have a so-called full-time equivalent of.8 or higher. The remaining nurses work part-time, which means that they have a fulltime equivalent below.8. Table. shows this division into registered nurses and nursing assistants per full-time equivalent (fte). Table. CHARACTERISTICS OF THE EAST- NURSING STAFF full-time equivalent total fte registered nurses 9. nursing assistants. total. The required total of full-time equivalents of a nursing staff can be computed according to a standard calculation (Excuro, 99). In this calculation, normal days off, festive days, short-time days, special leaves and educational days are subtracted from the total number of days in a year. Furthermore, this calculation is based on an average illness ratio of five percent. Finally, the holidays are subtracted from this subtotal. Table. shows this calculation for a nurse with a fulltime equivalent of.. This nurse has an average of working days a year. This equals a yield of / per fte. As table. shows, the East- nursing unit has a total of. fte. This means that the East- nursing unit can provide. shifts per schedule period of four weeks. And, as described in the last chapter, the East- nursing unit requires the assignment of shifts per schedule period of four weeks. Therefore, the East- nursing unit has just the size to meet its quantitative staffing demands.. fte / yield/fte 8 days =. shifts

5 Effective decision support for nurse scheduling Table. AVERAGE NUMBER OF ANNUAL WORKING DAYS total total number of days within a year minus number of normal days off minus number of festive days minus number of short-time days minus average number of special leave days a year minus average number of educational days a year minus average number of sick-leave days a year (% of the above) minus number of holidays a year average number of working days a year.. Characteristics of the initial schedule The quantitative staffing demands of the East- nursing unit, as described in the previous chapter, require that a total of shifts are scheduled in a four-week schedule period. This total consists of night shifts, 8 evening shifts and day shifts. The total of full-time equivalents of the East- nursing staff determines the maximum number of shifts that can be scheduled at. This maximum is computed by multiplying the total number of full-time equivalents by five shifts a week during four weeks. In the initial schedule used in the scheduling experiment, five nurses had a week of holidays in the four-week schedule period. Furthermore, on eight occasions a nurse was not available for a day on. These holidays and not available days could not be exchanged for a day on (i.e. a day, evening or night shift). This means that there were shifts available, while there were shifts required. This provides some flexibility in arranging the required nursing schedules, which ensures that this experiment would not be too time-consuming to perform.

6 Chapter Figure.
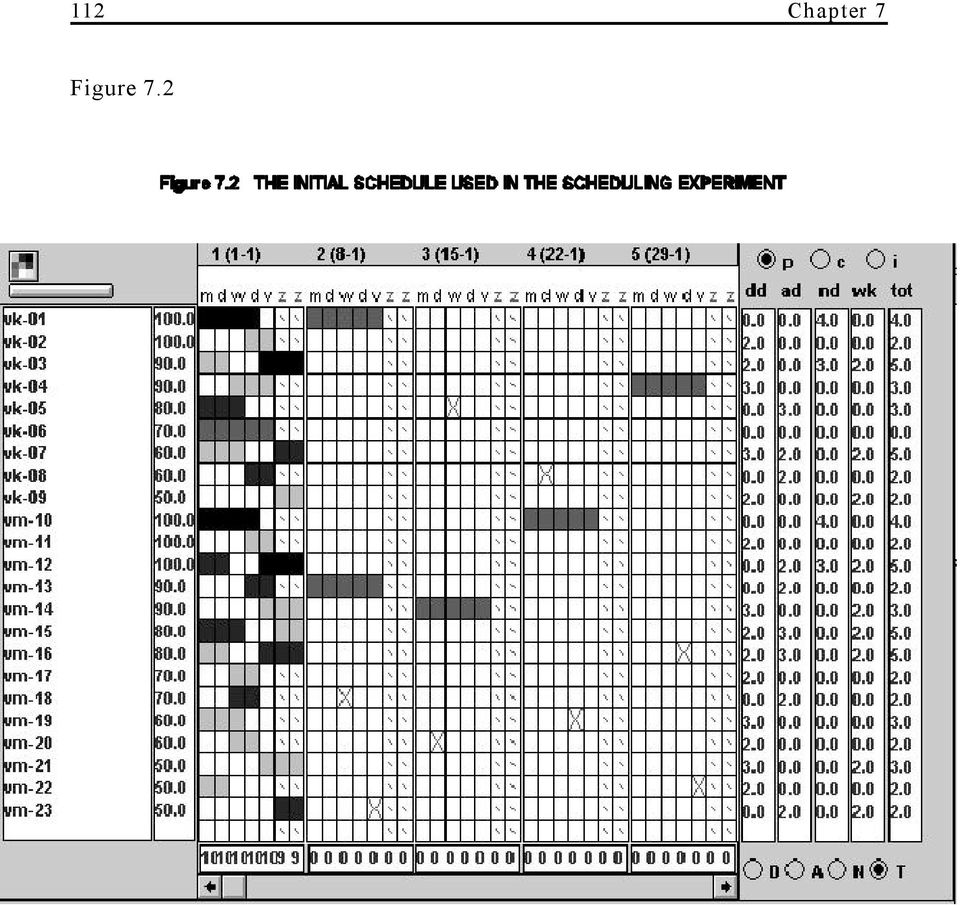
7 Effective decision support for nurse scheduling Figure. shows the initial schedule (as represented by the user interface of the ZKR scheduling support system; see also Appendix C). This initial schedule covers the weeks numbered as,, and. Week number one is the last week of the previous schedule. In this initial schedule, five blocks of five consecutive holidays are represented by dotted rectangles, and the eight crosses represent the not available days. The nursing staff is represented vertically.. RESULTS OF THE SCHEDULING EXPERIMENT In total, eight nurse schedulers agreed to participate in the scheduling experiment. This experiment consisted of two parts. In the first part, each of these eight nurse schedulers arranged a nursing schedule. This resulted in eight original final schedules. In the second part, the nurse schedulers received quality indication. This information could be used to rearrange these original final schedules into new final schedules. The section below discusses the resulting factor values of both the original final schedules and the new final schedules... Values of the original final schedules In the first part of the scheduling experiment, each of these eight nurse schedulers arranged a nursing schedule in the traditional situation. Table. shows the factor values of the resulting original final schedules. The five quality factors, completeness, optimality, proportionality, healthiness and continuity, are represented as C, O, P, H and T, respectively. As described in the previous chapter, the auditing experiment showed an average summation weight of approximately two. Therefore, summation weights of two were used for all quality factors to compute an estimation of the total quality value of a nursing schedule. Table. also shows these estimated total quality o values of the original final schedules, represented as Q. Furthermore, table. shows the mean values (m) and the standard deviations (F) for each quality factor and for the estimation of the total quality value. The mean estimated total quality value for these original nursing schedules was nearly five on a scale from one to ten. These values range from. to.. The arranged original final schedules show that the nurse schedulers differed consider-

8 Chapter ably in the values per quality factor. However, most nurse schedulers scored high on completeness. The scores on continuity and proportionality are mostly second or third in rank. And for half of the arranged original nursing schedules, the scores on optimality are low (i.e. below.). The most remarkable result is the fact that all arranged final schedules scored low on healthiness (i.e.. or lower). Table. FACTOR VALUES OF THE ORIGINAL FINAL SCHEDULES C O P H T Q mean F The eight nurse schedulers differed significantly in the amount of time needed to arrange these original final schedules. The fastest nurse scheduler completed the schedule in slightly more than one hour, whereas the slowest nurse scheduler needed almost two hours to arrange the original final schedule. For this traditional situation, table. shows the total scheduling time expressed in minutes. This table also shows the mean total scheduling time and its standard deviation, which is represented between rounds. The computation of the values of each of the quality factors, as described in the previous chapter, is based on the occurrences of a number of low-quality schedule patterns. In total, twenty-one different low-quality schedule patterns are identified. In order to enable a more detailed analysis of the arranged original final schedules, the tables.a and.b show the numbers of occurrences for each of these patterns per arranged nursing schedule. This table also shows the totals per

9 Effective decision support for nurse scheduling low-quality schedule pattern and the totals per nurse scheduler. Low-quality schedule patterns with most occurrences are day over-qualification (O) and evening shift followed by day shift (H). These results also show that none of the nurse schedulers scheduled more night shifts than required (O), and just onces, too many consecutive evening shifts (H) were scheduled. Also only one nurse scheduler scheduled (twice) a single day on (H). Table. TOTAL SCHEDULING TIME IN MINUTES IN THE TRADITIONAL SITUATION scheduler 8 mean F time The eight nurse schedulers differed strongly concerning the number of low-quality schedule patterns that occurred in the original final schedules. These numbers ranged from about twenty to just over hundred. Table. shows the summarized number of low-quality schedule patterns per quality factor. The results of this summarization show that the total number of scheduled low-healthiness schedule patterns was nearly as high as the total of the remaining low-quality schedule patterns. On average, the arranged original final schedules score worst on healthiness and best on completeness. Figure. shows one of the arranged original final schedules. The black rectangles represent night shifts. The day shifts are represented by the lightlydotted rectangles. And the remaining, grey-dotted rectangles represented evening shifts. The scheduled holidays and days off were removed for ease of survey. The original final schedule shown in figure. has the highest total quality value compared with the other original final schedules. However, this schedule has a low value on healthiness. This can be illustrated by the seven occurrences of an evening shift followed by a day shift, which strongly decreases the healthiness of this schedule.
 a single day on (H). Table.")
10 Chapter Table.a NUMBERS OF OCCURRENCES OF LOW-QUALITY SCHEDULE PATTERNS IN ORIGINAL FINAL SCHEDULES schedules 8 total completeness: day incompleteness evening incompleteness night incompleteness optimality: day under-qualification evening under-qualification night under-qualification day over-qualification 9 evening over-qualification 8 night over-qualification proportionality: single day off double weekend on triple weekend on

11 Effective decision support for nurse scheduling Table.b NUMBERS OF OCCURRENCES OF LOW-QUALITY SCHEDULE PATTERNS IN ORIGINAL FINAL SCHEDULES schedules 8 total healthiness: too many consecutive days on too many consecutive day shifts too many consecutive evening shifts too many consecutive night shifts too few days off after night shifts single day on evening shift followed by day shift continuity: semi-discontinuity full-discontinuity total (table.a + table.b) 8 8 9

12 8 Chapter

13 Effective decision support for nurse scheduling 9 Table. SUMMARIZED NUMBER OF LOW-QUALITY SCHEDULE PATTERNS PER QUALITY FACTOR IN ORIGINAL FINAL SCHEDULES schedules 8 total C 8 O 8 P 9 9 H 9 T 8.. Values of the new final schedules In the following stage of the scheduling experiment, each nurse scheduler was informed about the values of the five quality factors of the arranged nursing schedule. On the basis of the quality indication, each of the eight nurse schedulers rearranged the original final schedule into a new final schedule. Table. shows the factor values and estimations of the total quality values of these new final schedules. Table. also shows the differences in the estimation of the total quality value per nurse schedule between the original final schedule and the new final schedule ()). Furthermore, this difference is also represented as the relative individual gain score (%). The results of a one-sided t-test for paired samples showed that the mean o estimated total quality value for the original final schedules (Q ) was lower (t- n value=.8, df=, p<.) than this mean for the new final schedules (Q ). This means that quality indication scheduling significantly increased the quality of the final schedules. These results reject the null hypothesis, which stated that this n o difference would be zero (i.e. H : Q - Q = ), and confirm the alternative hypothesis, which stated that this difference would be greater than zero (i.e. H : n o Q -Q > ). These findings clearly support the effectiveness of the quality indication scheduling approach. However, it could be argued that the significant results of the scheduling experiment are (partially) caused by the large number of available shifts in the

14 Chapter initial schedule compared with the number of required shifts. To deal with this criticism, one nurse scheduler arranged a nursing schedule on the basis of a less flexible initial schedule. Also in this case, quality indication scheduling could be used to increase the estimated total nursing schedule quality. Appendix C shows these results. Table. FACTOR VALUES OF THE NEW FINAL SCHEDULES C O P H T Q ) % mean F The rearranging of the original final schedules into the new final schedules took most nurse schedulers about twenty minutes. Table.8 shows the total scheduling time in the new situation. Table.9 shows the numbers of occurrences for each of the low-quality schedule patterns per rearranged nursing schedule. In this new situation, the number of occurrences of most low-quality schedule patterns shows a large decrease compared to the original situation. The low-healthiness schedule pattern of an evening shift followed by a day shift (H) shows the largest decrease in number of occurrences. Also in the new situation, the low-quality schedule pattern of day over-qualification (O) still has the most occurrences. Furthermore, the number of occurrences of two low-quality schedule patterns (O and H) increased by one or two as a result of the re-arrangement. In total, the number of occurrences of the low-quality schedule pattern

15 Effective decision support for nurse scheduling decreased from to, which is a decrease of forty-five percent. This means that, on average, a nurse scheduler was able to reduce the number of low-quality schedule patterns to almost half the original number on the basis of the information on quality factor values. Table.8 TOTAL SCHEDULING TIME IN MINUTES IN THE NEW SITUATION scheduler 8 mean F time Table. shows the summarized number of low-quality schedule patterns per quality factor for the new final schedules. The summarizations show a very large decrease in low-healthiness schedule patterns. Apparently, the application of quality indication scheduling enables nurse schedulers to increase the healthiness of nursing schedules. Another demonstrated advantage of quality indication scheduling is the resulting absence of incompleteness. Figure. shows one of the new final schedules. This new final schedule only contains six low-quality schedule patterns, while the original final schedule contains twenty-three of these patterns. The new final schedule shown in figure. has the highest total quality value compared with the other new final schedules. This schedule has acceptable values on all quality indicators, including healthiness. This can be illustrated by the fact that all seven occurrences of an evening shift followed by a day shift in the original final schedule (see figure.) are successfully removed in this new final schedule... Randomized pre-test post-test control group design As described in the previous subsection, the results of the scheduling experiment showed that the approach of quality indication scheduling is effective. However, this conclusion could be criticized for the lack of a control group (Neale & Liebert, 98, pp. -). Therefore, the data presented above were reanalyzed in such

16 Chapter a way that the scheduling experiment fulfilled this requirement of a control group. This was done by using (ad hoc) a randomized pre-test post-test control Table.9a NUMBERS OF OCCURRENCES OF LOW-QUALITY SCHEDULE PATTERNS IN NEW FINAL SCHEDULES schedules 8 total % completeness: day incompleteness evening incompleteness night incompleteness - - optimality: day under-qualification + + evening under-qualification night under-qualification - - day over-qualification evening over-qualification - - night over-qualification proportionality: single day off - - double weekend on triple weekend on - -

17 Effective decision support for nurse scheduling Table.9b NUMBERS OF OCCURRENCES OF LOW-QUALITY SCHEDULE PATTERNS IN NEW FINAL SCHEDULES schedules 8 total % healthiness: too many consecutive days on too many consecutive day shifts too many consecutive evening shifts too many consecutive night shifts too few days off after night shifts single day on evening shift followed by day shift continuity: semi-discontinuity full-discontinuity total %

18 Chapter n

19 Effective decision support for nurse scheduling Table. SUMMARIZED NUMBER OF LOW-QUALITY SCHEDULE PATTERNS PER QUALITY FACTOR IN NEW FINAL SCHEDULES quality factor schedules 8 total ) % C O P - - H T - - Table. RESULTS OF THE FIRST PRE-TEST POST-TEST CONTROL GROUP DESIGN mean value of Q mean scheduling time C E C E mean F mean F mean F mean F original situation new situation C E = = control group experimental group group design (Neale & Liebert, 98, pp. -9). This design was applied twice. In the first pre-test post-test control group design, all schedulers with an even number were assigned to the control group (C), while all schedulers with an odd number were assigned to the experimental group (E). In this design, only the experimental group received quality indication in the post-test condition. In the pre-test condition, neither group received quality indication. And for the control group, the post-test condition and the pre-test condition were identical. Table. shows the results of this first pre-test post-test control group design.
. This design was applied twice.")
20 Chapter The results of a one-sided t-test for paired samples showed that, in the new situation, the mean estimated total quality value for the experimental group significantly exceeds this mean for control group (t-value=.8, df=, p=.). The amount of time required in the new situation did not differ significantly (t-value=.9, df=, p=.99). In the second pre-test post-test control group design, the situation was reversed. Now, all schedulers with an odd number were assigned to the control group (C), while all schedulers with an even number were assigned to the experimental group (E). Table. shows the results of this second pre-test post-test control group design. Table. RESULTS OF THE SECOND PRE-TEST POST-TEST CONTROL GROUP DESIGN mean value of Q mean scheduling time C E C E mean F mean F mean F mean F original situation new situation C E = = control group experimental group Again, the results of a one-side t-test for paired samples showed that, in the new situation, the mean estimated total quality value for the experimental group exceeds this mean for control group (t-value=., df=, p=.). The amount of time required in the new situation did not differ significantly (t-value=.8, df=, p=.). The reanalysis of the results of the scheduling experiment emulating a randomized pre-test post-test control group design also showed an improvement of nursing schedule quality caused by the use of quality indication. This improvement is significant when an error tolerance of five percent is used. The results of this reanalysis show the validity of the results of the scheduling experiment, and it refutes criticism based on the lack of a control group.
, while all schedulers with an even number were assigned to the experimental group (E). Table.")
21 Effective decision support for nurse scheduling. CONCLUSIONS OF THE SCHEDULING EXPERIMENT The objective of the scheduling experiment is to test the hypothesis of effectiveness. This hypothesis states that the task of nurse scheduling can be effectively supported by means of quality indication. The results of the scheduling experiment showed a significantly higher quality value for nursing schedules arranged on the basis of quality indication, compared to nursing schedules arranged without this additional information. To be more specific, all nurse schedulers involved in this experiment used the quality indication, which resulted in an improvement of nursing schedule quality value of about thirty percent and an average decrease of low-quality schedule patterns of forty-five percent. Therefore, the results of the scheduling experiment clearly support the hypothesis of effectiveness. This provides a positive answer to the fourth and last research question described in the third chapter: Does quality indication improve the quality of nursing schedules?.
Calculating P-Values. Parkland College. Isela Guerra Parkland College. Recommended Citation
 Parkland College A with Honors Projects Honors Program 2014 Calculating P-Values Isela Guerra Parkland College Recommended Citation Guerra, Isela, "Calculating P-Values" (2014). A with Honors Projects.
Chi Square Tests. Chapter 10. 10.1 Introduction
 Contents 10 Chi Square Tests 703 10.1 Introduction............................ 703 10.2 The Chi Square Distribution.................. 704 10.3 Goodness of Fit Test....................... 709 10.4 Chi Square
Descriptive Statistics
 Descriptive Statistics Primer Descriptive statistics Central tendency Variation Relative position Relationships Calculating descriptive statistics Descriptive Statistics Purpose to describe or summarize
Non-Inferiority Tests for One Mean
 Chapter 45 Non-Inferiority ests for One Mean Introduction his module computes power and sample size for non-inferiority tests in one-sample designs in which the outcome is distributed as a normal random
Progress Report Phase I Study of North Carolina Evidence-based Transition to Practice Initiative Project Foundation for Nursing Excellence
 Progress Report Phase I Study of North Carolina Evidence-based Transition to Practice Initiative Project Foundation for Nursing Excellence Prepared by the NCSBN Research Department INTRODUCTION In 2006,
Simple Random Sampling
 Source: Frerichs, R.R. Rapid Surveys (unpublished), 2008. NOT FOR COMMERCIAL DISTRIBUTION 3 Simple Random Sampling 3.1 INTRODUCTION Everyone mentions simple random sampling, but few use this method for
One-Way Analysis of Variance
 One-Way Analysis of Variance Note: Much of the math here is tedious but straightforward. We ll skim over it in class but you should be sure to ask questions if you don t understand it. I. Overview A. We
APPLICATIONS AND MODELING WITH QUADRATIC EQUATIONS
 APPLICATIONS AND MODELING WITH QUADRATIC EQUATIONS Now that we are starting to feel comfortable with the factoring process, the question becomes what do we use factoring to do? There are a variety of classic
Math Review. for the Quantitative Reasoning Measure of the GRE revised General Test
 Math Review for the Quantitative Reasoning Measure of the GRE revised General Test www.ets.org Overview This Math Review will familiarize you with the mathematical skills and concepts that are important
Statistics Review PSY379
 Statistics Review PSY379 Basic concepts Measurement scales Populations vs. samples Continuous vs. discrete variable Independent vs. dependent variable Descriptive vs. inferential stats Common analyses
Non-Inferiority Tests for Two Means using Differences
 Chapter 450 on-inferiority Tests for Two Means using Differences Introduction This procedure computes power and sample size for non-inferiority tests in two-sample designs in which the outcome is a continuous
Accuplacer Arithmetic Study Guide
 Accuplacer Arithmetic Study Guide Section One: Terms Numerator: The number on top of a fraction which tells how many parts you have. Denominator: The number on the bottom of a fraction which tells how
EXCEL Analysis TookPak [Statistical Analysis] 1. First of all, check to make sure that the Analysis ToolPak is installed. Here is how you do it:
![EXCEL Analysis TookPak [Statistical Analysis] 1. First of all, check to make sure that the Analysis ToolPak is installed. Here is how you do it:](/thumbs/30/14272010.jpg "EXCEL Analysis TookPak [Statistical Analysis] 1. First of all, check to make sure that the Analysis ToolPak is installed. Here is how you do it:") EXCEL Analysis TookPak [Statistical Analysis] 1 First of all, check to make sure that the Analysis ToolPak is installed. Here is how you do it: a. From the Tools menu, choose Add-Ins b. Make sure Analysis
EXCEL Analysis TookPak [Statistical Analysis] 1 First of all, check to make sure that the Analysis ToolPak is installed. Here is how you do it: a. From the Tools menu, choose Add-Ins b. Make sure Analysis
Chapter 7. One-way ANOVA
 Chapter 7 One-way ANOVA One-way ANOVA examines equality of population means for a quantitative outcome and a single categorical explanatory variable with any number of levels. The t-test of Chapter 6 looks
SCHOOL OF HEALTH AND HUMAN SCIENCES DON T FORGET TO RECODE YOUR MISSING VALUES
 SCHOOL OF HEALTH AND HUMAN SCIENCES Using SPSS Topics addressed today: 1. Differences between groups 2. Graphing Use the s4data.sav file for the first part of this session. DON T FORGET TO RECODE YOUR
Lesson 1: Comparison of Population Means Part c: Comparison of Two- Means
 Lesson : Comparison of Population Means Part c: Comparison of Two- Means Welcome to lesson c. This third lesson of lesson will discuss hypothesis testing for two independent means. Steps in Hypothesis
Using Excel for inferential statistics
 FACT SHEET Using Excel for inferential statistics Introduction When you collect data, you expect a certain amount of variation, just caused by chance. A wide variety of statistical tests can be applied
Unit 31 A Hypothesis Test about Correlation and Slope in a Simple Linear Regression
 Unit 31 A Hypothesis Test about Correlation and Slope in a Simple Linear Regression Objectives: To perform a hypothesis test concerning the slope of a least squares line To recognize that testing for a
BA 275 Review Problems - Week 6 (10/30/06-11/3/06) CD Lessons: 53, 54, 55, 56 Textbook: pp. 394-398, 404-408, 410-420
 CD Lessons: 53, 54, 55, 56 Textbook: pp. 394-398, 404-408, 410-420") BA 275 Review Problems - Week 6 (10/30/06-11/3/06) CD Lessons: 53, 54, 55, 56 Textbook: pp. 394-398, 404-408, 410-420 1. Which of the following will increase the value of the power in a statistical test
BA 275 Review Problems - Week 6 (10/30/06-11/3/06) CD Lessons: 53, 54, 55, 56 Textbook: pp. 394-398, 404-408, 410-420 1. Which of the following will increase the value of the power in a statistical test
Introduction to. Hypothesis Testing CHAPTER LEARNING OBJECTIVES. 1 Identify the four steps of hypothesis testing.
 Introduction to Hypothesis Testing CHAPTER 8 LEARNING OBJECTIVES After reading this chapter, you should be able to: 1 Identify the four steps of hypothesis testing. 2 Define null hypothesis, alternative
Chapter 3 RANDOM VARIATE GENERATION
 Chapter 3 RANDOM VARIATE GENERATION In order to do a Monte Carlo simulation either by hand or by computer, techniques must be developed for generating values of random variables having known distributions.
Friedman's Two-way Analysis of Variance by Ranks -- Analysis of k-within-group Data with a Quantitative Response Variable
 Friedman's Two-way Analysis of Variance by Ranks -- Analysis of k-within-group Data with a Quantitative Response Variable Application: This statistic has two applications that can appear very different,
UNDERSTANDING THE TWO-WAY ANOVA
 UNDERSTANDING THE e have seen how the one-way ANOVA can be used to compare two or more sample means in studies involving a single independent variable. This can be extended to two independent variables
Part 3. Comparing Groups. Chapter 7 Comparing Paired Groups 189. Chapter 8 Comparing Two Independent Groups 217
 Part 3 Comparing Groups Chapter 7 Comparing Paired Groups 189 Chapter 8 Comparing Two Independent Groups 217 Chapter 9 Comparing More Than Two Groups 257 188 Elementary Statistics Using SAS Chapter 7 Comparing
Unit 26 Estimation with Confidence Intervals
 Unit 26 Estimation with Confidence Intervals Objectives: To see how confidence intervals are used to estimate a population proportion, a population mean, a difference in population proportions, or a difference
Recall this chart that showed how most of our course would be organized:
 Chapter 4 One-Way ANOVA Recall this chart that showed how most of our course would be organized: Explanatory Variable(s) Response Variable Methods Categorical Categorical Contingency Tables Categorical
10-4-10 Year 9 mathematics: holiday revision. 2 How many nines are there in fifty-four?
 DAY 1 Mental questions 1 Multiply seven by seven. 49 2 How many nines are there in fifty-four? 54 9 = 6 6 3 What number should you add to negative three to get the answer five? 8 4 Add two point five to
CHAPTER 13. Experimental Design and Analysis of Variance
 CHAPTER 13 Experimental Design and Analysis of Variance CONTENTS STATISTICS IN PRACTICE: BURKE MARKETING SERVICES, INC. 13.1 AN INTRODUCTION TO EXPERIMENTAL DESIGN AND ANALYSIS OF VARIANCE Data Collection
Study Guide for the Final Exam
 Study Guide for the Final Exam When studying, remember that the computational portion of the exam will only involve new material (covered after the second midterm), that material from Exam 1 will make
Independent t- Test (Comparing Two Means)
") Independent t- Test (Comparing Two Means) The objectives of this lesson are to learn: the definition/purpose of independent t-test when to use the independent t-test the use of SPSS to complete an independent
Independent t- Test (Comparing Two Means) The objectives of this lesson are to learn: the definition/purpose of independent t-test when to use the independent t-test the use of SPSS to complete an independent
LAB 4 INSTRUCTIONS CONFIDENCE INTERVALS AND HYPOTHESIS TESTING
 LAB 4 INSTRUCTIONS CONFIDENCE INTERVALS AND HYPOTHESIS TESTING In this lab you will explore the concept of a confidence interval and hypothesis testing through a simulation problem in engineering setting.
ALGEBRA. sequence, term, nth term, consecutive, rule, relationship, generate, predict, continue increase, decrease finite, infinite
 ALGEBRA Pupils should be taught to: Generate and describe sequences As outcomes, Year 7 pupils should, for example: Use, read and write, spelling correctly: sequence, term, nth term, consecutive, rule,
Two-sample t-tests. - Independent samples - Pooled standard devation - The equal variance assumption
 Two-sample t-tests. - Independent samples - Pooled standard devation - The equal variance assumption Last time, we used the mean of one sample to test against the hypothesis that the true mean was a particular
Excess Units in Pursuit of the Bachelor s Degree
 Excess in Pursuit of the Bachelor s -- An Analysis on Native Freshmen Graduated during 2009-2010 Office of Institutional Research Sacramento State July-September, 2011 This report intends to examine the
A permutation can also be represented by describing its cycles. What do you suppose is meant by this?
 Shuffling, Cycles, and Matrices Warm up problem. Eight people stand in a line. From left to right their positions are numbered,,,... 8. The eight people then change places according to THE RULE which directs
CHAPTER 5 COMPARISON OF DIFFERENT TYPE OF ONLINE ADVERTSIEMENTS. Table: 8 Perceived Usefulness of Different Advertisement Types
 CHAPTER 5 COMPARISON OF DIFFERENT TYPE OF ONLINE ADVERTSIEMENTS 5.1 Descriptive Analysis- Part 3 of Questionnaire Table 8 shows the descriptive statistics of Perceived Usefulness of Banner Ads. The results
General Method: Difference of Means. 3. Calculate df: either Welch-Satterthwaite formula or simpler df = min(n 1, n 2 ) 1.
 1.") General Method: Difference of Means 1. Calculate x 1, x 2, SE 1, SE 2. 2. Combined SE = SE1 2 + SE2 2. ASSUMES INDEPENDENT SAMPLES. 3. Calculate df: either Welch-Satterthwaite formula or simpler df = min(n
General Method: Difference of Means 1. Calculate x 1, x 2, SE 1, SE 2. 2. Combined SE = SE1 2 + SE2 2. ASSUMES INDEPENDENT SAMPLES. 3. Calculate df: either Welch-Satterthwaite formula or simpler df = min(n
(Refer Slide Time: 01.26)
") Discrete Mathematical Structures Dr. Kamala Krithivasan Department of Computer Science and Engineering Indian Institute of Technology, Madras Lecture # 27 Pigeonhole Principle In the next few lectures
Discrete Mathematical Structures Dr. Kamala Krithivasan Department of Computer Science and Engineering Indian Institute of Technology, Madras Lecture # 27 Pigeonhole Principle In the next few lectures
Chapter 14: Repeated Measures Analysis of Variance (ANOVA)
") Chapter 14: Repeated Measures Analysis of Variance (ANOVA) First of all, you need to recognize the difference between a repeated measures (or dependent groups) design and the between groups (or independent
Chapter 14: Repeated Measures Analysis of Variance (ANOVA) First of all, you need to recognize the difference between a repeated measures (or dependent groups) design and the between groups (or independent
MATH 140 HYBRID INTRODUCTORY STATISTICS COURSE SYLLABUS
 MATH 140 HYBRID INTRODUCTORY STATISTICS COURSE SYLLABUS Instructor: Mark Schilling Email: mark.schilling@csun.edu (Note: If your CSUN email address is not one you use regularly, be sure to set up automatic
Comparing Two Groups. Standard Error of ȳ 1 ȳ 2. Setting. Two Independent Samples
 Comparing Two Groups Chapter 7 describes two ways to compare two populations on the basis of independent samples: a confidence interval for the difference in population means and a hypothesis test. The
FIELD TESTS OF FUEL EFFICIENCY MAGNETS J A CRABB JULY 1997 SWEEG REPORT 80
 FIELD TESTS OF FUEL EFFICIENCY MAGNETS J A CRABB JULY 1997 SWEEG REPORT 80 List of symbols T f average temperature at the flow header, C T r average temperature at the return header, C f average water
Two-Sample T-Tests Assuming Equal Variance (Enter Means)
") Chapter 4 Two-Sample T-Tests Assuming Equal Variance (Enter Means) Introduction This procedure provides sample size and power calculations for one- or two-sided two-sample t-tests when the variances of
Chapter 4 Two-Sample T-Tests Assuming Equal Variance (Enter Means) Introduction This procedure provides sample size and power calculations for one- or two-sided two-sample t-tests when the variances of
LOCAL ISSUES. ST. MICHAEL S HOSPITAL (hereinafter referred to as "the Hospital") ONTARIO NURSES ASSOCIATION (hereinafter referred to as "the Union")
 ONTARIO NURSES ASSOCIATION (hereinafter referred to as the Union)") LOCAL ISSUES Between: ST. MICHAEL S HOSPITAL (hereinafter referred to as "the Hospital") And: ONTARIO NURSES ASSOCIATION (hereinafter referred to as "the Union") Combined Expiry Date: March 31, 2016 TABLE
LOCAL ISSUES Between: ST. MICHAEL S HOSPITAL (hereinafter referred to as "the Hospital") And: ONTARIO NURSES ASSOCIATION (hereinafter referred to as "the Union") Combined Expiry Date: March 31, 2016 TABLE
Tests for Two Proportions
 Chapter 200 Tests for Two Proportions Introduction This module computes power and sample size for hypothesis tests of the difference, ratio, or odds ratio of two independent proportions. The test statistics
9. Sampling Distributions
 9. Sampling Distributions Prerequisites none A. Introduction B. Sampling Distribution of the Mean C. Sampling Distribution of Difference Between Means D. Sampling Distribution of Pearson's r E. Sampling
Descriptive Analysis
 Research Methods William G. Zikmund Basic Data Analysis: Descriptive Statistics Descriptive Analysis The transformation of raw data into a form that will make them easy to understand and interpret; rearranging,
Chapter 7 Section 7.1: Inference for the Mean of a Population
 Chapter 7 Section 7.1: Inference for the Mean of a Population Now let s look at a similar situation Take an SRS of size n Normal Population : N(, ). Both and are unknown parameters. Unlike what we used
SOCIETY OF ACTUARIES THE AMERICAN ACADEMY OF ACTUARIES RETIREMENT PLAN PREFERENCES SURVEY REPORT OF FINDINGS. January 2004
 SOCIETY OF ACTUARIES THE AMERICAN ACADEMY OF ACTUARIES RETIREMENT PLAN PREFERENCES SURVEY REPORT OF FINDINGS January 2004 Mathew Greenwald & Associates, Inc. TABLE OF CONTENTS INTRODUCTION... 1 SETTING
NCSS Statistical Software
 Chapter 06 Introduction This procedure provides several reports for the comparison of two distributions, including confidence intervals for the difference in means, two-sample t-tests, the z-test, the
Permission is given for the making of copies for use in the home or classroom of the purchaser only.
 Copyright 2005 Second Edition 2008 Teresa Evans. All rights reserved. Permission is given for the making of copies for use in the home or classroom of the purchaser only. Part 1 Math Card Games to Play
Sequential Skills. Strands and Major Topics
 Sequential Skills This set of charts lists, by strand, the skills that are assessed, taught, and practiced in the Skills Tutorial program. Each Strand ends with a Mastery Test. You can enter correlating
If A is divided by B the result is 2/3. If B is divided by C the result is 4/7. What is the result if A is divided by C?
 Problem 3 If A is divided by B the result is 2/3. If B is divided by C the result is 4/7. What is the result if A is divided by C? Suggested Questions to ask students about Problem 3 The key to this question
INVESTIGATION OF FALLING BALL VISCOMETRY AND ITS ACCURACY GROUP R1 Evelyn Chou, Julia Glaser, Bella Goyal, Sherri Wykosky
 INVESTIGATION OF FALLING BALL VISCOMETRY AND ITS ACCURACY GROUP R1 Evelyn Chou, Julia Glaser, Bella Goyal, Sherri Wykosky ABSTRACT: A falling ball viscometer and its associated equations were studied in
Module 2 Probability and Statistics
 Module 2 Probability and Statistics BASIC CONCEPTS Multiple Choice Identify the choice that best completes the statement or answers the question. 1. The standard deviation of a standard normal distribution
Data Analysis, Statistics, and Probability
 Chapter 6 Data Analysis, Statistics, and Probability Content Strand Description Questions in this content strand assessed students skills in collecting, organizing, reading, representing, and interpreting
New Jersey Practical Nursing Education Programs 2008
 New Jersey Practical Nursing Education Programs 2008 Results of the 2008 Survey of New Jersey Nursing Education Programs Introduction New Jersey has both public Practical Nurse Education Programs and others
Hypothesis Test for Mean Using Given Data (Standard Deviation Known-z-test)
") Hypothesis Test for Mean Using Given Data (Standard Deviation Known-z-test) A hypothesis test is conducted when trying to find out if a claim is true or not. And if the claim is true, is it significant.
Hypothesis Test for Mean Using Given Data (Standard Deviation Known-z-test) A hypothesis test is conducted when trying to find out if a claim is true or not. And if the claim is true, is it significant.
Journal Of Financial And Strategic Decisions Volume 10 Number 2 Summer 1997
 Journal Of Financial And Strategic Decisions Volume 10 Number 2 Summer 1997 AN EMPIRICAL INVESTIGATION OF PUT OPTION PRICING: A SPECIFICATION TEST OF AT-THE-MONEY OPTION IMPLIED VOLATILITY Hongshik Kim,
PERCEPTION OF SENIOR CITIZEN RESPONDENTS AS TO REVERSE MORTGAGE SCHEME
 CHAPTER- V PERCEPTION OF SENIOR CITIZEN RESPONDENTS AS TO REVERSE MORTGAGE SCHEME 5.1 Introduction The present study intended to investigate the senior citizen s retirement planning and their perception
The correlation coefficient
 The correlation coefficient Clinical Biostatistics The correlation coefficient Martin Bland Correlation coefficients are used to measure the of the relationship or association between two quantitative
Chapter 9. Two-Sample Tests. Effect Sizes and Power Paired t Test Calculation
 Chapter 9 Two-Sample Tests Paired t Test (Correlated Groups t Test) Effect Sizes and Power Paired t Test Calculation Summary Independent t Test Chapter 9 Homework Power and Two-Sample Tests: Paired Versus
Unit 26: Small Sample Inference for One Mean
 Unit 26: Small Sample Inference for One Mean Prerequisites Students need the background on confidence intervals and significance tests covered in Units 24 and 25. Additional Topic Coverage Additional coverage
Pearson's Correlation Tests
 Chapter 800 Pearson's Correlation Tests Introduction The correlation coefficient, ρ (rho), is a popular statistic for describing the strength of the relationship between two variables. The correlation
INTERSECTION MATH And more! James Tanton
 INTERSECTION MATH And more! James Tanton www.jamestanton.com The following represents a sample activity based on the December 2006 newsletter of the St. Mark s Institute of Mathematics (www.stmarksschool.org/math).
Survey Research: Choice of Instrument, Sample. Lynda Burton, ScD Johns Hopkins University
 This work is licensed under a Creative Commons Attribution-NonCommercial-ShareAlike License. Your use of this material constitutes acceptance of that license and the conditions of use of materials on this
Possible Stage Two Mathematics Test Topics
 Possible Stage Two Mathematics Test Topics The Stage Two Mathematics Test questions are designed to be answerable by a good problem-solver with a strong mathematics background. It is based mainly on material
11. Analysis of Case-control Studies Logistic Regression
 Research methods II 113 11. Analysis of Case-control Studies Logistic Regression This chapter builds upon and further develops the concepts and strategies described in Ch.6 of Mother and Child Health:
PIMA COUNTY ATTORNEY S OFFICE ATTORNEY STAFFING SUMMARY AND WORKLOAD COMPARISONS 1996-2006
 PIMA COUNTY ATTORNEY S OFFICE ATTORNEY STAFFING SUMMARY AND WORKLOAD COMPARISONS 1996-2006 In November of 2006 the population of surpassed one million people -- a 30% population increase in ten years!
A POPULATION MEAN, CONFIDENCE INTERVALS AND HYPOTHESIS TESTING
 CHAPTER 5. A POPULATION MEAN, CONFIDENCE INTERVALS AND HYPOTHESIS TESTING 5.1 Concepts When a number of animals or plots are exposed to a certain treatment, we usually estimate the effect of the treatment
IBM SPSS Statistics 20 Part 4: Chi-Square and ANOVA
 CALIFORNIA STATE UNIVERSITY, LOS ANGELES INFORMATION TECHNOLOGY SERVICES IBM SPSS Statistics 20 Part 4: Chi-Square and ANOVA Summer 2013, Version 2.0 Table of Contents Introduction...2 Downloading the
ijcrb.webs.com INTERDISCIPLINARY JOURNAL OF CONTEMPORARY RESEARCH IN BUSINESS AUGUST 2012 VOL 4, NO 4
 INVESTIGATING ORGANIZATIONAL KNOWLEDGE MANAGEMENT IN CONTROL AND SUPERVISION (GENERAL INSPECTION ORGANIZATION) Mohammad Mehdi Davali 22 ( Corresponding Author) Mohammad Esmaeil Ansari 23 Abstract In today
AP: LAB 8: THE CHI-SQUARE TEST. Probability, Random Chance, and Genetics
 Ms. Foglia Date AP: LAB 8: THE CHI-SQUARE TEST Probability, Random Chance, and Genetics Why do we study random chance and probability at the beginning of a unit on genetics? Genetics is the study of inheritance,
(a) FLORIDA LOTTO is a lottery online terminal game in which players select six (6) numbers from a field of
 FLORIDA LOTTO is a lottery online terminal game in which players select six (6) numbers from a field of") 53ER14-18 FLORIDA LOTTO. (1) How to Play FLORIDA LOTTO. (a) FLORIDA LOTTO is a lottery online terminal game in which players select six (6) numbers from a field of one (1) to fifty-three (53). (b) Players
53ER14-18 FLORIDA LOTTO. (1) How to Play FLORIDA LOTTO. (a) FLORIDA LOTTO is a lottery online terminal game in which players select six (6) numbers from a field of one (1) to fifty-three (53). (b) Players
Jessica Kohout Marlene Wicherski. October 2010. Center for Workforce Studies American Psychological Association
 2011 Graduate Study in Snapshot: Applications, Acceptances, Enrollments, and Degrees Awarded to Master s- and Doctoral-Level Students in U.S. and Canadian Graduate Departments of : 2009-2010 Jessica Kohout
Research Methods & Experimental Design
 Research Methods & Experimental Design 16.422 Human Supervisory Control April 2004 Research Methods Qualitative vs. quantitative Understanding the relationship between objectives (research question) and
Section 7.1. Introduction to Hypothesis Testing. Schrodinger s cat quantum mechanics thought experiment (1935)
") Section 7.1 Introduction to Hypothesis Testing Schrodinger s cat quantum mechanics thought experiment (1935) Statistical Hypotheses A statistical hypothesis is a claim about a population. Null hypothesis
Section 7.1 Introduction to Hypothesis Testing Schrodinger s cat quantum mechanics thought experiment (1935) Statistical Hypotheses A statistical hypothesis is a claim about a population. Null hypothesis
The Undergraduate Study and Examinations Regulations and the KFUPM Rules for Their Implementations
 بسم الرحمن الرحيم Kingdom of Saudi Arabia Ministry of Higher Education King Fahd University of Petroleum & Minerals The Undergraduate Study and Examinations Regulations and the KFUPM Rules for Their Implementations
Non-Inferiority Tests for Two Proportions
 Chapter 0 Non-Inferiority Tests for Two Proportions Introduction This module provides power analysis and sample size calculation for non-inferiority and superiority tests in twosample designs in which
CHAPTER 4 RESULTS. four research questions. The first section demonstrates the effects of the strategy
 CHAPTER 4 RESULTS This chapter presents the statistical analysis of the collected data based on the four research questions. The first section demonstrates the effects of the strategy instruction on the
A Comparative Study of the Pickup Method and its Variations Using a Simulated Hotel Reservation Data
 A Comparative Study of the Pickup Method and its Variations Using a Simulated Hotel Reservation Data Athanasius Zakhary, Neamat El Gayar Faculty of Computers and Information Cairo University, Giza, Egypt
UNDERSTANDING ANALYSIS OF COVARIANCE (ANCOVA)
") UNDERSTANDING ANALYSIS OF COVARIANCE () In general, research is conducted for the purpose of explaining the effects of the independent variable on the dependent variable, and the purpose of research design
UNDERSTANDING ANALYSIS OF COVARIANCE () In general, research is conducted for the purpose of explaining the effects of the independent variable on the dependent variable, and the purpose of research design
WISE Power Tutorial All Exercises
 ame Date Class WISE Power Tutorial All Exercises Power: The B.E.A.. Mnemonic Four interrelated features of power can be summarized using BEA B Beta Error (Power = 1 Beta Error): Beta error (or Type II
Inference for two Population Means
 Inference for two Population Means Bret Hanlon and Bret Larget Department of Statistics University of Wisconsin Madison October 27 November 1, 2011 Two Population Means 1 / 65 Case Study Case Study Example
An Evaluation of Kansas City Reading Programs for Turn the Page Kansas City
 February 28, 2014 An Evaluation of Kansas City Reading Programs for Turn the Page Kansas City Leigh Anne Taylor Knight, Ed. D. Hajar Aghababa, Ph. D. Jiaxi Quan, Ph.D. Pat Oslund, M.A. Technical Assistance:
Terminating Sequential Delphi Survey Data Collection
 A peer-reviewed electronic journal. Copyright is retained by the first or sole author, who grants right of first publication to the Practical Assessment, Research & Evaluation. Permission is granted to
Stepwise Regression. Chapter 311. Introduction. Variable Selection Procedures. Forward (Step-Up) Selection
 Selection") Chapter 311 Introduction Often, theory and experience give only general direction as to which of a pool of candidate variables (including transformed variables) should be included in the regression model.
Chapter 311 Introduction Often, theory and experience give only general direction as to which of a pool of candidate variables (including transformed variables) should be included in the regression model.
Object-Oriented Analysis. with the Unified Process. John W. Satzinger Southwest Missouri State University. Robert B. Jackson Brigham Young University
 Object-Oriented Analysis and Design with the Unified Process John W. Satzinger Southwest Missouri State University Robert B. Jackson Brigham Young University Stephen D. Burd University of New Mexico ALL
A Study in Engineering and Military Ethics
 Abstract A Study in Engineering and Military Ethics Gayle Davis This paper was completed and submitted in partial fulfillment of the Master Teacher Program, a 2-year faculty professional development program
Small Business Health Care Tax Credit
 Small Business Health Care Tax Credit Small Business Health Tax Credit Began in 2010 Helps small businesses and tax-exempt organizations afford the cost of covering their employees Specifically targeted
Two-Sample T-Tests Allowing Unequal Variance (Enter Difference)
") Chapter 45 Two-Sample T-Tests Allowing Unequal Variance (Enter Difference) Introduction This procedure provides sample size and power calculations for one- or two-sided two-sample t-tests when no assumption
Chapter 45 Two-Sample T-Tests Allowing Unequal Variance (Enter Difference) Introduction This procedure provides sample size and power calculations for one- or two-sided two-sample t-tests when no assumption
Basic Concepts in Research and Data Analysis
 Basic Concepts in Research and Data Analysis Introduction: A Common Language for Researchers...2 Steps to Follow When Conducting Research...3 The Research Question... 3 The Hypothesis... 4 Defining the
5/31/2013. Chapter 8 Hypothesis Testing. Hypothesis Testing. Hypothesis Testing. Outline. Objectives. Objectives
 C H 8A P T E R Outline 8 1 Steps in Traditional Method 8 2 z Test for a Mean 8 3 t Test for a Mean 8 4 z Test for a Proportion 8 6 Confidence Intervals and Copyright 2013 The McGraw Hill Companies, Inc.
SYSTEMS ANALYSIS AND DESIGN DO NOT COPY
 Systems Analysis and Design in a Changing World, Fourth Edition -488-6-5 Copyright 7 Thomson Course Technology. All rights reserved. FOURTH EDITION SYSTEMS ANALYSIS AND DESIGN IN A C HANGING W ORLD John
Research Proposal: Evaluating the Effectiveness of Online Learning as. Opposed to Traditional Classroom Delivered Instruction. Mark R.
 1 Running head: Effectiveness of Online Learning Research Proposal: Evaluating the Effectiveness of Online Learning as Opposed to Traditional Classroom Delivered Instruction Mark R. Domenic University
Data Analysis Tools. Tools for Summarizing Data
 Data Analysis Tools This section of the notes is meant to introduce you to many of the tools that are provided by Excel under the Tools/Data Analysis menu item. If your computer does not have that tool
Stat 411/511 THE RANDOMIZATION TEST. Charlotte Wickham. stat511.cwick.co.nz. Oct 16 2015
 Stat 411/511 THE RANDOMIZATION TEST Oct 16 2015 Charlotte Wickham stat511.cwick.co.nz Today Review randomization model Conduct randomization test What about CIs? Using a t-distribution as an approximation