Nonparametric Statistics
|
|
|
- Cora Rich
- 9 years ago
- Views:
Transcription
1 Nonparametric Statistics J. Lozano University of Goettingen Department of Genetic Epidemiology Interdisciplinary PhD Program in Applied Statistics & Empirical Methods Graduate Seminar in Applied Statistics July 3, 2006

2 2
3 Parametric vs. Nonparametric Hypothesis Testing Procedures Parametric Nonparametric z-test t-test One-Way ANOVA Wilcoxon Mann Whitney Test Kruskal-Wallis Test Many More Tests Exist! 3

4 Learning Objectives: 1. Differentiate nonparametric from parametric statistics 2. Discuss the advantages and disadvantages of nonparametric statistics 3. Enumerate and differentiate the different nonparametric tests 4. Apply some commonly used nonparametric test to hypothesis testing problems 4

5 Parametric Test Procedures 1. Involve Population Parameters Example: Population Mean t X μ 0 (S n) x 2. Have Stringent Assumptions Example: Normal Distribution 3. Require Interval Scale or Ratio Scale Whole Numbers or Fractions Example: Height in Inches (72, 60.5, 54.7) 4. Examples: z-test, t-test, ANOVA μ 5

6 Nonparametric Test Procedures 1. Do Not Involve Population Parameters 2. No Stringent Distribution Assumptions Distribution-free 3. Data Measured on Any Scale Ratio or Interval Ordinal Example: Good-Better-Best Nominal Example: Male-Female 4. Example: Wilcoxon-Mann-Whitney Test 6

7 Advantages of Nonparametric Tests 1. Used With All Scales 2. Easier to Compute Developed Originally Before Wide Computer Use 3. Make Fewer Assumptions 4. Need Not Involve Population Parameters 5. Results May Be as Exact as Parametric Procedures 7

8 Disadvantages of Nonparametric Tests 1. May Waste Information If Data Permit Using Parametric Procedures Example: Converting Data From Ratio to Ordinal Scale 2. Require a larger sample size than the corresponding parametric test in order to achieve the same power 3. Difficult to Compute by Hand for Large Samples 4. Stat tables are not readily available 8

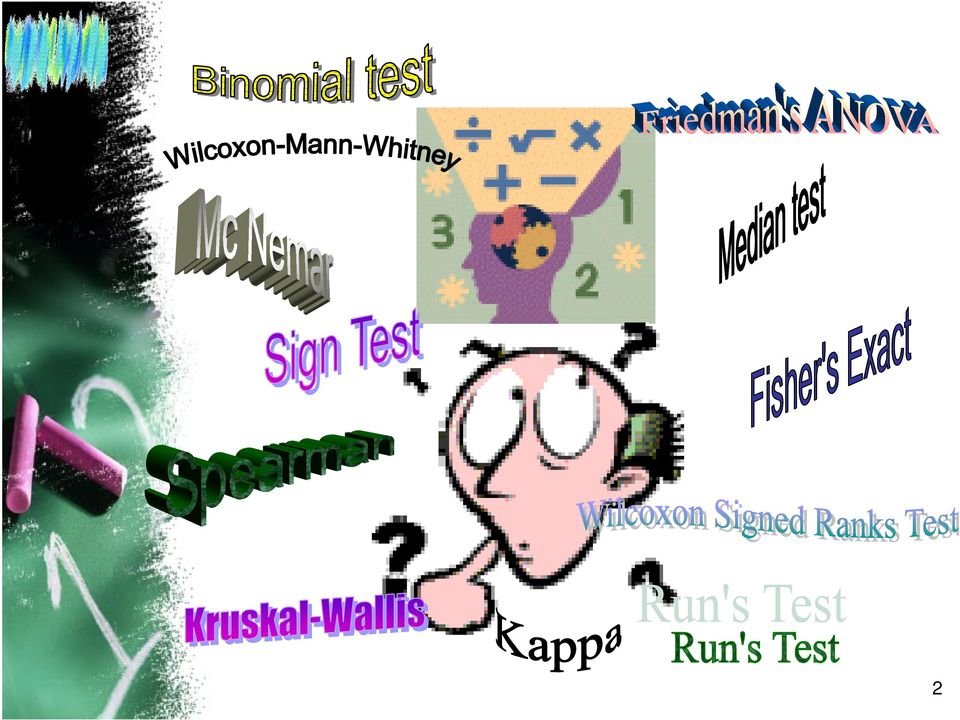
9 Summary Table of Statistical Tests Level of Measurement Sample Characteristics Correlation 1 Sample 2 Sample K Sample (i.e., >2) Independent Dependent Independent Dependent Categorical or Nominal Rank or Ordinal Χ 2 Run s test Kolmogorov Smirnov Χ 2 Fisher Exact Median Test Binomial Wilcoxon- Mann- Whitney Mc Nemar s Χ 2 Cochran s Q Sign Test Wilcoxon Signed Ranks Kruskal-Wallis Friendman s ANOVA Kappa Agreement Test Spearman s rho Kendall Rank Parametric (Interval & Ratio) z-test or t-test t- test between groups Paired t-test 1 way ANOVA between groups 1 way ANOVA (within or repeated measure) Pearson s r Factorial ANOVA 9
 Independent Dependent Independent Dependent Categorical or Nominal")
10 Application of Commonly Used Nonparametric Statistics 10

11 Frequency x x2 => nonparametric statistics 11

12 Wilcoxon-Mann-Whitney Test

13 Wilcoxon-Mann-Whitney Test Also known as Wilcoxon-test, Wilcoxon rank sum test, U-test, Mann-Whitney-U-test Tests Two Independent Population - compare medians Corresponds to t-test for 2 Independent Means Assumptions Independent, Random Samples Populations Are Continuous Can Use Normal Approximation If n i 20 13

14 Wilcoxon-Mann-Whitney Test Procedure 1. Assign Ranks, r i, to the n 1 + n 2 Sample Observations If unequal sample sizes, let n 1 refer to smaller-sized sample Smallest Value = 1 Average Ties 2. Sum the Ranks, R i, for Each Sample 3. Test Statistic Null hypothesis: both samples come from the same underlying distribution n ( n 1) U n n R where R is the sum of ranks in sample1 Compute also (n 1 n 2 U). If this expression is larger than the above U, then this becomes the final U statistic. ** At N>=20, U begins to approximate t, so the test stat changes to a t-value. 14
 U n n R 2 1 1 1 2 1 1 where R is the sum of ranks")
15 Wilcoxon-Mann-Whitney Test Example You re an agriculturist. You want to determine if there was a difference in the biomass of male and female Juniper trees. Randomly select 6 trees of each gender from the field. Dry them to constant moisture and weigh in kg. Male trees Data: 71, 73, 78, 75, 72, 74 Female trees Data: 80, 73, 83, 84, 82, 79 15

16 Wilcoxon-Mann-Whitney Test Solution H0: Ha: = n1 = n2 = Critical Value: Test Statistic: Decision: Conclusion: 16

17 Wilcoxon-Mann-Whitney Test Computation Table Male Trees Female Trees Weight Rank Weight Rank Rank Sum

18 Wilcoxon-Mann-Whitney Test Solution H0: Median weights = Ha: Medians not = =0.05 n1 = 6 n2 = 6 Critical Value: U table = 31 * Depends on the U table you are using Test Statistic: U = (6)(6) + (6)(7)/ = 32.5 n1n2 - U = (6)(6) 32.5 = 3.5 *!!! final U Calc = 32.5 Decision: Reject H 0 at =.05 since U calc > U table Conclusion: There is evidence that the medians are not equal. 18

19 NPar Tests Mann-Whitney Test Wilcoxon-Mann-Whitney Test Solution (SPSS Output) Ranks Weight in kg Gender of Tree Male Female Total N Mean Rank Sum of Ranks Mann-Whitney U Wilcoxon W Z Test Statistics b Asymp. Sig. (2-tailed) Exact Sig. [2*(1-tailed Sig.)] a. Not corrected for ties. Weight in kg a b. Grouping Variable: Gender of Tree p < ; Reject Ho 19
] a. Not corrected for ties. Weight in kg 3.500 24.500-2.326.020.015 a b.")
20 Sign Test

21 Sign Test 1. Tests One Population Median, (eta) 2. Corresponds to t-test for 1 Mean 3. Assumes Population Is Continuous 4. Small Sample Test Statistic: # Sample Values Above (or Below) Median 5. Can Use Normal Approximation If n 10 21
22 Sign Test Example You re a marketing analyst for Chefs-R-Us. You ve asked 8 people to rate a new ravioli on a 5-point Likert scale 1 = terrible to 5 = excellent The ratings are: At the.05 level, is there evidence that the median rating is at least 3? 22
23 Sign Test Solution H0: Ha: = Test Statistic: P-Value: Decision: Conclusion: 23
24 30% 20% Sign Test Uses P-Value to Make Decision P(X) Binomial: n = 8 p = % 0% X P-Value is the probability of getting an observation at Least as extreme as we got. If 7 of 8 Observations Favor H a, Then P-Value P = P(x 7) = =.035. If =.05, Then Reject H 0 Since P-Value P. 24
25 Sign Test Solution H0: = 3 Ha: < 3 =.05 Test Statistic: S = 7 (Ratings 1 & 2 are less than = 3: ) P-Value: P(x 7) = =.035 (Binomial Table, n = 8, p = 0.50) n! x n X P( X ) (1 ) X!( n X )! Decision: Reject H 0 at =.05 Conclusion: There is evidence that the median is less than 3 25
26 Sign Test (R Output) R version (BSDA and ev10 package must be loaded) > x <- c(2,4,1,2,1,1,2,1) > sign.test(x,md=3, alternative="less") One-sample Sign-Test data: x s = 1, p-value = alternative hypothesis: true median is less than 3 95 percent confidence interval: -Inf 2 sample estimates: median of x 1.5 $Confidence.Intervals Conf.Level L.E.pt U.E.pt Lower Achieved CI Inf 2 Interpolated CI Inf 2 Upper Achieved CI Inf 2 Warning message: multi-argument returns are deprecated in: return(rval, Confidence.Intervals) 26
27 Mc Nemar Change Test
28 McNemar Change Test (MCT) Typical examples: Testing the shift in the proportion of abnormal responses from before and after treatment in the same group of patients Comparing two ocular treatments when both are given to each patient, one in each eye 28
29 Data Layout: MCT Condition 1 No. of Responders No. of Non- Responders No. of Responders Condition 2 No. of Non- Responders TOTAL A B A + B C D C + D TOTAL A + C B + D N= A +B +C +D 29
30 McNemar Change Test (MCT) The hypothesis of interest is the equality of response proportions, p 1 and p 2, under conditions 1 and 2, respectively. The test statistic is based on the difference in the discordant cell frequencies (B, C). 30
31 Test Summary: MCT Null hypothesis: H 0 : p 1 = p 2 Alternative hypothesis: H a : p 1 p 2 Test Statistic: χ 2 χ 2 α 1 where 1 is the critical value from the chi-square table with significance level and 1 degree of freedom Decision Rule:Reject H 0 if χ 2 α 2 χ C B C B 2 31
32 Example: MCT Bilirubin Abnormalities Following Drug Treatment 86 patients were treated with an experimental drug for 3 months. Pre-post study clinical laboratory results showed abnormally high total bilirubin values. Is there evidence of a change in the preto post-treatment rates of abnormalities? 32
33 Solution: MCT Let p 1 and p 2 represent the proportions of patients with abnormally high bilirubin values ( Y ) before and after treatment, respectively. POST- Treatment N Y TOTAL PRE- N Treatment Y TOTAL Y = T.Bilirubin above upper limit of normal range 33
34 Test Summary: MCT Null hypothesis: H 0 : p 1 = p 2 Alternative hypothesis: H a : p 1 p 2 Test Statistic: B C χ 3.20 B C Decision: Do not reject H 0 since χ 2 < χ 2 α Conclusion: There is no sufficient evidence to conclude at 0.05 level of significance that a shift in abnormality rates occurs with treatment. 34
35 SAS Computer Output for MCT McNemar's Test Example: Bilirubin Abnormalities Following Drug Treatment TABLE OF PRE BY PST PRE(PRE) PST(PST) Frequency Percent Row Pct Col Pct N Y Total ƒƒƒƒƒƒƒƒƒˆƒƒƒƒƒƒƒƒˆƒƒƒƒƒƒƒƒˆ N ƒƒƒƒƒƒƒƒƒˆƒƒƒƒƒƒƒƒˆƒƒƒƒƒƒƒƒˆ Y ƒƒƒƒƒƒƒƒƒˆƒƒƒƒƒƒƒƒˆƒƒƒƒƒƒƒƒˆ Total STATISTICS FOR TABLE OF PRE BY PST McNemar's Test Statistic = DF = 1 Prob =
36 References Dawson-Saunders, B. and Trapp, R.G. Basic and Clinical Biostatistics. Connecticut: Prentice Hall International, Inc. (1990). McGill, J.J. Chap. 14: Nonparametric Statistics Presentation. (May 2006). Siegel S. and Castellan N.J. Nonparametric Statistics for the Behavioral Sciences (2nd edition). New York: McGraw Hill (1988). Walker G.A. Common Statistical Methods for Clinical Research with SAS Examples, SAS Institute, Inc, Cary NC (1997). 36
Nonparametric Two-Sample Tests. Nonparametric Tests. Sign Test
 Nonparametric Two-Sample Tests Sign test Mann-Whitney U-test (a.k.a. Wilcoxon two-sample test) Kolmogorov-Smirnov Test Wilcoxon Signed-Rank Test Tukey-Duckworth Test 1 Nonparametric Tests Recall, nonparametric
SPSS Tests for Versions 9 to 13
 SPSS Tests for Versions 9 to 13 Chapter 2 Descriptive Statistic (including median) Choose Analyze Descriptive statistics Frequencies... Click on variable(s) then press to move to into Variable(s): list
EPS 625 INTERMEDIATE STATISTICS FRIEDMAN TEST
 EPS 625 INTERMEDIATE STATISTICS The Friedman test is an extension of the Wilcoxon test. The Wilcoxon test can be applied to repeated-measures data if participants are assessed on two occasions or conditions
Projects Involving Statistics (& SPSS)
") Projects Involving Statistics (& SPSS) Academic Skills Advice Starting a project which involves using statistics can feel confusing as there seems to be many different things you can do (charts, graphs,
Projects Involving Statistics (& SPSS) Academic Skills Advice Starting a project which involves using statistics can feel confusing as there seems to be many different things you can do (charts, graphs,
SCHOOL OF HEALTH AND HUMAN SCIENCES DON T FORGET TO RECODE YOUR MISSING VALUES
 SCHOOL OF HEALTH AND HUMAN SCIENCES Using SPSS Topics addressed today: 1. Differences between groups 2. Graphing Use the s4data.sav file for the first part of this session. DON T FORGET TO RECODE YOUR
NONPARAMETRIC STATISTICS 1. depend on assumptions about the underlying distribution of the data (or on the Central Limit Theorem)
") NONPARAMETRIC STATISTICS 1 PREVIOUSLY parametric statistics in estimation and hypothesis testing... construction of confidence intervals computing of p-values classical significance testing depend on assumptions
NONPARAMETRIC STATISTICS 1 PREVIOUSLY parametric statistics in estimation and hypothesis testing... construction of confidence intervals computing of p-values classical significance testing depend on assumptions
Overview of Non-Parametric Statistics PRESENTER: ELAINE EISENBEISZ OWNER AND PRINCIPAL, OMEGA STATISTICS
 Overview of Non-Parametric Statistics PRESENTER: ELAINE EISENBEISZ OWNER AND PRINCIPAL, OMEGA STATISTICS About Omega Statistics Private practice consultancy based in Southern California, Medical and Clinical
Statistics. One-two sided test, Parametric and non-parametric test statistics: one group, two groups, and more than two groups samples
 Statistics One-two sided test, Parametric and non-parametric test statistics: one group, two groups, and more than two groups samples February 3, 00 Jobayer Hossain, Ph.D. & Tim Bunnell, Ph.D. Nemours
Research Methods & Experimental Design
 Research Methods & Experimental Design 16.422 Human Supervisory Control April 2004 Research Methods Qualitative vs. quantitative Understanding the relationship between objectives (research question) and
Independent t- Test (Comparing Two Means)
") Independent t- Test (Comparing Two Means) The objectives of this lesson are to learn: the definition/purpose of independent t-test when to use the independent t-test the use of SPSS to complete an independent
Independent t- Test (Comparing Two Means) The objectives of this lesson are to learn: the definition/purpose of independent t-test when to use the independent t-test the use of SPSS to complete an independent
Rank-Based Non-Parametric Tests
 Rank-Based Non-Parametric Tests Reminder: Student Instructional Rating Surveys You have until May 8 th to fill out the student instructional rating surveys at https://sakai.rutgers.edu/portal/site/sirs
Nonparametric tests these test hypotheses that are not statements about population parameters (e.g.,
 CHAPTER 13 Nonparametric and Distribution-Free Statistics Nonparametric tests these test hypotheses that are not statements about population parameters (e.g., 2 tests for goodness of fit and independence).
THE KRUSKAL WALLLIS TEST
 THE KRUSKAL WALLLIS TEST TEODORA H. MEHOTCHEVA Wednesday, 23 rd April 08 THE KRUSKAL-WALLIS TEST: The non-parametric alternative to ANOVA: testing for difference between several independent groups 2 NON
Analysing Questionnaires using Minitab (for SPSS queries contact -) [email protected]
 Graham.Currell@uwe.ac.uk") Analysing Questionnaires using Minitab (for SPSS queries contact -) [email protected] Structure As a starting point it is useful to consider a basic questionnaire as containing three main sections:
Analysing Questionnaires using Minitab (for SPSS queries contact -) [email protected] Structure As a starting point it is useful to consider a basic questionnaire as containing three main sections:
Intro to Parametric & Nonparametric Statistics
 Intro to Parametric & Nonparametric Statistics Kinds & definitions of nonparametric statistics Where parametric stats come from Consequences of parametric assumptions Organizing the models we will cover
Descriptive Statistics
 Descriptive Statistics Primer Descriptive statistics Central tendency Variation Relative position Relationships Calculating descriptive statistics Descriptive Statistics Purpose to describe or summarize
1 Nonparametric Statistics
 1 Nonparametric Statistics When finding confidence intervals or conducting tests so far, we always described the population with a model, which includes a set of parameters. Then we could make decisions
Statistical tests for SPSS
 Statistical tests for SPSS Paolo Coletti A.Y. 2010/11 Free University of Bolzano Bozen Premise This book is a very quick, rough and fast description of statistical tests and their usage. It is explicitly
Study Guide for the Final Exam
 Study Guide for the Final Exam When studying, remember that the computational portion of the exam will only involve new material (covered after the second midterm), that material from Exam 1 will make
UNDERSTANDING THE DEPENDENT-SAMPLES t TEST
 UNDERSTANDING THE DEPENDENT-SAMPLES t TEST A dependent-samples t test (a.k.a. matched or paired-samples, matched-pairs, samples, or subjects, simple repeated-measures or within-groups, or correlated groups)
Introduction to Analysis of Variance (ANOVA) Limitations of the t-test
 Limitations of the t-test") Introduction to Analysis of Variance (ANOVA) The Structural Model, The Summary Table, and the One- Way ANOVA Limitations of the t-test Although the t-test is commonly used, it has limitations Can only
Introduction to Analysis of Variance (ANOVA) The Structural Model, The Summary Table, and the One- Way ANOVA Limitations of the t-test Although the t-test is commonly used, it has limitations Can only
Statistics for Sports Medicine
 Statistics for Sports Medicine Suzanne Hecht, MD University of Minnesota ([email protected]) Fellow s Research Conference July 2012: Philadelphia GOALS Try not to bore you to death!! Try to teach
Chapter 12 Nonparametric Tests. Chapter Table of Contents
 Chapter 12 Nonparametric Tests Chapter Table of Contents OVERVIEW...171 Testing for Normality...... 171 Comparing Distributions....171 ONE-SAMPLE TESTS...172 TWO-SAMPLE TESTS...172 ComparingTwoIndependentSamples...172
statistics Chi-square tests and nonparametric Summary sheet from last time: Hypothesis testing Summary sheet from last time: Confidence intervals
 Summary sheet from last time: Confidence intervals Confidence intervals take on the usual form: parameter = statistic ± t crit SE(statistic) parameter SE a s e sqrt(1/n + m x 2 /ss xx ) b s e /sqrt(ss
Permutation Tests for Comparing Two Populations
 Permutation Tests for Comparing Two Populations Ferry Butar Butar, Ph.D. Jae-Wan Park Abstract Permutation tests for comparing two populations could be widely used in practice because of flexibility of
Skewed Data and Non-parametric Methods
 0 2 4 6 8 10 12 14 Skewed Data and Non-parametric Methods Comparing two groups: t-test assumes data are: 1. Normally distributed, and 2. both samples have the same SD (i.e. one sample is simply shifted
Two-Sample T-Tests Assuming Equal Variance (Enter Means)
") Chapter 4 Two-Sample T-Tests Assuming Equal Variance (Enter Means) Introduction This procedure provides sample size and power calculations for one- or two-sided two-sample t-tests when the variances of
Chapter 4 Two-Sample T-Tests Assuming Equal Variance (Enter Means) Introduction This procedure provides sample size and power calculations for one- or two-sided two-sample t-tests when the variances of
TABLE OF CONTENTS. About Chi Squares... 1. What is a CHI SQUARE?... 1. Chi Squares... 1. Hypothesis Testing with Chi Squares... 2
 About Chi Squares TABLE OF CONTENTS About Chi Squares... 1 What is a CHI SQUARE?... 1 Chi Squares... 1 Goodness of fit test (One-way χ 2 )... 1 Test of Independence (Two-way χ 2 )... 2 Hypothesis Testing
NCSS Statistical Software
 Chapter 06 Introduction This procedure provides several reports for the comparison of two distributions, including confidence intervals for the difference in means, two-sample t-tests, the z-test, the
The Chi-Square Test. STAT E-50 Introduction to Statistics
 STAT -50 Introduction to Statistics The Chi-Square Test The Chi-square test is a nonparametric test that is used to compare experimental results with theoretical models. That is, we will be comparing observed
Research Methodology: Tools
 MSc Business Administration Research Methodology: Tools Applied Data Analysis (with SPSS) Lecture 11: Nonparametric Methods May 2014 Prof. Dr. Jürg Schwarz Lic. phil. Heidi Bruderer Enzler Contents Slide
Parametric and non-parametric statistical methods for the life sciences - Session I
 Why nonparametric methods What test to use? Rank Tests Parametric and non-parametric statistical methods for the life sciences - Session I Liesbeth Bruckers Geert Molenberghs Interuniversity Institute
QUANTITATIVE METHODS BIOLOGY FINAL HONOUR SCHOOL NON-PARAMETRIC TESTS
 QUANTITATIVE METHODS BIOLOGY FINAL HONOUR SCHOOL NON-PARAMETRIC TESTS This booklet contains lecture notes for the nonparametric work in the QM course. This booklet may be online at http://users.ox.ac.uk/~grafen/qmnotes/index.html.
The Dummy s Guide to Data Analysis Using SPSS
 The Dummy s Guide to Data Analysis Using SPSS Mathematics 57 Scripps College Amy Gamble April, 2001 Amy Gamble 4/30/01 All Rights Rerserved TABLE OF CONTENTS PAGE Helpful Hints for All Tests...1 Tests
II. DISTRIBUTIONS distribution normal distribution. standard scores
 Appendix D Basic Measurement And Statistics The following information was developed by Steven Rothke, PhD, Department of Psychology, Rehabilitation Institute of Chicago (RIC) and expanded by Mary F. Schmidt,
Chapter G08 Nonparametric Statistics
 G08 Nonparametric Statistics Chapter G08 Nonparametric Statistics Contents 1 Scope of the Chapter 2 2 Background to the Problems 2 2.1 Parametric and Nonparametric Hypothesis Testing......................
SPSS ADVANCED ANALYSIS WENDIANN SETHI SPRING 2011
 SPSS ADVANCED ANALYSIS WENDIANN SETHI SPRING 2011 Statistical techniques to be covered Explore relationships among variables Correlation Regression/Multiple regression Logistic regression Factor analysis
Difference tests (2): nonparametric
: nonparametric") NST 1B Experimental Psychology Statistics practical 3 Difference tests (): nonparametric Rudolf Cardinal & Mike Aitken 10 / 11 February 005; Department of Experimental Psychology University of Cambridge
NST 1B Experimental Psychology Statistics practical 3 Difference tests (): nonparametric Rudolf Cardinal & Mike Aitken 10 / 11 February 005; Department of Experimental Psychology University of Cambridge
Two-Sample T-Tests Allowing Unequal Variance (Enter Difference)
") Chapter 45 Two-Sample T-Tests Allowing Unequal Variance (Enter Difference) Introduction This procedure provides sample size and power calculations for one- or two-sided two-sample t-tests when no assumption
Chapter 45 Two-Sample T-Tests Allowing Unequal Variance (Enter Difference) Introduction This procedure provides sample size and power calculations for one- or two-sided two-sample t-tests when no assumption
The Statistics Tutor s Quick Guide to
 statstutor community project encouraging academics to share statistics support resources All stcp resources are released under a Creative Commons licence The Statistics Tutor s Quick Guide to Stcp-marshallowen-7
Basic Statistical and Modeling Procedures Using SAS
 Basic Statistical and Modeling Procedures Using SAS One-Sample Tests The statistical procedures illustrated in this handout use two datasets. The first, Pulse, has information collected in a classroom
Chi-square test Fisher s Exact test
 Lesson 1 Chi-square test Fisher s Exact test McNemar s Test Lesson 1 Overview Lesson 11 covered two inference methods for categorical data from groups Confidence Intervals for the difference of two proportions
Bivariate Statistics Session 2: Measuring Associations Chi-Square Test
 Bivariate Statistics Session 2: Measuring Associations Chi-Square Test Features Of The Chi-Square Statistic The chi-square test is non-parametric. That is, it makes no assumptions about the distribution
SPSS 3: COMPARING MEANS
 SPSS 3: COMPARING MEANS UNIVERSITY OF GUELPH LUCIA COSTANZO [email protected] REVISED SEPTEMBER 2012 CONTENTS SPSS availability... 2 Goals of the workshop... 2 Data for SPSS Sessions... 3 Statistical
Class 19: Two Way Tables, Conditional Distributions, Chi-Square (Text: Sections 2.5; 9.1)
") Spring 204 Class 9: Two Way Tables, Conditional Distributions, Chi-Square (Text: Sections 2.5; 9.) Big Picture: More than Two Samples In Chapter 7: We looked at quantitative variables and compared the
Spring 204 Class 9: Two Way Tables, Conditional Distributions, Chi-Square (Text: Sections 2.5; 9.) Big Picture: More than Two Samples In Chapter 7: We looked at quantitative variables and compared the
Types of Data, Descriptive Statistics, and Statistical Tests for Nominal Data. Patrick F. Smith, Pharm.D. University at Buffalo Buffalo, New York
 Types of Data, Descriptive Statistics, and Statistical Tests for Nominal Data Patrick F. Smith, Pharm.D. University at Buffalo Buffalo, New York . NONPARAMETRIC STATISTICS I. DEFINITIONS A. Parametric
SPSS Explore procedure
 SPSS Explore procedure One useful function in SPSS is the Explore procedure, which will produce histograms, boxplots, stem-and-leaf plots and extensive descriptive statistics. To run the Explore procedure,
UNIVERSITY OF NAIROBI
 UNIVERSITY OF NAIROBI MASTERS IN PROJECT PLANNING AND MANAGEMENT NAME: SARU CAROLYNN ELIZABETH REGISTRATION NO: L50/61646/2013 COURSE CODE: LDP 603 COURSE TITLE: RESEARCH METHODS LECTURER: GAKUU CHRISTOPHER
Is it statistically significant? The chi-square test
 UAS Conference Series 2013/14 Is it statistically significant? The chi-square test Dr Gosia Turner Student Data Management and Analysis 14 September 2010 Page 1 Why chi-square? Tests whether two categorical
Additional sources Compilation of sources: http://lrs.ed.uiuc.edu/tseportal/datacollectionmethodologies/jin-tselink/tselink.htm
 Mgt 540 Research Methods Data Analysis 1 Additional sources Compilation of sources: http://lrs.ed.uiuc.edu/tseportal/datacollectionmethodologies/jin-tselink/tselink.htm http://web.utk.edu/~dap/random/order/start.htm
X X X a) perfect linear correlation b) no correlation c) positive correlation (r = 1) (r = 0) (0 < r < 1)
 perfect linear correlation b) no correlation c) positive correlation (r = 1) (r = 0) (0 < r < 1)") CORRELATION AND REGRESSION / 47 CHAPTER EIGHT CORRELATION AND REGRESSION Correlation and regression are statistical methods that are commonly used in the medical literature to compare two or more variables.
CORRELATION AND REGRESSION / 47 CHAPTER EIGHT CORRELATION AND REGRESSION Correlation and regression are statistical methods that are commonly used in the medical literature to compare two or more variables.
An introduction to IBM SPSS Statistics
 An introduction to IBM SPSS Statistics Contents 1 Introduction... 1 2 Entering your data... 2 3 Preparing your data for analysis... 10 4 Exploring your data: univariate analysis... 14 5 Generating descriptive
Non-parametric Tests Using SPSS
 Non-parametric Tests Using SPSS Statistical Package for Social Sciences Jinlin Fu January 2016 Contact Medical Research Consultancy Studio Australia http://www.mrcsau.com.au Contents 1 INTRODUCTION...
CHAPTER 12 TESTING DIFFERENCES WITH ORDINAL DATA: MANN WHITNEY U
 CHAPTER 12 TESTING DIFFERENCES WITH ORDINAL DATA: MANN WHITNEY U Previous chapters of this text have explained the procedures used to test hypotheses using interval data (t-tests and ANOVA s) and nominal
Analyzing Research Data Using Excel
 Analyzing Research Data Using Excel Fraser Health Authority, 2012 The Fraser Health Authority ( FH ) authorizes the use, reproduction and/or modification of this publication for purposes other than commercial
HYPOTHESIS TESTING WITH SPSS:
 HYPOTHESIS TESTING WITH SPSS: A NON-STATISTICIAN S GUIDE & TUTORIAL by Dr. Jim Mirabella SPSS 14.0 screenshots reprinted with permission from SPSS Inc. Published June 2006 Copyright Dr. Jim Mirabella CHAPTER
Once saved, if the file was zipped you will need to unzip it. For the files that I will be posting you need to change the preferences.
 1 Commands in JMP and Statcrunch Below are a set of commands in JMP and Statcrunch which facilitate a basic statistical analysis. The first part concerns commands in JMP, the second part is for analysis
Come scegliere un test statistico
 Come scegliere un test statistico Estratto dal Capitolo 37 of Intuitive Biostatistics (ISBN 0-19-508607-4) by Harvey Motulsky. Copyright 1995 by Oxfd University Press Inc. (disponibile in Iinternet) Table
MEASURES OF LOCATION AND SPREAD
 Paper TU04 An Overview of Non-parametric Tests in SAS : When, Why, and How Paul A. Pappas and Venita DePuy Durham, North Carolina, USA ABSTRACT Most commonly used statistical procedures are based on the
NAG C Library Chapter Introduction. g08 Nonparametric Statistics
 g08 Nonparametric Statistics Introduction g08 NAG C Library Chapter Introduction g08 Nonparametric Statistics Contents 1 Scope of the Chapter... 2 2 Background to the Problems... 2 2.1 Parametric and Nonparametric
Section 12 Part 2. Chi-square test
 Section 12 Part 2 Chi-square test McNemar s Test Section 12 Part 2 Overview Section 12, Part 1 covered two inference methods for categorical data from 2 groups Confidence Intervals for the difference of
How To Test For Significance On A Data Set
 Non-Parametric Univariate Tests: 1 Sample Sign Test 1 1 SAMPLE SIGN TEST A non-parametric equivalent of the 1 SAMPLE T-TEST. ASSUMPTIONS: Data is non-normally distributed, even after log transforming.
Introduction. Hypothesis Testing. Hypothesis Testing. Significance Testing
 Introduction Hypothesis Testing Mark Lunt Arthritis Research UK Centre for Ecellence in Epidemiology University of Manchester 13/10/2015 We saw last week that we can never know the population parameters
3. Analysis of Qualitative Data
 3. Analysis of Qualitative Data Inferential Stats, CEC at RUPP Poch Bunnak, Ph.D. Content 1. Hypothesis tests about a population proportion: Binomial test 2. Chi-square testt for goodness offitfit 3. Chi-square
Testing Group Differences using T-tests, ANOVA, and Nonparametric Measures
 Testing Group Differences using T-tests, ANOVA, and Nonparametric Measures Jamie DeCoster Department of Psychology University of Alabama 348 Gordon Palmer Hall Box 870348 Tuscaloosa, AL 35487-0348 Phone:
SAS/STAT. 9.2 User s Guide. Introduction to. Nonparametric Analysis. (Book Excerpt) SAS Documentation
 SAS Documentation") SAS/STAT Introduction to 9.2 User s Guide Nonparametric Analysis (Book Excerpt) SAS Documentation This document is an individual chapter from SAS/STAT 9.2 User s Guide. The correct bibliographic citation
SAS/STAT Introduction to 9.2 User s Guide Nonparametric Analysis (Book Excerpt) SAS Documentation This document is an individual chapter from SAS/STAT 9.2 User s Guide. The correct bibliographic citation
Analysis of Questionnaires and Qualitative Data Non-parametric Tests
 Analysis of Questionnaires and Qualitative Data Non-parametric Tests JERZY STEFANOWSKI Instytut Informatyki Politechnika Poznańska Lecture SE 2013, Poznań Recalling Basics Measurment Scales Four scales
Testing differences in proportions
 Testing differences in proportions Murray J Fisher RN, ITU Cert., DipAppSc, BHSc, MHPEd, PhD Senior Lecturer and Director Preregistration Programs Sydney Nursing School (MO2) University of Sydney NSW 2006
INTERPRETING THE ONE-WAY ANALYSIS OF VARIANCE (ANOVA)
") INTERPRETING THE ONE-WAY ANALYSIS OF VARIANCE (ANOVA) As with other parametric statistics, we begin the one-way ANOVA with a test of the underlying assumptions. Our first assumption is the assumption of
INTERPRETING THE ONE-WAY ANALYSIS OF VARIANCE (ANOVA) As with other parametric statistics, we begin the one-way ANOVA with a test of the underlying assumptions. Our first assumption is the assumption of
Nonparametric Statistics
 Nonparametric Statistics References Some good references for the topics in this course are 1. Higgins, James (2004), Introduction to Nonparametric Statistics 2. Hollander and Wolfe, (1999), Nonparametric
Comparing Means in Two Populations
 Comparing Means in Two Populations Overview The previous section discussed hypothesis testing when sampling from a single population (either a single mean or two means from the same population). Now we
Non-Parametric Tests (I)
") Lecture 5: Non-Parametric Tests (I) KimHuat LIM [email protected] http://www.stats.ox.ac.uk/~lim/teaching.html Slide 1 5.1 Outline (i) Overview of Distribution-Free Tests (ii) Median Test for Two Independent
Lecture 5: Non-Parametric Tests (I) KimHuat LIM [email protected] http://www.stats.ox.ac.uk/~lim/teaching.html Slide 1 5.1 Outline (i) Overview of Distribution-Free Tests (ii) Median Test for Two Independent
Bowerman, O'Connell, Aitken Schermer, & Adcock, Business Statistics in Practice, Canadian edition
 Bowerman, O'Connell, Aitken Schermer, & Adcock, Business Statistics in Practice, Canadian edition Online Learning Centre Technology Step-by-Step - Excel Microsoft Excel is a spreadsheet software application
THE FIRST SET OF EXAMPLES USE SUMMARY DATA... EXAMPLE 7.2, PAGE 227 DESCRIBES A PROBLEM AND A HYPOTHESIS TEST IS PERFORMED IN EXAMPLE 7.
 THERE ARE TWO WAYS TO DO HYPOTHESIS TESTING WITH STATCRUNCH: WITH SUMMARY DATA (AS IN EXAMPLE 7.17, PAGE 236, IN ROSNER); WITH THE ORIGINAL DATA (AS IN EXAMPLE 8.5, PAGE 301 IN ROSNER THAT USES DATA FROM
Chapter 2 Probability Topics SPSS T tests
 Chapter 2 Probability Topics SPSS T tests Data file used: gss.sav In the lecture about chapter 2, only the One-Sample T test has been explained. In this handout, we also give the SPSS methods to perform
Principles of Hypothesis Testing for Public Health
 Principles of Hypothesis Testing for Public Health Laura Lee Johnson, Ph.D. Statistician National Center for Complementary and Alternative Medicine [email protected] Fall 2011 Answers to Questions
Guido s Guide to PROC FREQ A Tutorial for Beginners Using the SAS System Joseph J. Guido, University of Rochester Medical Center, Rochester, NY
 Guido s Guide to PROC FREQ A Tutorial for Beginners Using the SAS System Joseph J. Guido, University of Rochester Medical Center, Rochester, NY ABSTRACT PROC FREQ is an essential procedure within BASE
SPSS TUTORIAL & EXERCISE BOOK
 UNIVERSITY OF MISKOLC Faculty of Economics Institute of Business Information and Methods Department of Business Statistics and Economic Forecasting PETRA PETROVICS SPSS TUTORIAL & EXERCISE BOOK FOR BUSINESS
Part 3. Comparing Groups. Chapter 7 Comparing Paired Groups 189. Chapter 8 Comparing Two Independent Groups 217
 Part 3 Comparing Groups Chapter 7 Comparing Paired Groups 189 Chapter 8 Comparing Two Independent Groups 217 Chapter 9 Comparing More Than Two Groups 257 188 Elementary Statistics Using SAS Chapter 7 Comparing
Introduction to Statistics Used in Nursing Research
 Introduction to Statistics Used in Nursing Research Laura P. Kimble, PhD, RN, FNP-C, FAAN Professor and Piedmont Healthcare Endowed Chair in Nursing Georgia Baptist College of Nursing Of Mercer University
ISyE 2028 Basic Statistical Methods - Fall 2015 Bonus Project: Big Data Analytics Final Report: Time spent on social media
 ISyE 2028 Basic Statistical Methods - Fall 2015 Bonus Project: Big Data Analytics Final Report: Time spent on social media Abstract: The growth of social media is astounding and part of that success was
Lesson 1: Comparison of Population Means Part c: Comparison of Two- Means
 Lesson : Comparison of Population Means Part c: Comparison of Two- Means Welcome to lesson c. This third lesson of lesson will discuss hypothesis testing for two independent means. Steps in Hypothesis
Analysis of categorical data: Course quiz instructions for SPSS
 Analysis of categorical data: Course quiz instructions for SPSS The dataset Please download the Online sales dataset from the Download pod in the Course quiz resources screen. The filename is smr_bus_acd_clo_quiz_online_250.xls.
Terminating Sequential Delphi Survey Data Collection
 A peer-reviewed electronic journal. Copyright is retained by the first or sole author, who grants right of first publication to the Practical Assessment, Research & Evaluation. Permission is granted to
Chapter 7 Notes - Inference for Single Samples. You know already for a large sample, you can invoke the CLT so:
 Chapter 7 Notes - Inference for Single Samples You know already for a large sample, you can invoke the CLT so: X N(µ, ). Also for a large sample, you can replace an unknown σ by s. You know how to do a
Statistiek I. Proportions aka Sign Tests. John Nerbonne. CLCG, Rijksuniversiteit Groningen. http://www.let.rug.nl/nerbonne/teach/statistiek-i/
 Statistiek I Proportions aka Sign Tests John Nerbonne CLCG, Rijksuniversiteit Groningen http://www.let.rug.nl/nerbonne/teach/statistiek-i/ John Nerbonne 1/34 Proportions aka Sign Test The relative frequency
Stats Review Chapters 9-10
 Stats Review Chapters 9-10 Created by Teri Johnson Math Coordinator, Mary Stangler Center for Academic Success Examples are taken from Statistics 4 E by Michael Sullivan, III And the corresponding Test
Parametric and Nonparametric: Demystifying the Terms
 Parametric and Nonparametric: Demystifying the Terms By Tanya Hoskin, a statistician in the Mayo Clinic Department of Health Sciences Research who provides consultations through the Mayo Clinic CTSA BERD
UNDERSTANDING THE INDEPENDENT-SAMPLES t TEST
 UNDERSTANDING The independent-samples t test evaluates the difference between the means of two independent or unrelated groups. That is, we evaluate whether the means for two independent groups are significantly
Examining Differences (Comparing Groups) using SPSS Inferential statistics (Part I) Dwayne Devonish
 using SPSS Inferential statistics (Part I) Dwayne Devonish") Examining Differences (Comparing Groups) using SPSS Inferential statistics (Part I) Dwayne Devonish Statistics Statistics are quantitative methods of describing, analysing, and drawing inferences (conclusions)
Examining Differences (Comparing Groups) using SPSS Inferential statistics (Part I) Dwayne Devonish Statistics Statistics are quantitative methods of describing, analysing, and drawing inferences (conclusions)
business statistics using Excel OXFORD UNIVERSITY PRESS Glyn Davis & Branko Pecar
 business statistics using Excel Glyn Davis & Branko Pecar OXFORD UNIVERSITY PRESS Detailed contents Introduction to Microsoft Excel 2003 Overview Learning Objectives 1.1 Introduction to Microsoft Excel
Testing for differences I exercises with SPSS
 Testing for differences I exercises with SPSS Introduction The exercises presented here are all about the t-test and its non-parametric equivalents in their various forms. In SPSS, all these tests can
CHAPTER 14 ORDINAL MEASURES OF CORRELATION: SPEARMAN'S RHO AND GAMMA
 CHAPTER 14 ORDINAL MEASURES OF CORRELATION: SPEARMAN'S RHO AND GAMMA Chapter 13 introduced the concept of correlation statistics and explained the use of Pearson's Correlation Coefficient when working
UNDERSTANDING THE TWO-WAY ANOVA
 UNDERSTANDING THE e have seen how the one-way ANOVA can be used to compare two or more sample means in studies involving a single independent variable. This can be extended to two independent variables
SPSS Guide How-to, Tips, Tricks & Statistical Techniques
 SPSS Guide How-to, Tips, Tricks & Statistical Techniques Support for the course Research Methodology for IB Also useful for your BSc or MSc thesis March 2014 Dr. Marijke Leliveld Jacob Wiebenga, MSc CONTENT
Introduction to Statistics with GraphPad Prism (5.01) Version 1.1
 Version 1.1") Babraham Bioinformatics Introduction to Statistics with GraphPad Prism (5.01) Version 1.1 Introduction to Statistics with GraphPad Prism 2 Licence This manual is 2010-11, Anne Segonds-Pichon. This manual
Babraham Bioinformatics Introduction to Statistics with GraphPad Prism (5.01) Version 1.1 Introduction to Statistics with GraphPad Prism 2 Licence This manual is 2010-11, Anne Segonds-Pichon. This manual
T-test & factor analysis
 Parametric tests T-test & factor analysis Better than non parametric tests Stringent assumptions More strings attached Assumes population distribution of sample is normal Major problem Alternatives Continue
1. What is the critical value for this 95% confidence interval? CV = z.025 = invnorm(0.025) = 1.96
 = 1.96") 1 Final Review 2 Review 2.1 CI 1-propZint Scenario 1 A TV manufacturer claims in its warranty brochure that in the past not more than 10 percent of its TV sets needed any repair during the first two years
1 Final Review 2 Review 2.1 CI 1-propZint Scenario 1 A TV manufacturer claims in its warranty brochure that in the past not more than 10 percent of its TV sets needed any repair during the first two years
Introduction to Statistics and Quantitative Research Methods
 Introduction to Statistics and Quantitative Research Methods Purpose of Presentation To aid in the understanding of basic statistics, including terminology, common terms, and common statistical methods.