Difference tests (2): nonparametric
|
|
|
- Marcus Mitchell
- 9 years ago
- Views:
Transcription
1 NST 1B Experimental Psychology Statistics practical 3 Difference tests (): nonparametric Rudolf Cardinal & Mike Aitken 10 / 11 February 005; Department of Experimental Psychology University of Cambridge Slides at pobox.com/~rudolf/psychology

2 These slides are on the web. No need to scribble frantically. pobox.com/~rudolf/psychology

3 Nonparametric tests Last time, we looked at the t test, a parametric test it made assumptions about parameters of the underlying populations (such as the distribution e.g. assuming that the data are normally distributed). If these assumptions are violated: (a) we could transform the data to fit the assumptions better (NOT covered at Part 1B level) or (b) we could use a nonparametric ( distribution-free ) test that doesn t make the same assumptions. In general, if the assumptions of parametric tests are met, they are the most powerful. If not, we may need to use nonparametric tests. They may, for example, answer questions about medians rather than means. We ll look at some nonparametric tests now that assume only that the data are measured on at least an ordinal scale.

4 The median The median is the value at or below which 50% of the scores fall when the data are arranged in numerical order. (Can also be referred to as the 50 th centile.) If n is odd, it s the middle value (here, 17): If n is even, it s the mean of the two middle values (here, 17.5): the two middle values The median is (17+18) = 17.5

5 The median The median is the value at or below which 50% of the scores fall when the data are arranged in numerical order. (Can also be referred to as the 50 th centile.)

6 Medians are less affected by outliers than means

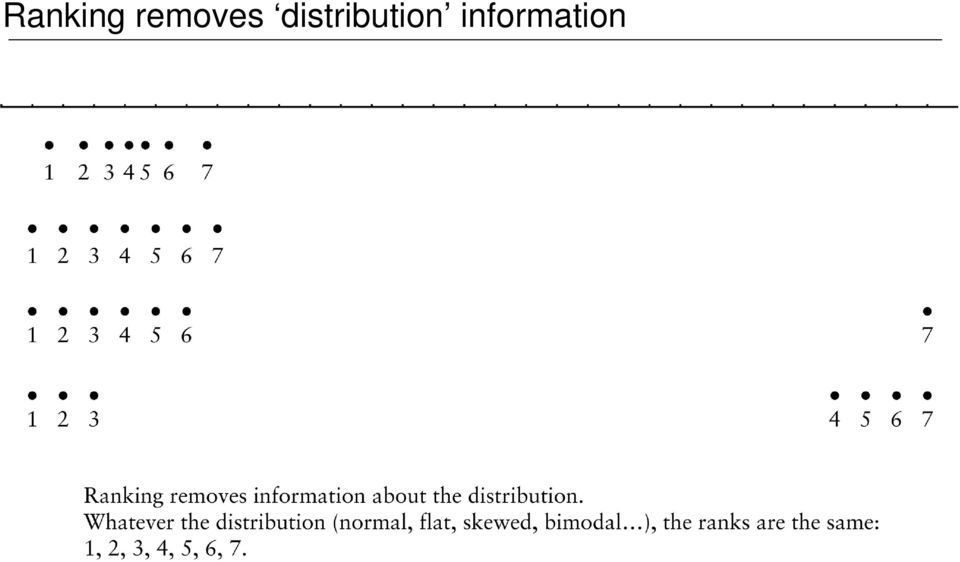
7 Ranking removes distribution information
8 How to rank data Suppose we have ten measurements (e.g. test scores) and want to rank them. First, place them in ascending numerical order: Then start assigning them ranks. When you come to a tie, give each value the mean of the ranks they re tied for for example, the 1s are tied for ranks 4 and 5, so they get the rank 4.5; the 16s are tied for ranks 7, 8, and 9, so they get the rank 8: X: rank:

9 Nonparametric correlation We ve already seen this.

10 r s : Spearman s correlation coefficient for ranked data We met this in the first statistics practical. It s a nonparametric version of correlation. You can use it when you obtain ranked data, or when you want to do significance tests on r but your data are not normally distributed (violating an assumption of the parametric t test that s based on Pearson s r). Rank the X values. Rank the Y values. Correlate the X ranks with the Y ranks. (You do this in the normal way for calculating r, but you call the result r s.) To ask whether the correlation is significant, use the table of critical values of Spearman s r s in the Tables and Formulae booklet.

11 Nonparametric difference tests

12 Two unrelated samples: the Mann Whitney U test Logic Suppose we have two samples with n 1 and n observations in each (for a total of n 1 + n = N observations). We can rank all observations together, from 1 to N. If the two samples come from identical populations, the sum of the ranks of sample 1 scores is likely to be about the same as the sum of the ranks of sample scores. But if sample 1 comes from a population with much lower values than sample, the sum of the ranks of sample 1 scores will generally be lower than the sum of the ranks of sample scores. Null hypothesis: the two samples were drawn from identical populations. [Unlike the unpaired t test, whose null hypothesis was that the two samples came from populations with the same mean.] If we assume the distributions are similar, a significant Mann Whitney test suggests that the medians of the two populations are different.

13 Calculating the Mann Whitney U statistic From the Formula Sheet: Calculating the Mann Whitney U statistic 1. Call the smaller group group 1, and the larger group group, so n 1 < n. (If n 1 = n, ignore this step.). Calculate the sum of the ranks of group 1 (= R 1 ) and group (= R ). 3. n 1 ( n 1 + 1) U1 = R1 4. n ( n + 1) U = R 5. The Mann Whitney statistic U is the smaller of U 1 and U. Check your sums: verify that U 1 + U = n 1 n and ( n1 + n)( n1 + n + 1) R 1 + R =.

14 Mann Whitney U test: EXAMPLE 1 Mothers either received care from first trimester onwards birth weights (in kg): {1.68, 3.83, 3.11,.76, 1.70,.79, 3.05,.66, 1.40,.775} or from the third trimester onwards babies birth weights: {.94, 3.38, 4.90,.81,.80, 3.1, 3.08,.95}. Is there a significant difference between the birthweights of the two groups? Third trimester group smaller, so is group 1 (n 1 = 8). Other is group (n = 10). Ranks for group 1: {10, 16, 18, 9, 8, 15, 13, 11}; rank sum R 1 = 100. Ranks for group : {, 17, 14, 5, 3, 7, 1, 4, 1, 6}; rank sum R = 71. n 1 ( n 1 + 1) 8 9 U1 = R1 = 100 = U n n + 1) ( = R = = U = 16 (the smaller of the two) Check sums: ( n 1 + n )( n 1 U R n + U n 1 n + R + 1) = = 80 = 8 10 = 80 good, they match = = 171 (8 + 10)( ) = = 171 good, they do too

15 Distribution of the Mann Whitney U statistic (if H 0 is true) A discrete (stepwise) distribution, rather than the continuous distributions we ve looked at before.

16 Determining a significance level (p value) from U If n 0, look up the critical value for U in your tables. (The critical value depends on n 1 and n.) If your U is smaller than the critical value, it s significant (you reject the null hypothesis). If n > 0, the tables don t give you critical values, but by this point the U statistic is approximately normally distributed, so we can calculate a Z score from U and test that in the usual way, using tables of Z. The formula for calculating Z from U is on the Formula Sheet. Our example: U = 16, n 1 = 8, n = 10; critical value of U is 18 (from tables). Our U less than this, so birthweight difference was significant (p < 0.05 two-tailed).

17 Mann Whitney U test: EXAMPLE (a) Transfer along a continuum practical (a previous year s data, I m afraid). Different groups of subjects were trained with {1 or 3} blocks of {easy or hard} discriminations before being tested on similar discriminations. Here are the test scores for the 3-block groups (high = good). Is there an effect of training difficulty? You could use either an unpaired t test or a Mann Whitney U test; try the latter.

18 Mann Whitney U test: EXAMPLE (b) U U Both groups same size. Arbitrarily, call the Easy group group 1 (n 1 = 15). Hard group is group (n = 15). Rank sum R 1 = = 9.5 Rank sum R = = 17.5 n n n n + 1) Last year s (003) data + 1) ( n = 17.5 ( = R = Check sums: ( 1 1 = R1 = = 1 + n )( n 1 U R n + U n 1 n + R + 1) = = = = 5 5 = = 465 U = 5.5 (the smaller of the two) Critical U (n 1 = n = 15) for α = 0.05 two-tailed is 65. So significant. ( )( ) = = good, they match 465 good, they do too
 Critical U (n 1 = n = 15) for α = 0.05 two-tailed is 65. So significant.")
19 Time-saving tip If the ranks do not overlap at all, U = 0. Example: U = 0

20 If you find a significant difference If you conduct a Mann Whitney test and find a significant difference, which group had the larger median and which group had the smaller median? Here, U =. Significant (critical U = 3, α = 0.05 two-tailed). Group 1 has a significantly larger median (even though the rank sums convey the opposite impression). You have to calculate the medians. But this is quick.

21 Two related samples: Wilcoxon matched-pairs signed-rank test Logic Suppose we have a set of n paired scores for each subject, say, we have one score from condition 1 and one score from condition. We can calculate the difference score condition 1 condition for each pair. Then we rank the non-zero differences. If, on average, there is no difference between performance in condition 1 and condition, then the sum of the ranks of the positive differences should be about the same as the sum of the ranks of the negative differences. But if there is a difference between condition 1 and condition, the + and rank sums should differ. Null hypothesis: the distribution of differences between the pairs of scores is symmetric about zero. Since the median and mean of a symmetric population are the same, this can be restated as the differences between the pairs of scores are symmetric with a mean and median of zero.
22 Calculating the Wilcoxon T statistic Easy. From the Formula Sheet: Calculating the Wilcoxon matched-pairs signed-rank statistic, T 1. Calculate the difference scores.. Ignore any differences that are zero. 3. Rank the difference scores, ignoring their sign (+ or ). 4. Add up all the ranks for difference scores that were positive; call this T Add up all the ranks for difference scores that were negative; call this T. 6. The Wilcoxon matched-pairs statistic T is the smaller of T + and T. Check your sums: verify that ( +1) + n T T =.
23 Wilcoxon matched-pairs signed-rank test: EXAMPLE 1 Measure blood pressure (BP 1 ). Make subjects run a lot. Measure blood pressure again (BP ) in the same subjects. Has their blood pressure changed? Sum of positive ranks T + = = 7 Sum of negative ranks T = = 9 Wilcoxon T = the smaller of T + and T = 9. And n = 8. Check sums: T + n+ T = = 36 n( + 1) 8 9 = = 36 good, they match
24 Distribution of the Wilcoxon T statistic (if H 0 is true)
25 Determining a significance level (p value) from T If n 5, look up the critical value for T in your tables. (The critical value depends on n.) If your T is smaller than the critical value, it s significant (you reject the null hypothesis). If n > 5, the tables don t give you critical values, but by this point the T statistic is approximately normally distributed, so we can calculate a Z score from T and test that in the usual way, using tables of Z. The formula for calculating Z from T is on the Formula Sheet. In our example, T = 9 and n = 8. Critical value of T is 4 (for α = 0.05 two-tailed); since our T is not smaller than this, the BP difference was not significant.
26 Wilcoxon matched-pairs signed-rank test: EXAMPLE (a) Proactive interference practical (subset of a previous year s data, I m afraid). Subjects hear and repeat trigram (e.g. CXJ), perform distractor task, recall trigram. Compare trials 9 & 10 (after many similar trigrams) with trials 11 & 1 (after shift to new type of trigram, e.g. 95). Is there release from proactive interference? Note very non-normal difference scores; parametric test unsuitable.
27 Wilcoxon matched-pairs signed-rank test: EXAMPLE (b) Sum of positive ranks T + = (4 8) = 3 Sum of negative ranks T = (4 17.5) + (11 8) = 158 Wilcoxon T = the smaller of T + and T = 3. And n = 19. Check sums: Last year s (003) data T n( + n+ T + 1) = = = = 190 good, they match From our tables, for n = 19 and α = 0.05 two-tailed, the critical value of T is 47. Our T is smaller, so the difference is significant. (In fact, it s significant at α = 0.01 two-tailed.) Subjects did better on trials 11 & 1 than on trials 9 & 10.
28 One sample: Wilcoxon signed-rank test with only one sample Very easy. Null hypothesis: the median is equal to M. For each score x, calculate a difference score (x M). Then proceed as for the two-sample Wilcoxon test using these difference scores. (Logic: if the median is M, then the sum of the ranks of the positive differences from scores where x > M should be the same as the sum of the ranks of the negative differences from scores where x < M. If the median isn t M, then the two rank sums should differ.)
29 Comparison of parametric and non-parametric tests Parametric test Two-sample unpaired t test Two-sample paired t test One-sample t test Equivalent nonparametric test Mann Whitney U test Wilcoxon signed-rank test with matched pairs Wilcoxon signed-rank test, pairing data with a fixed value
30
NONPARAMETRIC STATISTICS 1. depend on assumptions about the underlying distribution of the data (or on the Central Limit Theorem)
") NONPARAMETRIC STATISTICS 1 PREVIOUSLY parametric statistics in estimation and hypothesis testing... construction of confidence intervals computing of p-values classical significance testing depend on assumptions
NONPARAMETRIC STATISTICS 1 PREVIOUSLY parametric statistics in estimation and hypothesis testing... construction of confidence intervals computing of p-values classical significance testing depend on assumptions
Non-Parametric Tests (I)
") Lecture 5: Non-Parametric Tests (I) KimHuat LIM [email protected] http://www.stats.ox.ac.uk/~lim/teaching.html Slide 1 5.1 Outline (i) Overview of Distribution-Free Tests (ii) Median Test for Two Independent
Lecture 5: Non-Parametric Tests (I) KimHuat LIM [email protected] http://www.stats.ox.ac.uk/~lim/teaching.html Slide 1 5.1 Outline (i) Overview of Distribution-Free Tests (ii) Median Test for Two Independent
QUANTITATIVE METHODS BIOLOGY FINAL HONOUR SCHOOL NON-PARAMETRIC TESTS
 QUANTITATIVE METHODS BIOLOGY FINAL HONOUR SCHOOL NON-PARAMETRIC TESTS This booklet contains lecture notes for the nonparametric work in the QM course. This booklet may be online at http://users.ox.ac.uk/~grafen/qmnotes/index.html.
II. DISTRIBUTIONS distribution normal distribution. standard scores
 Appendix D Basic Measurement And Statistics The following information was developed by Steven Rothke, PhD, Department of Psychology, Rehabilitation Institute of Chicago (RIC) and expanded by Mary F. Schmidt,
EPS 625 INTERMEDIATE STATISTICS FRIEDMAN TEST
 EPS 625 INTERMEDIATE STATISTICS The Friedman test is an extension of the Wilcoxon test. The Wilcoxon test can be applied to repeated-measures data if participants are assessed on two occasions or conditions
Nonparametric tests these test hypotheses that are not statements about population parameters (e.g.,
 CHAPTER 13 Nonparametric and Distribution-Free Statistics Nonparametric tests these test hypotheses that are not statements about population parameters (e.g., 2 tests for goodness of fit and independence).
Statistical tests for SPSS
 Statistical tests for SPSS Paolo Coletti A.Y. 2010/11 Free University of Bolzano Bozen Premise This book is a very quick, rough and fast description of statistical tests and their usage. It is explicitly
Chapter G08 Nonparametric Statistics
 G08 Nonparametric Statistics Chapter G08 Nonparametric Statistics Contents 1 Scope of the Chapter 2 2 Background to the Problems 2 2.1 Parametric and Nonparametric Hypothesis Testing......................
Tutorial 5: Hypothesis Testing
 Tutorial 5: Hypothesis Testing Rob Nicholls [email protected] MRC LMB Statistics Course 2014 Contents 1 Introduction................................ 1 2 Testing distributional assumptions....................
1 Nonparametric Statistics
 1 Nonparametric Statistics When finding confidence intervals or conducting tests so far, we always described the population with a model, which includes a set of parameters. Then we could make decisions
Comparing Means in Two Populations
 Comparing Means in Two Populations Overview The previous section discussed hypothesis testing when sampling from a single population (either a single mean or two means from the same population). Now we
Rank-Based Non-Parametric Tests
 Rank-Based Non-Parametric Tests Reminder: Student Instructional Rating Surveys You have until May 8 th to fill out the student instructional rating surveys at https://sakai.rutgers.edu/portal/site/sirs
Nonparametric Two-Sample Tests. Nonparametric Tests. Sign Test
 Nonparametric Two-Sample Tests Sign test Mann-Whitney U-test (a.k.a. Wilcoxon two-sample test) Kolmogorov-Smirnov Test Wilcoxon Signed-Rank Test Tukey-Duckworth Test 1 Nonparametric Tests Recall, nonparametric
UNIVERSITY OF NAIROBI
 UNIVERSITY OF NAIROBI MASTERS IN PROJECT PLANNING AND MANAGEMENT NAME: SARU CAROLYNN ELIZABETH REGISTRATION NO: L50/61646/2013 COURSE CODE: LDP 603 COURSE TITLE: RESEARCH METHODS LECTURER: GAKUU CHRISTOPHER
CHAPTER 14 ORDINAL MEASURES OF CORRELATION: SPEARMAN'S RHO AND GAMMA
 CHAPTER 14 ORDINAL MEASURES OF CORRELATION: SPEARMAN'S RHO AND GAMMA Chapter 13 introduced the concept of correlation statistics and explained the use of Pearson's Correlation Coefficient when working
Nonparametric statistics and model selection
 Chapter 5 Nonparametric statistics and model selection In Chapter, we learned about the t-test and its variations. These were designed to compare sample means, and relied heavily on assumptions of normality.
Using Excel for inferential statistics
 FACT SHEET Using Excel for inferential statistics Introduction When you collect data, you expect a certain amount of variation, just caused by chance. A wide variety of statistical tests can be applied
NAG C Library Chapter Introduction. g08 Nonparametric Statistics
 g08 Nonparametric Statistics Introduction g08 NAG C Library Chapter Introduction g08 Nonparametric Statistics Contents 1 Scope of the Chapter... 2 2 Background to the Problems... 2 2.1 Parametric and Nonparametric
Parametric and Nonparametric: Demystifying the Terms
 Parametric and Nonparametric: Demystifying the Terms By Tanya Hoskin, a statistician in the Mayo Clinic Department of Health Sciences Research who provides consultations through the Mayo Clinic CTSA BERD
CHAPTER 14 NONPARAMETRIC TESTS
 CHAPTER 14 NONPARAMETRIC TESTS Everything that we have done up until now in statistics has relied heavily on one major fact: that our data is normally distributed. We have been able to make inferences
Skewed Data and Non-parametric Methods
 0 2 4 6 8 10 12 14 Skewed Data and Non-parametric Methods Comparing two groups: t-test assumes data are: 1. Normally distributed, and 2. both samples have the same SD (i.e. one sample is simply shifted
Sample Size and Power in Clinical Trials
 Sample Size and Power in Clinical Trials Version 1.0 May 011 1. Power of a Test. Factors affecting Power 3. Required Sample Size RELATED ISSUES 1. Effect Size. Test Statistics 3. Variation 4. Significance
Descriptive Statistics
 Descriptive Statistics Primer Descriptive statistics Central tendency Variation Relative position Relationships Calculating descriptive statistics Descriptive Statistics Purpose to describe or summarize
Come scegliere un test statistico
 Come scegliere un test statistico Estratto dal Capitolo 37 of Intuitive Biostatistics (ISBN 0-19-508607-4) by Harvey Motulsky. Copyright 1995 by Oxfd University Press Inc. (disponibile in Iinternet) Table
Overview of Non-Parametric Statistics PRESENTER: ELAINE EISENBEISZ OWNER AND PRINCIPAL, OMEGA STATISTICS
 Overview of Non-Parametric Statistics PRESENTER: ELAINE EISENBEISZ OWNER AND PRINCIPAL, OMEGA STATISTICS About Omega Statistics Private practice consultancy based in Southern California, Medical and Clinical
Research Methodology: Tools
 MSc Business Administration Research Methodology: Tools Applied Data Analysis (with SPSS) Lecture 11: Nonparametric Methods May 2014 Prof. Dr. Jürg Schwarz Lic. phil. Heidi Bruderer Enzler Contents Slide
THE KRUSKAL WALLLIS TEST
 THE KRUSKAL WALLLIS TEST TEODORA H. MEHOTCHEVA Wednesday, 23 rd April 08 THE KRUSKAL-WALLIS TEST: The non-parametric alternative to ANOVA: testing for difference between several independent groups 2 NON
Paired T-Test. Chapter 208. Introduction. Technical Details. Research Questions
 Chapter 208 Introduction This procedure provides several reports for making inference about the difference between two population means based on a paired sample. These reports include confidence intervals
SPSS Explore procedure
 SPSS Explore procedure One useful function in SPSS is the Explore procedure, which will produce histograms, boxplots, stem-and-leaf plots and extensive descriptive statistics. To run the Explore procedure,
Nonparametric and Distribution- Free Statistical Tests
 20 Nonparametric and Distribution- Free Statistical Tests Concepts that you will need to remember from previous chapters SS total, SS group, SS error : Sums of squares of all scores, of group means, and
Study Guide for the Final Exam
 Study Guide for the Final Exam When studying, remember that the computational portion of the exam will only involve new material (covered after the second midterm), that material from Exam 1 will make
Testing for differences I exercises with SPSS
 Testing for differences I exercises with SPSS Introduction The exercises presented here are all about the t-test and its non-parametric equivalents in their various forms. In SPSS, all these tests can
Nonparametric Statistics
 Nonparametric Statistics J. Lozano University of Goettingen Department of Genetic Epidemiology Interdisciplinary PhD Program in Applied Statistics & Empirical Methods Graduate Seminar in Applied Statistics
MEASURES OF LOCATION AND SPREAD
 Paper TU04 An Overview of Non-parametric Tests in SAS : When, Why, and How Paul A. Pappas and Venita DePuy Durham, North Carolina, USA ABSTRACT Most commonly used statistical procedures are based on the
Statistics for Sports Medicine
 Statistics for Sports Medicine Suzanne Hecht, MD University of Minnesota ([email protected]) Fellow s Research Conference July 2012: Philadelphia GOALS Try not to bore you to death!! Try to teach
Post-hoc comparisons & two-way analysis of variance. Two-way ANOVA, II. Post-hoc testing for main effects. Post-hoc testing 9.
 Two-way ANOVA, II Post-hoc comparisons & two-way analysis of variance 9.7 4/9/4 Post-hoc testing As before, you can perform post-hoc tests whenever there s a significant F But don t bother if it s a main
UNDERSTANDING THE DEPENDENT-SAMPLES t TEST
 UNDERSTANDING THE DEPENDENT-SAMPLES t TEST A dependent-samples t test (a.k.a. matched or paired-samples, matched-pairs, samples, or subjects, simple repeated-measures or within-groups, or correlated groups)
Chapter 12 Nonparametric Tests. Chapter Table of Contents
 Chapter 12 Nonparametric Tests Chapter Table of Contents OVERVIEW...171 Testing for Normality...... 171 Comparing Distributions....171 ONE-SAMPLE TESTS...172 TWO-SAMPLE TESTS...172 ComparingTwoIndependentSamples...172
Nonparametric Statistics
 Nonparametric Statistics References Some good references for the topics in this course are 1. Higgins, James (2004), Introduction to Nonparametric Statistics 2. Hollander and Wolfe, (1999), Nonparametric
StatCrunch and Nonparametric Statistics
 StatCrunch and Nonparametric Statistics You can use StatCrunch to calculate the values of nonparametric statistics. It may not be obvious how to enter the data in StatCrunch for various data sets that
The Wilcoxon Rank-Sum Test
 1 The Wilcoxon Rank-Sum Test The Wilcoxon rank-sum test is a nonparametric alternative to the twosample t-test which is based solely on the order in which the observations from the two samples fall. We
Two-Sample T-Tests Assuming Equal Variance (Enter Means)
") Chapter 4 Two-Sample T-Tests Assuming Equal Variance (Enter Means) Introduction This procedure provides sample size and power calculations for one- or two-sided two-sample t-tests when the variances of
Chapter 4 Two-Sample T-Tests Assuming Equal Variance (Enter Means) Introduction This procedure provides sample size and power calculations for one- or two-sided two-sample t-tests when the variances of
Non-Inferiority Tests for Two Means using Differences
 Chapter 450 on-inferiority Tests for Two Means using Differences Introduction This procedure computes power and sample size for non-inferiority tests in two-sample designs in which the outcome is a continuous
NCSS Statistical Software
 Chapter 06 Introduction This procedure provides several reports for the comparison of two distributions, including confidence intervals for the difference in means, two-sample t-tests, the z-test, the
Two-Sample T-Tests Allowing Unequal Variance (Enter Difference)
") Chapter 45 Two-Sample T-Tests Allowing Unequal Variance (Enter Difference) Introduction This procedure provides sample size and power calculations for one- or two-sided two-sample t-tests when no assumption
Chapter 45 Two-Sample T-Tests Allowing Unequal Variance (Enter Difference) Introduction This procedure provides sample size and power calculations for one- or two-sided two-sample t-tests when no assumption
INTERPRETING THE ONE-WAY ANALYSIS OF VARIANCE (ANOVA)
") INTERPRETING THE ONE-WAY ANALYSIS OF VARIANCE (ANOVA) As with other parametric statistics, we begin the one-way ANOVA with a test of the underlying assumptions. Our first assumption is the assumption of
INTERPRETING THE ONE-WAY ANALYSIS OF VARIANCE (ANOVA) As with other parametric statistics, we begin the one-way ANOVA with a test of the underlying assumptions. Our first assumption is the assumption of
Permutation Tests for Comparing Two Populations
 Permutation Tests for Comparing Two Populations Ferry Butar Butar, Ph.D. Jae-Wan Park Abstract Permutation tests for comparing two populations could be widely used in practice because of flexibility of
Testing Group Differences using T-tests, ANOVA, and Nonparametric Measures
 Testing Group Differences using T-tests, ANOVA, and Nonparametric Measures Jamie DeCoster Department of Psychology University of Alabama 348 Gordon Palmer Hall Box 870348 Tuscaloosa, AL 35487-0348 Phone:
Outline. Definitions Descriptive vs. Inferential Statistics The t-test - One-sample t-test
 The t-test Outline Definitions Descriptive vs. Inferential Statistics The t-test - One-sample t-test - Dependent (related) groups t-test - Independent (unrelated) groups t-test Comparing means Correlation
DATA INTERPRETATION AND STATISTICS
 PholC60 September 001 DATA INTERPRETATION AND STATISTICS Books A easy and systematic introductory text is Essentials of Medical Statistics by Betty Kirkwood, published by Blackwell at about 14. DESCRIPTIVE
Non-Inferiority Tests for One Mean
 Chapter 45 Non-Inferiority ests for One Mean Introduction his module computes power and sample size for non-inferiority tests in one-sample designs in which the outcome is distributed as a normal random
Analysis of Variance ANOVA
 Analysis of Variance ANOVA Overview We ve used the t -test to compare the means from two independent groups. Now we ve come to the final topic of the course: how to compare means from more than two populations.
NCSS Statistical Software. One-Sample T-Test
 Chapter 205 Introduction This procedure provides several reports for making inference about a population mean based on a single sample. These reports include confidence intervals of the mean or median,
Chapter 8 Hypothesis Testing Chapter 8 Hypothesis Testing 8-1 Overview 8-2 Basics of Hypothesis Testing
 Chapter 8 Hypothesis Testing 1 Chapter 8 Hypothesis Testing 8-1 Overview 8-2 Basics of Hypothesis Testing 8-3 Testing a Claim About a Proportion 8-5 Testing a Claim About a Mean: s Not Known 8-6 Testing
Types of Data, Descriptive Statistics, and Statistical Tests for Nominal Data. Patrick F. Smith, Pharm.D. University at Buffalo Buffalo, New York
 Types of Data, Descriptive Statistics, and Statistical Tests for Nominal Data Patrick F. Smith, Pharm.D. University at Buffalo Buffalo, New York . NONPARAMETRIC STATISTICS I. DEFINITIONS A. Parametric
Stat 5102 Notes: Nonparametric Tests and. confidence interval
 Stat 510 Notes: Nonparametric Tests and Confidence Intervals Charles J. Geyer April 13, 003 This handout gives a brief introduction to nonparametrics, which is what you do when you don t believe the assumptions
Section 14 Simple Linear Regression: Introduction to Least Squares Regression
 Slide 1 Section 14 Simple Linear Regression: Introduction to Least Squares Regression There are several different measures of statistical association used for understanding the quantitative relationship
Independent samples t-test. Dr. Tom Pierce Radford University
 Independent samples t-test Dr. Tom Pierce Radford University The logic behind drawing causal conclusions from experiments The sampling distribution of the difference between means The standard error of
Biostatistics: Types of Data Analysis
 Biostatistics: Types of Data Analysis Theresa A Scott, MS Vanderbilt University Department of Biostatistics [email protected] http://biostat.mc.vanderbilt.edu/theresascott Theresa A Scott, MS
Part 3. Comparing Groups. Chapter 7 Comparing Paired Groups 189. Chapter 8 Comparing Two Independent Groups 217
 Part 3 Comparing Groups Chapter 7 Comparing Paired Groups 189 Chapter 8 Comparing Two Independent Groups 217 Chapter 9 Comparing More Than Two Groups 257 188 Elementary Statistics Using SAS Chapter 7 Comparing
Section 3 Part 1. Relationships between two numerical variables
 Section 3 Part 1 Relationships between two numerical variables 1 Relationship between two variables The summary statistics covered in the previous lessons are appropriate for describing a single variable.
Point Biserial Correlation Tests
 Chapter 807 Point Biserial Correlation Tests Introduction The point biserial correlation coefficient (ρ in this chapter) is the product-moment correlation calculated between a continuous random variable
Objective. Materials. TI-73 Calculator
 0. Objective To explore subtraction of integers using a number line. Activity 2 To develop strategies for subtracting integers. Materials TI-73 Calculator Integer Subtraction What s the Difference? Teacher
The Statistics Tutor s Quick Guide to
 statstutor community project encouraging academics to share statistics support resources All stcp resources are released under a Creative Commons licence The Statistics Tutor s Quick Guide to Stcp-marshallowen-7
Statistics. One-two sided test, Parametric and non-parametric test statistics: one group, two groups, and more than two groups samples
 Statistics One-two sided test, Parametric and non-parametric test statistics: one group, two groups, and more than two groups samples February 3, 00 Jobayer Hossain, Ph.D. & Tim Bunnell, Ph.D. Nemours
THE FIRST SET OF EXAMPLES USE SUMMARY DATA... EXAMPLE 7.2, PAGE 227 DESCRIBES A PROBLEM AND A HYPOTHESIS TEST IS PERFORMED IN EXAMPLE 7.
 THERE ARE TWO WAYS TO DO HYPOTHESIS TESTING WITH STATCRUNCH: WITH SUMMARY DATA (AS IN EXAMPLE 7.17, PAGE 236, IN ROSNER); WITH THE ORIGINAL DATA (AS IN EXAMPLE 8.5, PAGE 301 IN ROSNER THAT USES DATA FROM
Unit 31 A Hypothesis Test about Correlation and Slope in a Simple Linear Regression
 Unit 31 A Hypothesis Test about Correlation and Slope in a Simple Linear Regression Objectives: To perform a hypothesis test concerning the slope of a least squares line To recognize that testing for a
HYPOTHESIS TESTING: POWER OF THE TEST
 HYPOTHESIS TESTING: POWER OF THE TEST The first 6 steps of the 9-step test of hypothesis are called "the test". These steps are not dependent on the observed data values. When planning a research project,
Introduction. Hypothesis Testing. Hypothesis Testing. Significance Testing
 Introduction Hypothesis Testing Mark Lunt Arthritis Research UK Centre for Ecellence in Epidemiology University of Manchester 13/10/2015 We saw last week that we can never know the population parameters
NCSS Statistical Software
 Chapter 06 Introduction This procedure provides several reports for the comparison of two distributions, including confidence intervals for the difference in means, two-sample t-tests, the z-test, the
Introduction to. Hypothesis Testing CHAPTER LEARNING OBJECTIVES. 1 Identify the four steps of hypothesis testing.
 Introduction to Hypothesis Testing CHAPTER 8 LEARNING OBJECTIVES After reading this chapter, you should be able to: 1 Identify the four steps of hypothesis testing. 2 Define null hypothesis, alternative
Part 2: Analysis of Relationship Between Two Variables
 Part 2: Analysis of Relationship Between Two Variables Linear Regression Linear correlation Significance Tests Multiple regression Linear Regression Y = a X + b Dependent Variable Independent Variable
Bivariate Statistics Session 2: Measuring Associations Chi-Square Test
 Bivariate Statistics Session 2: Measuring Associations Chi-Square Test Features Of The Chi-Square Statistic The chi-square test is non-parametric. That is, it makes no assumptions about the distribution
Introduction to Hypothesis Testing. Hypothesis Testing. Step 1: State the Hypotheses
 Introduction to Hypothesis Testing 1 Hypothesis Testing A hypothesis test is a statistical procedure that uses sample data to evaluate a hypothesis about a population Hypothesis is stated in terms of the
The Dummy s Guide to Data Analysis Using SPSS
 The Dummy s Guide to Data Analysis Using SPSS Mathematics 57 Scripps College Amy Gamble April, 2001 Amy Gamble 4/30/01 All Rights Rerserved TABLE OF CONTENTS PAGE Helpful Hints for All Tests...1 Tests
Nonparametric Tests. Chi-Square Test for Independence
 DDBA 8438: Nonparametric Statistics: The Chi-Square Test Video Podcast Transcript JENNIFER ANN MORROW: Welcome to "Nonparametric Statistics: The Chi-Square Test." My name is Dr. Jennifer Ann Morrow. In
SAS/STAT. 9.2 User s Guide. Introduction to. Nonparametric Analysis. (Book Excerpt) SAS Documentation
 SAS Documentation") SAS/STAT Introduction to 9.2 User s Guide Nonparametric Analysis (Book Excerpt) SAS Documentation This document is an individual chapter from SAS/STAT 9.2 User s Guide. The correct bibliographic citation
SAS/STAT Introduction to 9.2 User s Guide Nonparametric Analysis (Book Excerpt) SAS Documentation This document is an individual chapter from SAS/STAT 9.2 User s Guide. The correct bibliographic citation
X X X a) perfect linear correlation b) no correlation c) positive correlation (r = 1) (r = 0) (0 < r < 1)
 perfect linear correlation b) no correlation c) positive correlation (r = 1) (r = 0) (0 < r < 1)") CORRELATION AND REGRESSION / 47 CHAPTER EIGHT CORRELATION AND REGRESSION Correlation and regression are statistical methods that are commonly used in the medical literature to compare two or more variables.
CORRELATION AND REGRESSION / 47 CHAPTER EIGHT CORRELATION AND REGRESSION Correlation and regression are statistical methods that are commonly used in the medical literature to compare two or more variables.
Analyzing Data with GraphPad Prism
 1999 GraphPad Software, Inc. All rights reserved. All Rights Reserved. GraphPad Prism, Prism and InStat are registered trademarks of GraphPad Software, Inc. GraphPad is a trademark of GraphPad Software,
Projects Involving Statistics (& SPSS)
") Projects Involving Statistics (& SPSS) Academic Skills Advice Starting a project which involves using statistics can feel confusing as there seems to be many different things you can do (charts, graphs,
Projects Involving Statistics (& SPSS) Academic Skills Advice Starting a project which involves using statistics can feel confusing as there seems to be many different things you can do (charts, graphs,
Analysis of Data. Organizing Data Files in SPSS. Descriptive Statistics
 Analysis of Data Claudia J. Stanny PSY 67 Research Design Organizing Data Files in SPSS All data for one subject entered on the same line Identification data Between-subjects manipulations: variable to
UNDERSTANDING THE TWO-WAY ANOVA
 UNDERSTANDING THE e have seen how the one-way ANOVA can be used to compare two or more sample means in studies involving a single independent variable. This can be extended to two independent variables
Recall this chart that showed how most of our course would be organized:
 Chapter 4 One-Way ANOVA Recall this chart that showed how most of our course would be organized: Explanatory Variable(s) Response Variable Methods Categorical Categorical Contingency Tables Categorical
Introduction to Quantitative Methods
 Introduction to Quantitative Methods October 15, 2009 Contents 1 Definition of Key Terms 2 2 Descriptive Statistics 3 2.1 Frequency Tables......................... 4 2.2 Measures of Central Tendencies.................
13: Additional ANOVA Topics. Post hoc Comparisons
 13: Additional ANOVA Topics Post hoc Comparisons ANOVA Assumptions Assessing Group Variances When Distributional Assumptions are Severely Violated Kruskal-Wallis Test Post hoc Comparisons In the prior
1.6 The Order of Operations
 1.6 The Order of Operations Contents: Operations Grouping Symbols The Order of Operations Exponents and Negative Numbers Negative Square Roots Square Root of a Negative Number Order of Operations and Negative
CHAPTER 12 TESTING DIFFERENCES WITH ORDINAL DATA: MANN WHITNEY U
 CHAPTER 12 TESTING DIFFERENCES WITH ORDINAL DATA: MANN WHITNEY U Previous chapters of this text have explained the procedures used to test hypotheses using interval data (t-tests and ANOVA s) and nominal
MULTIPLE REGRESSION AND ISSUES IN REGRESSION ANALYSIS
 MULTIPLE REGRESSION AND ISSUES IN REGRESSION ANALYSIS MSR = Mean Regression Sum of Squares MSE = Mean Squared Error RSS = Regression Sum of Squares SSE = Sum of Squared Errors/Residuals α = Level of Significance
How To Test For Significance On A Data Set
 Non-Parametric Univariate Tests: 1 Sample Sign Test 1 1 SAMPLE SIGN TEST A non-parametric equivalent of the 1 SAMPLE T-TEST. ASSUMPTIONS: Data is non-normally distributed, even after log transforming.
Additional sources Compilation of sources: http://lrs.ed.uiuc.edu/tseportal/datacollectionmethodologies/jin-tselink/tselink.htm
 Mgt 540 Research Methods Data Analysis 1 Additional sources Compilation of sources: http://lrs.ed.uiuc.edu/tseportal/datacollectionmethodologies/jin-tselink/tselink.htm http://web.utk.edu/~dap/random/order/start.htm
3.4 Statistical inference for 2 populations based on two samples
 3.4 Statistical inference for 2 populations based on two samples Tests for a difference between two population means The first sample will be denoted as X 1, X 2,..., X m. The second sample will be denoted
Correlation Coefficient The correlation coefficient is a summary statistic that describes the linear relationship between two numerical variables 2
 Lesson 4 Part 1 Relationships between two numerical variables 1 Correlation Coefficient The correlation coefficient is a summary statistic that describes the linear relationship between two numerical variables
t Tests in Excel The Excel Statistical Master By Mark Harmon Copyright 2011 Mark Harmon
 t-tests in Excel By Mark Harmon Copyright 2011 Mark Harmon No part of this publication may be reproduced or distributed without the express permission of the author. [email protected] www.excelmasterseries.com
Analysis of Questionnaires and Qualitative Data Non-parametric Tests
 Analysis of Questionnaires and Qualitative Data Non-parametric Tests JERZY STEFANOWSKI Instytut Informatyki Politechnika Poznańska Lecture SE 2013, Poznań Recalling Basics Measurment Scales Four scales
5.1 Radical Notation and Rational Exponents
 Section 5.1 Radical Notation and Rational Exponents 1 5.1 Radical Notation and Rational Exponents We now review how exponents can be used to describe not only powers (such as 5 2 and 2 3 ), but also roots
WRITING PROOFS. Christopher Heil Georgia Institute of Technology
 WRITING PROOFS Christopher Heil Georgia Institute of Technology A theorem is just a statement of fact A proof of the theorem is a logical explanation of why the theorem is true Many theorems have this
Simple Regression Theory II 2010 Samuel L. Baker
 SIMPLE REGRESSION THEORY II 1 Simple Regression Theory II 2010 Samuel L. Baker Assessing how good the regression equation is likely to be Assignment 1A gets into drawing inferences about how close the