Evaluation of surface runoff conditions. scanner in an intensive apple orchard
|
|
|
- Barbra Shields
- 9 years ago
- Views:
Transcription
1 Evaluation of surface runoff conditions by high resolution terrestrial laser scanner in an intensive apple orchard János Tamás 1, Péter Riczu 1, Attila Nagy 1, Éva Lehoczky 2 1 Faculty of Agricultural and Food Sciences and Environmental Management, Institute of Water and Environmental Management, University of Debrecen, Debrecen, Hungary 2 Institute for Soil Sciences and Agricultural Chemistry, Center for Agricultural Research, Hungarian Academy of Sciences, Budapest, Hungary SWAT SESSION K4: URBAN PROCESSES AND MANAGEMENT / HYDROLOGY
2 Introduction Rapid population growth and the overuse of natural resources that substantially occurred in the second half of twentieth century have degraded the global environment significantly. The main goal for sustainable urban water systems to control, collection, conveyance, and quality improvement of urban runoff in order to protect the urban environment from flooding, drought and pollution Elevation data are a critical element in any geoscience application. On lowland area, where relief slope is minimal value, is much more difficult to delineate urban and suburban watershed to characterize runoff process.
3 Research goals To evaluate different land use impacts on runoff pattern To compare different data sources derivated from different laser scanning platform (ground, mobile, airborne) To elaborate an effective process flow for object segmentation of point clouds Study area Debrecen city, Hungary
4 Methods - Reference Sites
5 The Tisza River Basin is the largest sub-basin in the Danube River Basin, covering 157,186 km² (19.5%) of the Danube Basin Study area- Intensive orchard Ground laser


6 UNIVERSITY OF DEBRECEN Study and Regional Research Farm, Pallag Legend FRUIT TREES Apple Sweet cherry Japanese plum Apricot Cherry Plum Peach
7 Material and methods Leica ScanStation C10 3D laser scanner Soil penetrometer +


8 Used software: Surveying GIS - Hydrology

9 Microrelief investigation of the apple plantation


10 Deriving Hydrologically Useful Information from Digital Elevation Models Raw DEM Pit Removal Flow Field Flow Related Terrain Information
 48 56 Representation of Flow Field Steepest single direction 52 67 Proportion flowing to neighboring grid cell 4 is 1 /( 1 + 2 ) 4 5 2 1 Steepest direction downslope Proportion flowing to")
11 Tarboton, D. G., (1997), "A New Method for the Determination of Flow Directions and Contributing Areas in Grid Digital Elevation Models," Water Resources Research, 33(2): ) Representation of Flow Field Steepest single direction Proportion flowing to neighboring grid cell 4 is 1 /( ) Steepest direction downslope Proportion flowing to neighboring grid cell 3 is 2 /( ) 3 2 Flow direction D8 D 6 7 8
12 Elevation (m) Magasság (mbf) 128,65 Mechanical compaction zone by wheel 128,6 128,55 Tyre lug 0 0,5 1 1,5 2 2,5 Távolság (m) Distance (m)


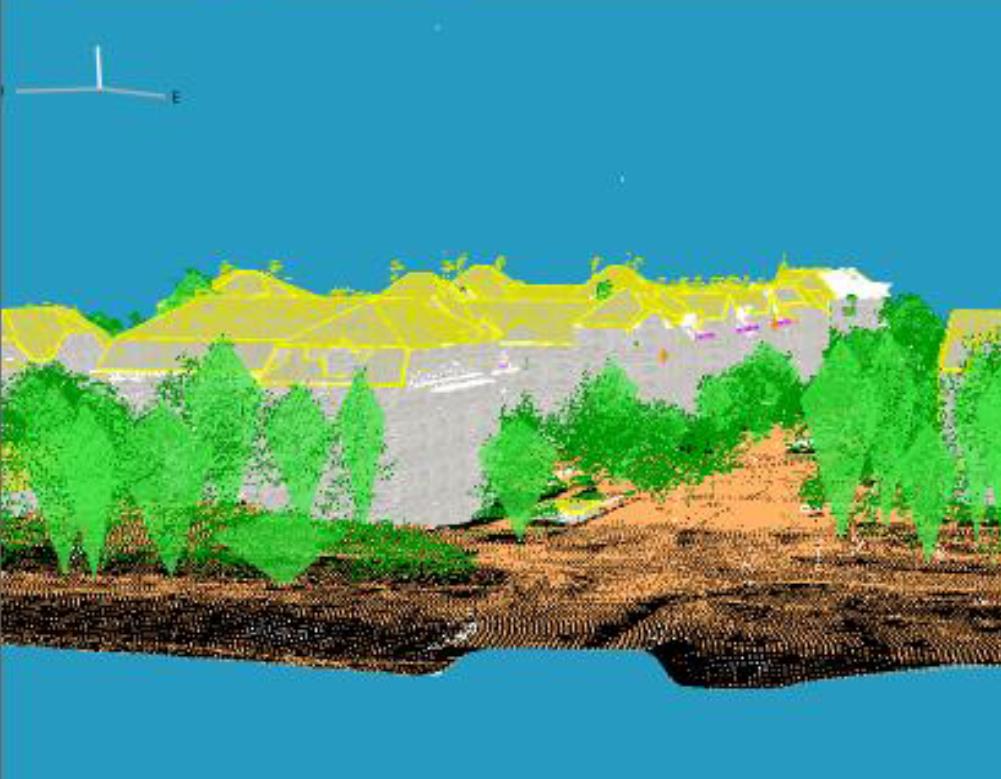
13 Vegetation Point clouds TIN- Raster Range: 20 m, Accurancy 0,2 mm; Measuring time: min Tamás, J. et al Airborne hyperspectral and LiDAR data integration for weed detection, EGU. Wien OTKA project K


14 Soil surface moisture investigations 100% 0% 2% 4% 6% 8% 10% 12% 14% 16% 18% 20% 22% 24% 26% 28% 30% 32% Real reflectance values (%)


15 Frequency (%) Soil surface moisture conditions of the 09/03/2012 surveying Laser intensity values Moisture caretories 40% 35% 30% 25% 20% 15% 10% 5% 0% 1.62% 3.99% 14.54% 35.45% 37.31% 5.99% 0.92% 0.16% Soil surface moisture content (m/m%)


16 GreenSeeker 505 vegetation indexmeter Sensor signal NDVI NIR RED 774nm 656nm RED NIR 656nm 774nm Reflected Internal light Emitted RED NIR

17 Investigation of Weed coverage of the apple plantation 26/03/ /04/ /05/ /05/ /07/ /08/ /08/ /10/2014 Time Series Data sources - Vegetation NDVI color scale

18 26/03/ /04/ /05/ /05/ /07/ /08/ /08/ /10/2014 NDVI categories Dense, high, moderate, low, No vegetation
19


20 Positions of scan stations Stream lines Relative elevation values (m)
21 Urban mobile laser surveying with RIEGL VMX-450 Source: Hungarian Geodetic and Mapping Company Ltd.
22 Odometer Source:
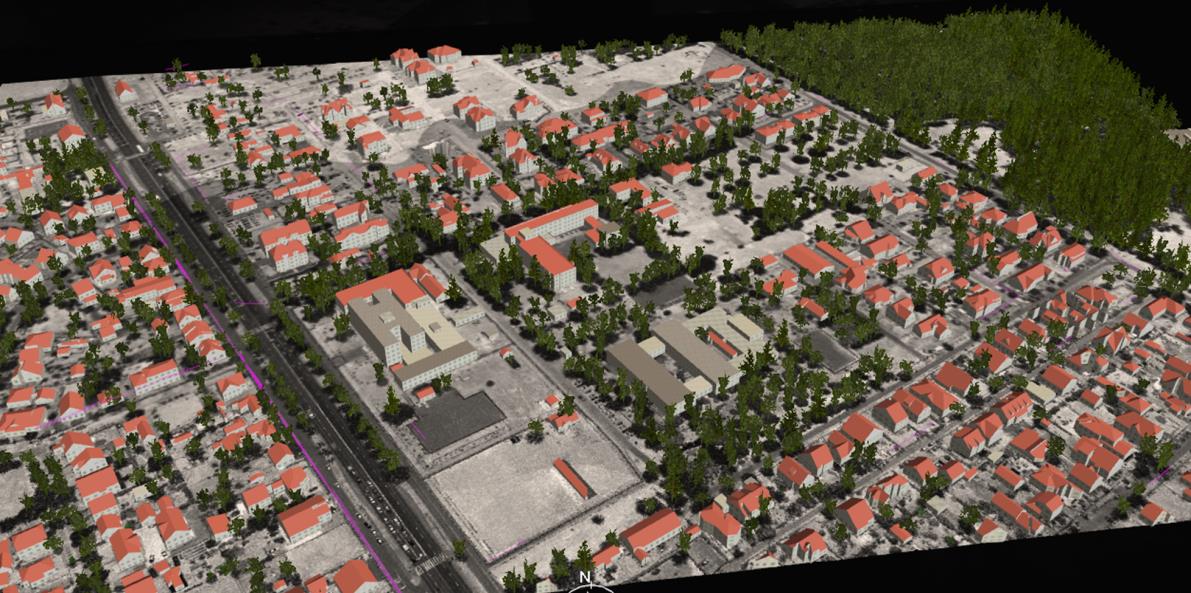
23 Colored point cloud of the Great Church Source: Tóth, K. (2015): Mobil laser scanning Point cloud based modeling of downtown of Debrecen (in Hungarian). MSc thesis. Debrecen. 58 p.
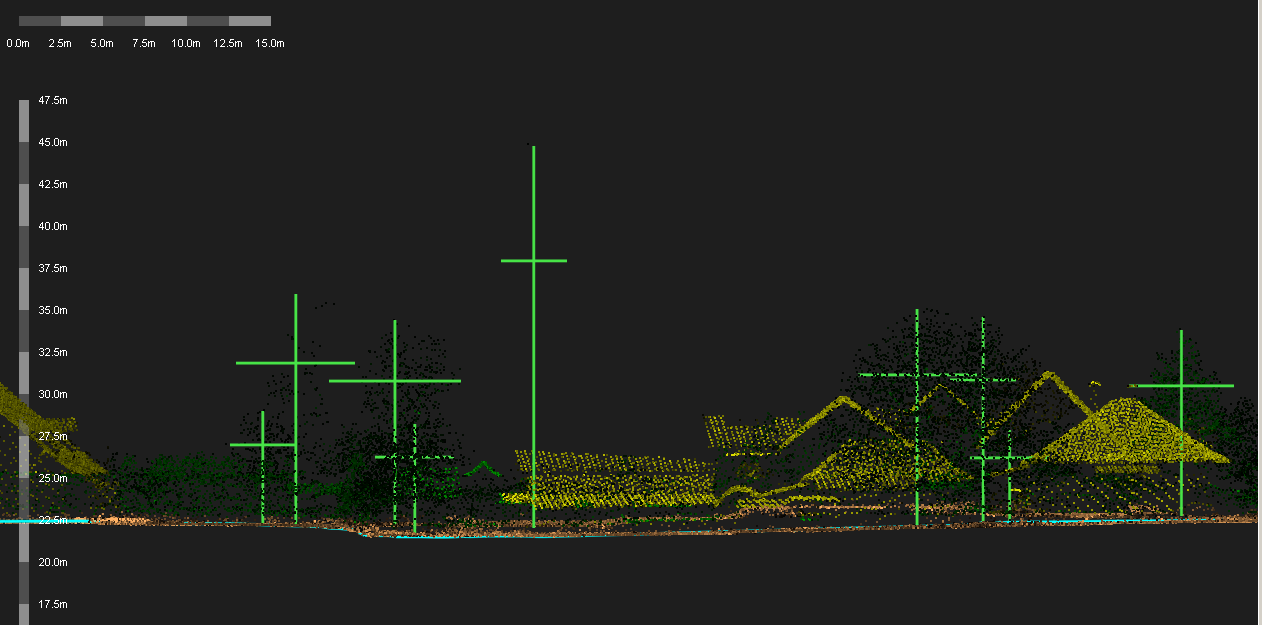
24 Automated tree recognition algorithm with ENVI LiDAR 3.2 Field measurement for validating Source: Tóth, K. (2015): Mobil laser scanning Point cloud based modeling of downtown of Debrecen (in Hungarian: Mobil lézerszkennelés Debrecen belvárosának pontfelhő alapú modellezése). MSc thesis. Debrecen. 58 p.
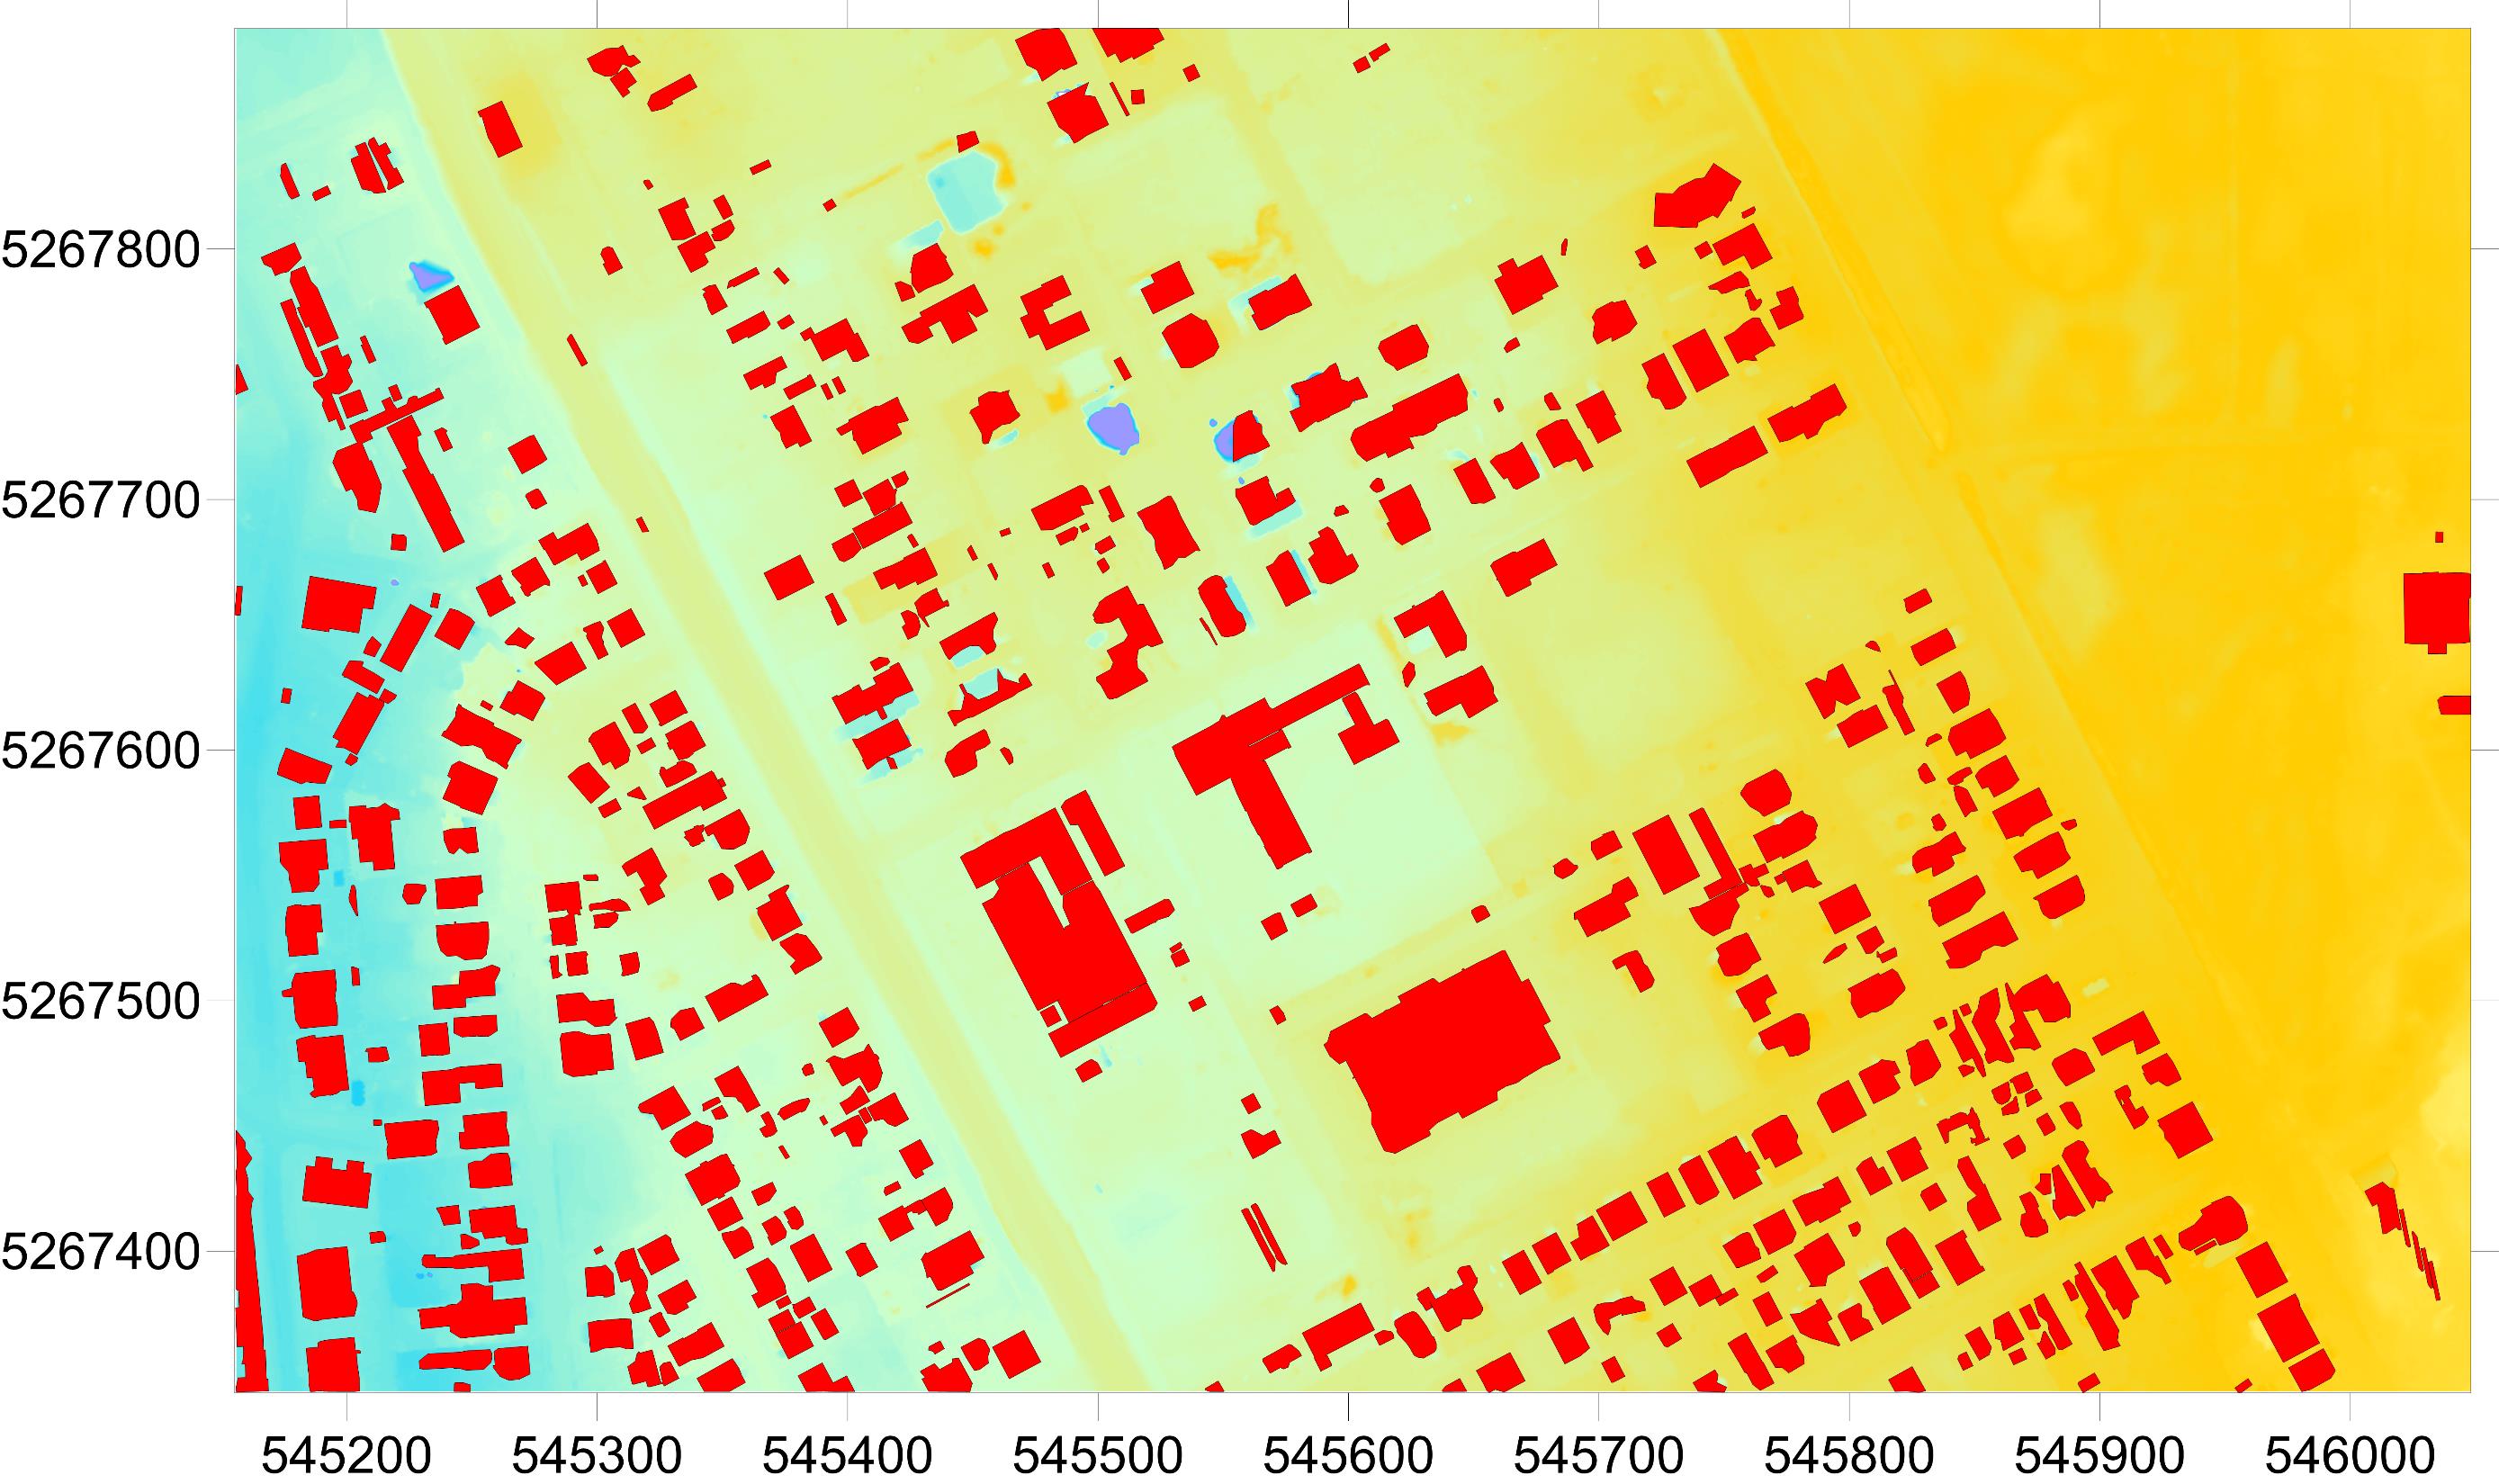
25 Runoff patern of main square
26 Tree height (m) ENVI LiDAR 3.2 automatic measurement Correlation between automatic and manually tree height measurement y = 0,8922x + 1,0103 R² = 0, Tree height (m) - Leica Cyclone 7.1 manual measurement


27 Airborne Laser Scanning Laser Data Acquisition

28 Visualization of Laser Scan Data

29 Quality Assessments
30

31
32 Summary The laser scanning methods offer very accurate input DSM to hydrological modeling The object segmentation from laser scanned point clouds is a complex process where to evaluate an error propagation spatial uncertainty is real time consuming task. The most commonly used solution is to create a raster DEM at lower resolution, followed by an additional editing of the DEM with the available noise removal, smoothing and interpolation algorithms. However, this procedure is accompanied by a loss of detail, and has an important impact on the elevation-derived parameters.

33 THANK YOU FOR ATTENTION Acknowledgements: Hungarian OTKA FUND OTKA project K
GEOENGINE MSc in Geomatics Engineering (Master Thesis) Anamelechi, Falasy Ebere
 Anamelechi, Falasy Ebere") Master s Thesis: ANAMELECHI, FALASY EBERE Analysis of a Raster DEM Creation for a Farm Management Information System based on GNSS and Total Station Coordinates Duration of the Thesis: 6 Months Completion
Master s Thesis: ANAMELECHI, FALASY EBERE Analysis of a Raster DEM Creation for a Farm Management Information System based on GNSS and Total Station Coordinates Duration of the Thesis: 6 Months Completion
High Resolution RF Analysis: The Benefits of Lidar Terrain & Clutter Datasets
 0 High Resolution RF Analysis: The Benefits of Lidar Terrain & Clutter Datasets January 15, 2014 Martin Rais 1 High Resolution Terrain & Clutter Datasets: Why Lidar? There are myriad methods, techniques
3D Model of the City Using LiDAR and Visualization of Flood in Three-Dimension
 3D Model of the City Using LiDAR and Visualization of Flood in Three-Dimension R.Queen Suraajini, Department of Civil Engineering, College of Engineering Guindy, Anna University, India, [email protected]
Impact of water harvesting dam on the Wadi s morphology using digital elevation model Study case: Wadi Al-kanger, Sudan
 Impact of water harvesting dam on the Wadi s morphology using digital elevation model Study case: Wadi Al-kanger, Sudan H. S. M. Hilmi 1, M.Y. Mohamed 2, E. S. Ganawa 3 1 Faculty of agriculture, Alzaiem
RiMONITOR. Monitoring Software. for RIEGL VZ-Line Laser Scanners. Ri Software. visit our website www.riegl.com. Preliminary Data Sheet
 Monitoring Software RiMONITOR for RIEGL VZ-Line Laser Scanners for stand-alone monitoring applications by autonomous operation of all RIEGL VZ-Line Laser Scanners adaptable configuration of data acquisition
LIDAR and Digital Elevation Data
 LIDAR and Digital Elevation Data Light Detection and Ranging (LIDAR) is being used by the North Carolina Floodplain Mapping Program to generate digital elevation data. These highly accurate topographic
Files Used in this Tutorial
 Generate Point Clouds Tutorial This tutorial shows how to generate point clouds from IKONOS satellite stereo imagery. You will view the point clouds in the ENVI LiDAR Viewer. The estimated time to complete
The following was presented at DMT 14 (June 1-4, 2014, Newark, DE).
.") DMT 2014 The following was presented at DMT 14 (June 1-4, 2014, Newark, DE). The contents are provisional and will be superseded by a paper in the DMT 14 Proceedings. See also presentations and Proceedings
DMT 2014 The following was presented at DMT 14 (June 1-4, 2014, Newark, DE). The contents are provisional and will be superseded by a paper in the DMT 14 Proceedings. See also presentations and Proceedings
Understanding Raster Data
 Introduction The following document is intended to provide a basic understanding of raster data. Raster data layers (commonly referred to as grids) are the essential data layers used in all tools developed
RIEGL VZ-400 NEW. Laser Scanners. Latest News March 2009
 Latest News March 2009 NEW RIEGL VZ-400 Laser Scanners The following document details some of the excellent results acquired with the new RIEGL VZ-400 scanners, including: Time-optimised fine-scans The
Fort Dodge Stormwater Master Planning. Prepared By: Ralph C. Stark, Jr., P.E., C.F.M. Joel N. Krause, P.E., C.F.M.
 Fort Dodge Stormwater Master Planning Prepared By: Ralph C. Stark, Jr., P.E., C.F.M. Joel N. Krause, P.E., C.F.M. Project Location Project Background Flooding History Localized flooding and storm sewer
Introduction to GIS (Basics, Data, Analysis) & Case Studies. 13 th May 2004. Content. What is GIS?
 & Case Studies. 13 th May 2004. Content. What is GIS?") Introduction to GIS (Basics, Data, Analysis) & Case Studies 13 th May 2004 Content Introduction to GIS Data concepts Data input Analysis Applications selected examples What is GIS? Geographic Information
Introduction to GIS (Basics, Data, Analysis) & Case Studies 13 th May 2004 Content Introduction to GIS Data concepts Data input Analysis Applications selected examples What is GIS? Geographic Information
Lidar 101: Intro to Lidar. Jason Stoker USGS EROS / SAIC
 Lidar 101: Intro to Lidar Jason Stoker USGS EROS / SAIC Lidar Light Detection and Ranging Laser altimetry ALTM (Airborne laser terrain mapping) Airborne laser scanning Lidar Laser IMU (INS) GPS Scanning
Active and Passive Microwave Remote Sensing
 Active and Passive Microwave Remote Sensing Passive remote sensing system record EMR that was reflected (e.g., blue, green, red, and near IR) or emitted (e.g., thermal IR) from the surface of the Earth.
LANDSLIDE MONITORING IN THE CONTEXT OF SUSTAINABLE DEVELOPMENT
 LANDSLIDE MONITORING IN THE CONTEXT OF SUSTAINABLE DEVELOPMENT S.I. HERBAN1, Clara-Beatrice VÎLCEANU2 1,2 Politehnica University of Timişoara, Faculty of Civil Engineering, Department of Land Measurements
3D Building Roof Extraction From LiDAR Data
 3D Building Roof Extraction From LiDAR Data Amit A. Kokje Susan Jones NSG- NZ Outline LiDAR: Basics LiDAR Feature Extraction (Features and Limitations) LiDAR Roof extraction (Workflow, parameters, results)
FOREST PARAMETER ESTIMATION BY LIDAR DATA PROCESSING
 P.-F. Mursa Forest parameter estimation by LIDAR data processing FOREST PARAMETER ESTIMATION BY LIDAR DATA PROCESSING Paula-Florina MURSA, Master Student Military Technical Academy, [email protected]
Enhanced DEM-based flow path delineation algorithms for urban drainage modelling
 Enhanced DEM-based flow path delineation algorithms for urban drainage modelling João Paulo Leitão, S. Boonya-aroonnet, D. Prodanović and Č. Maksimović Belo Horizonte, Brasil October, 2009 Outline Urban
MODIS IMAGES RESTORATION FOR VNIR BANDS ON FIRE SMOKE AFFECTED AREA
 MODIS IMAGES RESTORATION FOR VNIR BANDS ON FIRE SMOKE AFFECTED AREA Li-Yu Chang and Chi-Farn Chen Center for Space and Remote Sensing Research, National Central University, No. 300, Zhongda Rd., Zhongli
Image Analysis CHAPTER 16 16.1 ANALYSIS PROCEDURES
 CHAPTER 16 Image Analysis 16.1 ANALYSIS PROCEDURES Studies for various disciplines require different technical approaches, but there is a generalized pattern for geology, soils, range, wetlands, archeology,
Environmental Remote Sensing GEOG 2021
 Environmental Remote Sensing GEOG 2021 Lecture 4 Image classification 2 Purpose categorising data data abstraction / simplification data interpretation mapping for land cover mapping use land cover class
ANALYSIS 3 - RASTER What kinds of analysis can we do with GIS?
 ANALYSIS 3 - RASTER What kinds of analysis can we do with GIS? 1. Measurements 2. Layer statistics 3. Queries 4. Buffering (vector); Proximity (raster) 5. Filtering (raster) 6. Map overlay (layer on layer
Review for Introduction to Remote Sensing: Science Concepts and Technology
 Review for Introduction to Remote Sensing: Science Concepts and Technology Ann Johnson Associate Director [email protected] Funded by National Science Foundation Advanced Technological Education program [DUE
Notable near-global DEMs include
 Visualisation Developing a very high resolution DEM of South Africa by Adriaan van Niekerk, Stellenbosch University DEMs are used in many applications, including hydrology [1, 2], terrain analysis [3],
Global environmental information Examples of EIS Data sets and applications
 METIER Graduate Training Course n 2 Montpellier - february 2007 Information Management in Environmental Sciences Global environmental information Examples of EIS Data sets and applications Global datasets
WHAT IS GIS - AN INRODUCTION
 WHAT IS GIS - AN INRODUCTION GIS DEFINITION GIS is an acronym for: Geographic Information Systems Geographic This term is used because GIS tend to deal primarily with geographic or spatial features. Information
3D Point Cloud Analytics for Updating 3D City Models
 3D Point Cloud Analytics for Updating 3D City Models Rico Richter 25 th May 2015 INSPIRE - Geospatial World Forum 2015 Background Hasso Plattner Institute (HPI): Computer Graphics Systems group of Prof.
IP-S2 HD. High Definition 3D Mobile Mapping System
 IP-S2 HD High Definition 3D Mobile Mapping System Integrated, turnkey solution High Density, Long Range LiDAR sensor for ultimate in visual detail High Accuracy IMU and DMI Odometry for positional accuracy
A Method Using ArcMap to Create a Hydrologically conditioned Digital Elevation Model
 A Method Using ArcMap to Create a Hydrologically conditioned Digital Elevation Model High resolution topography derived from LiDAR data is becoming more readily available. This new data source of topography
Remote Sensing and GIS Application In Change Detection Study In Urban Zone Using Multi Temporal Satellite
 Remote Sensing and GIS Application In Change Detection Study In Urban Zone Using Multi Temporal Satellite R.Manonmani, G.Mary Divya Suganya Institute of Remote Sensing, Anna University, Chennai 600 025
Abaya-Chamo Lakes Physical and Water Resources Characteristics, including Scenarios and Impacts
 LARS 2007 Catchment and Lake Research Abaya-Chamo Lakes Physical and Water Resources Characteristics, including Scenarios and Impacts Seleshi Bekele Awulachew International Water Management Institute Introduction
163 ANALYSIS OF THE URBAN HEAT ISLAND EFFECT COMPARISON OF GROUND-BASED AND REMOTELY SENSED TEMPERATURE OBSERVATIONS
 ANALYSIS OF THE URBAN HEAT ISLAND EFFECT COMPARISON OF GROUND-BASED AND REMOTELY SENSED TEMPERATURE OBSERVATIONS Rita Pongrácz *, Judit Bartholy, Enikő Lelovics, Zsuzsanna Dezső Eötvös Loránd University,
Chapter Contents Page No
 Chapter Contents Page No Preface Acknowledgement 1 Basics of Remote Sensing 1 1.1. Introduction 1 1.2. Definition of Remote Sensing 1 1.3. Principles of Remote Sensing 1 1.4. Various Stages in Remote Sensing
A HYDROLOGIC NETWORK SUPPORTING SPATIALLY REFERENCED REGRESSION MODELING IN THE CHESAPEAKE BAY WATERSHED
 A HYDROLOGIC NETWORK SUPPORTING SPATIALLY REFERENCED REGRESSION MODELING IN THE CHESAPEAKE BAY WATERSHED JOHN W. BRAKEBILL 1* AND STEPHEN D. PRESTON 2 1 U.S. Geological Survey, Baltimore, MD, USA; 2 U.S.
Selection of Drainage Network Using Raster GIS A Case Study
 International Journal of Engineering Science Invention ISSN (Online): 2319 6734, ISSN (Print): 2319 6726 Volume 2 Issue 8 ǁ August. 2013 ǁ PP.35-40 Selection of Drainage Network Using Raster GIS A Case
NEW DIGITAL TERRAIN MODELING (DTM) TOOLS FOR CABLE ROUTE PLANNING by Dr. Jose M. Andres Makai Ocean Engineering Inc.
 TOOLS FOR CABLE ROUTE PLANNING by Dr. Jose M. Andres Makai Ocean Engineering Inc.") NEW DIGITAL TERRAIN MODELING (DTM) TOOLS FOR CABLE ROUTE PLANNING by Dr. Jose M. Andres Makai Ocean Engineering Inc. EXISTING CABLE ROUTE PLANNING TOOLS In recent years, methods used for submarine cable
NEW DIGITAL TERRAIN MODELING (DTM) TOOLS FOR CABLE ROUTE PLANNING by Dr. Jose M. Andres Makai Ocean Engineering Inc. EXISTING CABLE ROUTE PLANNING TOOLS In recent years, methods used for submarine cable
METHODOLOGY FOR LANDSLIDE SUSCEPTIBILITY AND HAZARD MAPPING USING GIS AND SDI
 The 8th International Conference on Geo-information for Disaster Management Intelligent Systems for Crisis Management METHODOLOGY FOR LANDSLIDE SUSCEPTIBILITY AND HAZARD MAPPING USING GIS AND SDI T. Fernández
National Performance Evaluation Facility for LADARs
 National Performance Evaluation Facility for LADARs Kamel S. Saidi (presenter) Geraldine S. Cheok William C. Stone The National Institute of Standards and Technology Construction Metrology and Automation
LiDAR for vegetation applications
 LiDAR for vegetation applications UoL MSc Remote Sensing Dr Lewis [email protected] Introduction Introduction to LiDAR RS for vegetation Review instruments and observational concepts Discuss applications
Digital Remote Sensing Data Processing Digital Remote Sensing Data Processing and Analysis: An Introduction and Analysis: An Introduction
 Digital Remote Sensing Data Processing Digital Remote Sensing Data Processing and Analysis: An Introduction and Analysis: An Introduction Content Remote sensing data Spatial, spectral, radiometric and
IMPERVIOUS SURFACE MAPPING UTILIZING HIGH RESOLUTION IMAGERIES. Authors: B. Acharya, K. Pomper, B. Gyawali, K. Bhattarai, T.
 IMPERVIOUS SURFACE MAPPING UTILIZING HIGH RESOLUTION IMAGERIES Authors: B. Acharya, K. Pomper, B. Gyawali, K. Bhattarai, T. Tsegaye ABSTRACT Accurate mapping of artificial or natural impervious surfaces
Applying GIS Analysis to Archaeological Research in Canada
 Applying GIS Analysis to Archaeological Research in Canada T A L K B Y D R. K I S H A S U P E R N A N T P R E S E N T E D A T G E O A L B E R T A 2 0 1 3 S E P T E M B E R 2 3, 2 0 1 3 Overview Review
Remote Sensing an Introduction
 Remote Sensing an Introduction Seminar: Space is the Place Referenten: Anica Huck & Michael Schlund Remote Sensing means the observation of, or gathering information about, a target by a device separated
Figure 1.1 The Sandveld area and the Verlorenvlei Catchment - 2 -
 Figure 1.1 The Sandveld area and the Verlorenvlei Catchment - 2 - Figure 1.2 Homogenous farming areas in the Verlorenvlei catchment - 3 - - 18 - CHAPTER 3: METHODS 3.1. STUDY AREA The study area, namely
Appendix C - Risk Assessment: Technical Details. Appendix C - Risk Assessment: Technical Details
 Appendix C - Risk Assessment: Technical Details Page C1 C1 Surface Water Modelling 1. Introduction 1.1 BACKGROUND URS Scott Wilson has constructed 13 TUFLOW hydraulic models across the London Boroughs
Using Optech LMS to Calibrate Survey Data Without Ground Control Points
 Challenge An Optech client conducted an airborne lidar survey over a sparsely developed river valley. The data processors were finding that the data acquired in this survey was particularly difficult to
INTEGRATED GEOPHYSICAL AND REMOTE SENSING STUDIES ON GROTTA GIGANTE SHOW CAVE (TRIESTE ITALY) P. Paganini, A. Pavan, F. Coren, A.
 P. Paganini, A. Pavan, F. Coren, A.") INTEGRATED GEOPHYSICAL AND REMOTE SENSING STUDIES ON GROTTA GIGANTE SHOW CAVE (TRIESTE ITALY) P. Paganini, A. Pavan, F. Coren, A. Fabbricatore Aerial lidar survey - strumentation Piper Seneca II - PA34
INTEGRATED GEOPHYSICAL AND REMOTE SENSING STUDIES ON GROTTA GIGANTE SHOW CAVE (TRIESTE ITALY) P. Paganini, A. Pavan, F. Coren, A. Fabbricatore Aerial lidar survey - strumentation Piper Seneca II - PA34
Resolutions of Remote Sensing
 Resolutions of Remote Sensing 1. Spatial (what area and how detailed) 2. Spectral (what colors bands) 3. Temporal (time of day/season/year) 4. Radiometric (color depth) Spatial Resolution describes how
Land Use/Land Cover Map of the Central Facility of ARM in the Southern Great Plains Site Using DOE s Multi-Spectral Thermal Imager Satellite Images
 Land Use/Land Cover Map of the Central Facility of ARM in the Southern Great Plains Site Using DOE s Multi-Spectral Thermal Imager Satellite Images S. E. Báez Cazull Pre-Service Teacher Program University
Weed Survey and Mapping
 Weed Survey and Mapping The primary objective of weed surveying and mapping is to accurately identify and delineate land with populations of invasive plants or noxious weeds. These surveys allow land managers
GIS: Geographic Information Systems A short introduction
 GIS: Geographic Information Systems A short introduction Outline The Center for Digital Scholarship What is GIS? Data types GIS software and analysis Campus GIS resources Center for Digital Scholarship
3-D Object recognition from point clouds
 3-D Object recognition from point clouds Dr. Bingcai Zhang, Engineering Fellow William Smith, Principal Engineer Dr. Stewart Walker, Director BAE Systems Geospatial exploitation Products 10920 Technology
3D/4D acquisition. 3D acquisition taxonomy 22.10.2014. Computer Vision. Computer Vision. 3D acquisition methods. passive. active.
 Das Bild kann zurzeit nicht angezeigt werden. 22.10.2014 3D/4D acquisition 3D acquisition taxonomy 3D acquisition methods passive active uni-directional multi-directional uni-directional multi-directional
ADWR GIS Metadata Policy
 ADWR GIS Metadata Policy 1 PURPOSE OF POLICY.. 3 INTRODUCTION.... 4 What is metadata?... 4 Why is it important? 4 When to fill metadata...4 STANDARDS. 5 FGDC content standards for geospatial metadata...5
HPC and Big Data technologies for agricultural information and sensor systems
 HPC and Big Data technologies for agricultural information and sensor systems Dr. Gábor ÉLŐ, associate professor Péter SZÁRMES, doctoral student Széchenyi István University, Győr, Hungary Contents Modern
IP-S2 Compact+ 3D Mobile Mapping System
 IP-S2 Compact+ 3D Mobile Mapping System 3D scanning of road and roadside features Delivers high density point clouds and 360 spherical imagery High accuracy IMU options without export control Simple Map,
AN INVESTIGATION OF THE GROWTH TYPES OF VEGETATION IN THE BÜKK MOUNTAINS BY THE COMPARISON OF DIGITAL SURFACE MODELS Z. ZBORAY AND E.
 ACTA CLIMATOLOGICA ET CHOROLOGICA Universitatis Szegediensis, Tom. 38-39, 2005, 163-169. AN INVESTIGATION OF THE GROWTH TYPES OF VEGETATION IN THE BÜKK MOUNTAINS BY THE COMPARISON OF DIGITAL SURFACE MODELS
Raster Data Structures
 Raster Data Structures Tessellation of Geographical Space Geographical space can be tessellated into sets of connected discrete units, which completely cover a flat surface. The units can be in any reasonable
Introduction to Imagery and Raster Data in ArcGIS
 Esri International User Conference San Diego, California Technical Workshops July 25, 2012 Introduction to Imagery and Raster Data in ArcGIS Simon Woo slides Cody Benkelman - demos Overview of Presentation
APPLICATION OF GEOSPATIAL TECHNOLOGIES FOR SUSTAINABLE ENVIRONMENTAL MANAGEMENT
 APPLICATION OF GEOSPATIAL TECHNOLOGIES FOR SUSTAINABLE NATURAL RESOURCES AND ENVIRONMENTAL MANAGEMENT IN MALAYSIA By James Dawos Mamit, Ph.D. Deputy Minister Ministry of Natural Resources and Environment,
The Masters in Applied & Environmental Geoscience AEG
 Faculty of Science Department of Geosciences The Masters in Applied & Environmental Geoscience AEG What is Applied & Environmental Geoscience? Applied & Environmental Geoscience (AEG) is a research oriented
Geospatial Software Solutions for the Environment and Natural Resources
 Geospatial Software Solutions for the Environment and Natural Resources Manage and Preserve the Environment and its Natural Resources Our environment and the natural resources it provides play a growing
State of the art in mobile terrestrial laser scanning systems in Romania and at an international level
 UN/Moldova/USA Workshop on the Applications of GNSS Chisinau, 17-21 May 2010 State of the art in mobile terrestrial laser scanning systems in Romania and at an international level V.G. Olteanu, A. Badea,
LCCS & GeoVIS for land cover mapping. Experience Sharing of an Exercise
 LCCS & GeoVIS for land cover mapping Experience Sharing of an Exercise Forest Survey of India Subhash Ashutosh Joint Director Study Area Topographic sheet 53J4 Longitude - 78ºE - 78º15'E Latitude - 30ºN
PALEOENVIRONMENTS OF THE LAKE BALATON AREA
 Eötvös Loránd University Department of Geophysics HUNGARY 1117 Budapest Pázmány Péter sétány 1/C Tel: +36-1-3812191 Fax: +36-1-3812192 E-mail: [email protected] PALEOENVIRONMENTS OF THE LAKE BALATON
Application of airborne remote sensing for forest data collection
 Application of airborne remote sensing for forest data collection Gatis Erins, Foran Baltic The Foran SingleTree method based on a laser system developed by the Swedish Defense Research Agency is the first
River Flood Damage Assessment using IKONOS images, Segmentation Algorithms & Flood Simulation Models
 River Flood Damage Assessment using IKONOS images, Segmentation Algorithms & Flood Simulation Models Steven M. de Jong & Raymond Sluiter Utrecht University Corné van der Sande Netherlands Earth Observation
Appendix J Online Questionnaire
 Appendix J Online Questionnaire In accordance with the Paperwork Reduction Act, this questionnaire was approved by the Office of Management and Budget (OMB). The OMB control number and expiration date
Submitted to: Submitted by: Department of Geology and Mineral Industries 800 NE Oregon Street, Suite 965 Portland, OR 97232
 LIDAR REMOTE SENSING DATA COLLECTION DEPARTMENT OF F GEOLOGY AND MINERAL INDUSTRIES CRATER LAKE, OREGON NOVEMBER 30, 2010 Submitted to: Department of Geology and Mineral Industries 800 NE Oregon Street,
Latin American and Caribbean Flood and Drought Monitor Tutorial Last Updated: November 2014
 Latin American and Caribbean Flood and Drought Monitor Tutorial Last Updated: November 2014 Introduction: This tutorial examines the main features of the Latin American and Caribbean Flood and Drought
The effect of soil erosion on ecosystem services
 The effect of soil erosion on ecosystem services Ádám Kertész Adrienn Tóth Melinda Pálinkás Hungarian Academy of Sciences Research Centre for Astronomy and Earth Sciences Geographical Institute H-1112
dynamic vegetation model to a semi-arid
 Application of a conceptual distributed dynamic vegetation model to a semi-arid basin, SE of Spain By: M. Pasquato, C. Medici and F. Francés Universidad Politécnica de Valencia - Spain Research Institute
Earth Data Science in The Era of Big Data and Compute
 Earth Data Science in The Era of Big Data and Compute E. Lynn Usery U.S. Geological Survey [email protected] http://cegis.usgs.gov U.S. Department of the Interior U.S. Geological Survey Board on Earth Sciences
Create a folder on your network drive called DEM. This is where data for the first part of this lesson will be stored.
 In this lesson you will create a Digital Elevation Model (DEM). A DEM is a gridded array of elevations. In its raw form it is an ASCII, or text, file. First, you will interpolate elevations on a topographic
Accuracy test of 3D modelling for buffer strip calculation and land monitoring. SIN spa - Rome
 Accuracy test of 3D modelling for buffer strip calculation and land monitoring D. Biscontini, L. Rossi, P. Tosi S. Di Ielsi, F. Manzi, M.A.DelMoro SIN spa - Rome Digital Surface Model at high resolution
How To Use Lidar Data Processing Software
 Civil and Coastal Engineering Department An Overview of Lidar Point Cloud Processing Software GEM Center Report No. Rep_2007-12-001 J.C. Fernandez, A. Singhania, J. Caceres, K.C. Slatton, M Starek, R.
Managing Lidar (and other point cloud) Data. Lindsay Weitz Cody Benkelman
 Data. Lindsay Weitz Cody Benkelman") (and other point cloud) Data Lindsay Weitz Cody Benkelman Presentation Context What is lidar, and how does it work? Not this presentation! What can you do with lidar in ArcGIS? What does Esri recommend
(and other point cloud) Data Lindsay Weitz Cody Benkelman Presentation Context What is lidar, and how does it work? Not this presentation! What can you do with lidar in ArcGIS? What does Esri recommend
Data source, type, and file naming convention
 Exercise 1: Basic visualization of LiDAR Digital Elevation Models using ArcGIS Introduction This exercise covers activities associated with basic visualization of LiDAR Digital Elevation Models using ArcGIS.
ANALYSIS OF THUNDERSTORM CLIMATOLOGY AND CONVECTIVE SYSTEMS, PERIODS WITH LARGE PRECIPITATION IN HUNGARY. Theses of the PhD dissertation
 ANALYSIS OF THUNDERSTORM CLIMATOLOGY AND CONVECTIVE SYSTEMS, PERIODS WITH LARGE PRECIPITATION IN HUNGARY Theses of the PhD dissertation ANDRÁS TAMÁS SERES EÖTVÖS LORÁND UNIVERSITY FACULTY OF SCIENCE PhD
Flash Flood Science. Chapter 2. What Is in This Chapter? Flash Flood Processes
 Chapter 2 Flash Flood Science A flash flood is generally defined as a rapid onset flood of short duration with a relatively high peak discharge (World Meteorological Organization). The American Meteorological
Visualizing of Berkeley Earth, NASA GISS, and Hadley CRU averaging techniques
 Visualizing of Berkeley Earth, NASA GISS, and Hadley CRU averaging techniques Robert Rohde Lead Scientist, Berkeley Earth Surface Temperature 1/15/2013 Abstract This document will provide a simple illustration
SESSION 8: GEOGRAPHIC INFORMATION SYSTEMS AND MAP PROJECTIONS
 SESSION 8: GEOGRAPHIC INFORMATION SYSTEMS AND MAP PROJECTIONS KEY CONCEPTS: In this session we will look at: Geographic information systems and Map projections. Content that needs to be covered for examination
Matt Harris, Golder Associates (NZ) Ltd. The value of geophysics as a non-intrusive method for site characterisation
 Ltd. The value of geophysics as a non-intrusive method for site characterisation") Matt Harris, Golder Associates (NZ) Ltd. The value of geophysics as a non-intrusive method for site characterisation Presentation Outline What is geophysics and how can it help me? Electrical Resistivity
Matt Harris, Golder Associates (NZ) Ltd. The value of geophysics as a non-intrusive method for site characterisation Presentation Outline What is geophysics and how can it help me? Electrical Resistivity
Standardized Runoff Index (SRI)
") Standardized Runoff Index (SRI) Adolfo Mérida Abril Javier Gras Treviño Contents 1. About the SRI SRI in the world Methodology 2. Comments made in Athens on SRI factsheet 3. Last modifications of the factsheet
Standardized Runoff Index (SRI) Adolfo Mérida Abril Javier Gras Treviño Contents 1. About the SRI SRI in the world Methodology 2. Comments made in Athens on SRI factsheet 3. Last modifications of the factsheet
D.S. Boyd School of Earth Sciences and Geography, Kingston University, U.K.
 PHYSICAL BASIS OF REMOTE SENSING D.S. Boyd School of Earth Sciences and Geography, Kingston University, U.K. Keywords: Remote sensing, electromagnetic radiation, wavelengths, target, atmosphere, sensor,
THE GEORGIA AUTOMATED ENVIRONMENTAL MONITORING NETWORK: TEN YEARS OF WEATHER INFORMATION FOR WATER RESOURCES MANAGEMENT
 THE GEORGIA AUTOMATED ENVIRONMENTAL MONITORING NETWORK: TEN YEARS OF WEATHER INFORMATION FOR WATER RESOURCES MANAGEMENT Gerrit Hoogenboom, D.D. Coker, J.M. Edenfield, D.M. Evans and C. Fang AUTHORS: Department
Quality Assurance Reviews of Hydraulic Models Developed for the Central Valley Floodplain Evaluation and Delineation Program
 Quality Assurance Reviews of Hydraulic Models Developed for the Central Valley Floodplain Evaluation and Delineation Program Techniques Applied and Lessons Learned Seth Ahrens, P.E., CFM Selena Forman,
ASSESSMENT OF VISUALIZATION SOFTWARE FOR SUPPORT OF CONSTRUCTION SITE INSPECTION TASKS USING DATA COLLECTED FROM REALITY CAPTURE TECHNOLOGIES
 ASSESSMENT OF VISUALIZATION SOFTWARE FOR SUPPORT OF CONSTRUCTION SITE INSPECTION TASKS USING DATA COLLECTED FROM REALITY CAPTURE TECHNOLOGIES ABSTRACT Chris Gordon 1, Burcu Akinci 2, Frank Boukamp 3, and
LiDAR Point Cloud Processing with
 LiDAR Research Group, Uni Innsbruck LiDAR Point Cloud Processing with SAGA Volker Wichmann Wichmann, V.; Conrad, O.; Jochem, A.: GIS. In: Hamburger Beiträge zur Physischen Geographie und Landschaftsökologie
Robot Perception Continued
 Robot Perception Continued 1 Visual Perception Visual Odometry Reconstruction Recognition CS 685 11 Range Sensing strategies Active range sensors Ultrasound Laser range sensor Slides adopted from Siegwart
DAMAGED ROAD TUNNEL LASER SCANNER SURVEY
 University of Brescia - ITALY DAMAGED ROAD TUNNEL LASER SCANNER SURVEY Prof. Giorgio Vassena [email protected] WORKFLOW - Demand analysis - Instruments choice - On field operations planning - Laser
AUTOMATIC CLASSIFICATION OF LIDAR POINT CLOUDS IN A RAILWAY ENVIRONMENT
 AUTOMATIC CLASSIFICATION OF LIDAR POINT CLOUDS IN A RAILWAY ENVIRONMENT MOSTAFA ARASTOUNIA March, 2012 SUPERVISORS: Dr. Ir. S.J. Oude Elberink Dr. K. Khoshelham AUTOMATIC CLASSIFICATION OF LIDAR POINT
Aneeqa Syed [Hatfield Consultants] Vancouver GIS Users Group Meeting December 8, 2010
![Aneeqa Syed [Hatfield Consultants] Vancouver GIS Users Group Meeting December 8, 2010](/thumbs/27/11179985.jpg "Aneeqa Syed [Hatfield Consultants] Vancouver GIS Users Group Meeting December 8, 2010") NEAR-REAL-TIME FLOOD MAPPING AND MONITORING SERVICE Aneeqa Syed [Hatfield Consultants] Vancouver GIS Users Group Meeting December 8, 2010 SLIDE 1 MRC Flood Service Project Partners and Client Hatfield
NEAR-REAL-TIME FLOOD MAPPING AND MONITORING SERVICE Aneeqa Syed [Hatfield Consultants] Vancouver GIS Users Group Meeting December 8, 2010 SLIDE 1 MRC Flood Service Project Partners and Client Hatfield