China s Future Generation Assessing the Maximum Potential for Renewable Power Sources in China to 2050 REPORT FEBRUARY
|
|
|
- Augustus Butler
- 9 years ago
- Views:
Transcription
1 REPORT FEBRUARY 2014 China s Future Generation Assessing the Maximum Potential for Renewable Power Sources in China to 2050 William Chandler, Chen Shiping, Holly Gwin, Lin Ruosida, Wang Yanjia

2 Entri about WWF people and nature. WWF Contributors about entri about the report authors William Chandler Chen shiping holly Gwin Lin ruosida Wang Yanjia authors acknowledgments Entri 2014 Energy Transition Research Institute, Annapolis, Maryland All rights reserved. No part of this publication may be reproduced, stored in a retrieval system, or transmitted in any form or by any means, electronic or otherwise, without written permission from the publisher. 2 China s Future Generation

3 China s Future Generation Foreword and Introduction by WWF Analysis and Report by Entri

4 BOLD ACTIONS MUST BE TAKEN BY ALL TO MAKE THE CHANGES NECESSARY TO AVOID A FUTURE LO SZE PING NO ONE WANTS.

5 FOREWORD planet. i not stop until it s done. i

6 THE PUBLIC IN CHINA HAS BEGUN TO CALL FOR MAJOR ACTION, UNDERSTANDING THAT THE COSTS OF CHINA S CURRENT ENERGY CHOICES ARE NOT WORTH THE RISKS.

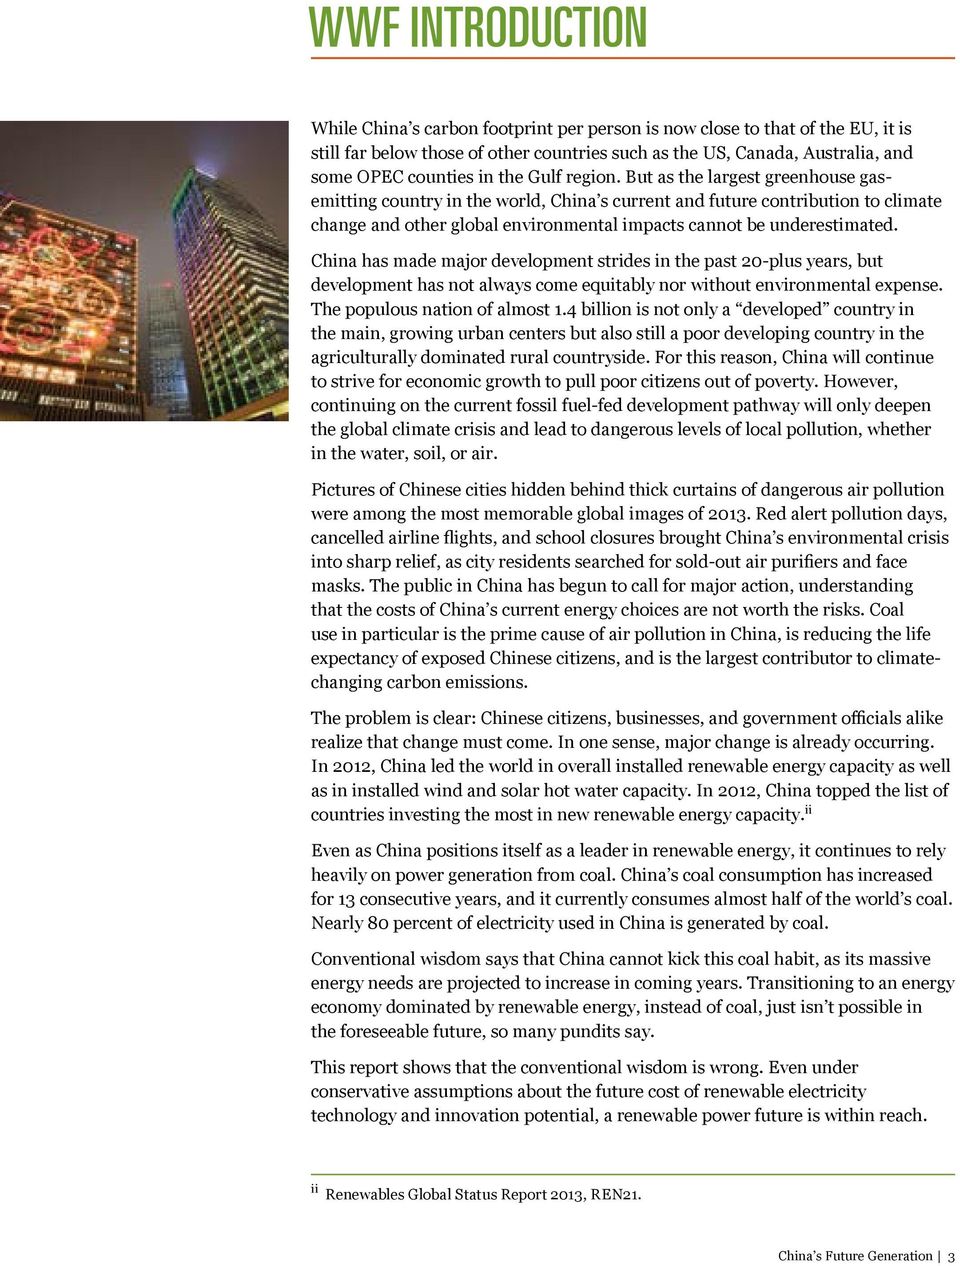
7 WWF INTRODUCTION ii ii
8 WWF Introduction iii The Imperative for a Clean Energy Revolution iii

9 CAPPING COAL CONSUMPTION IN THE NEXT FEW YEARS AND ENSURING ITS STEADY DECLINE THEREAFTER IS THE ONLY WAY FOR CHINA TO CHART A PATH FOR SUSTAINABLE GROWTH.

10 OVER THE PERIOD , THE TOTAL COSTS FOR AN ELECTRIC POWER SYSTEM RUN MAINLY WITH RENEWABLES WOULD BE CHEAPER THAN A SYSTEM DOMINATED BY COAL.

11 China s (Possible) Renewable Power Future and 2 Baseline Scenario High Efficiency Scenario High Renewables Scenario Low-Carbon Mix Scenario

12 WWF Introduction WWF s Perspective on the High Renewables Scenario Electricity Generation, Electricity High Renewables Generation, Scenario High Renewables Scenario 25,000 Gas Gas Coal Coal Nuclear Nuclear Hydro Hydro Wind Wind Solar Solar Other Renewables Other Renewables Avoided generation from efficiency measures and structural economic change 20,000 15,000 10,000 Terawatt Hours Per Year 5, % of electricity 26 from renewables Energy Efficiency and Conservation

13 THE HIGH RENEWABLES SCENARIO IS THE MOST DESIRABLE FOR WWF, BECAUSE IT PRODUCES THE LOWEST AMOUNT OF CARBON EMISSIONS AND HAS THE LOWEST TOTAL COSTS OF ANY SCENARIO.

14

15 Wind, Solar, and Other (Non-Hydro) Renewables prohibition. Hydro Coal

16 WWF Introduction Gas 2 Nuclear Policy Recommendations in China. #1 Double down on energy efficiency.

17 #2 Prioritize low-carbon electricity supply investments. #3 Allow prices to reflect the cost of service. #4 Collect, publish, and analyze the data that matter. Conclusion: Toward 100 Percent Renewable Electricity in China

18

19 China s Future Generation Assessing the Maximum Potential for Renewable Power Sources in China to 2050 William Chandler, Chen Shiping, Holly Gwin, Lin Ruosida, Wang Yanjia Entri 2014 Energy Transition Research Institute, Annapolis, Maryland All rights reserved. No part of this publication may be reproduced, stored in a retrieval system, or transmitted in any form or by any means, electronic or otherwise, without written permission from the publisher.

20

21 The purpose of this study 2 to assess Exploration of High-Penetration Renewable Electricity Futures
22 Entri Analysis and Report Introduction to the Model China Today
23 Electricity Scenario Development Baseline: High Renewables: Low Carbon Mix: Economic Assumptions
24 Entri Analysis and Report to TABLE 1 Annual Economic Growth Rate GDP Assumptions in the China 8760 Grid Model Baseline scenario 7% 7% 4% 3% 2% (Low Service, Lower Growth) (High Service, Higher Growth) Note: The share of services in the economy in 2050 would increase from just under 45 percent of GDP in 2012 to just under 60 percent in the Baseline scenario and just under 75 percent in the other technology scenarios in Source: Entri TABLE 2 and Low-Carbon Mix Scenarios Population 50% 79% GDP per Capita (Constant 2013 US$ GDP Elasticity of Electric Power Demand Price Elasticity of Electric Power Demand Source: Entri
25 Demand Technologies TABLE 3 Key Elements of Each Scenario Scenario Reforms Economy Mandates Mandates Renewables Expands Nuclear Regulates Carbon Baseline
26 Entri Analysis and Report FIGURE 1 Chinese Electricity Use Per Capita Baseline USA 2010 Korea 2010 Japan 2010 kwh Per Person Per Year FIGURE 2 Chinese GDP Per Capita Baseline Japan 2010 Korea US$ China s Future Generation
27 Supply Technologies Coal. 22 Natural gas. Nuclear. of
28 Entri Analysis and Report Renewables.
29
30 Entri Analysis and Report BOX 1 Why Not 100 Percent Renewables? and China. future.
31 Transmission and Storage
32 Entri Analysis and Report Modeling Results
33 FIGURE 3 Total Cost of the Electric Power System Trillion US$ 56.0 Baseline 55.0 FIGURE 4 Carbon Emissions Baseline
34 Entri Analysis and Report High Renewables Scenario
35 gas generation plants can be operated on the schedule best matched to the variability in renewable supplies. Please see Appendix III for a scenario balanced with more coal. We used two policy like instructions in the model to generate the High Renewables scenario. First, we required the model to select renewables for new additions to capacity if they were available (the model then picked the least-cost renewable technology). Then, we prohibited selection of coal for new additions to capacity after year 2020 and banned all use of coal (in the power sector) after year plants. They are shut down an average of 10 years early, at a prorated capital cost of about US$250/kW. The total lost value is about US$75 billion, or US$7.5 billion per year for 10 years. If this cost were reimbursed to generators and passed to consumers, it would increase electricity prices by an estimated US$0.001 per kwh over the 10-year period. (This cost is not included in our total cost estimates in Figure 3 on page 29, or elsewhere in the text.) This carbon cap requires the grid to make an adjustment in generating capacity the cost is the fact that power generating capacity that works two-thirds of the time predictably is replaced with capacity that if it is renewable works onethird of the time at best and is predictable only in time frames that are shorter than the time that may be needed to bring backup power sources online (i.e., one to four hours). To ensure relative stability in output, several times the nominal and instability still remains in the system. Low-Carbon Mix Scenario The Low-Carbon Mix scenario adopts the High Renewables scenario policy regarding coal but reintroduces nuclear power to match the Chinese government s stated development goals (400 GW). The Low-Carbon Mix scenario provides similar carbon emissions reductions at a similar price to the High Renewables scenario. Some Chinese policy makers consider nuclear as an alternative to hydro. 38 China s Future Generation 31
36 Entri Analysis and Report FIGURE 5a Electricity Generation, Baseline Scenario 25,000 Gas Coal Nuclear Hydro Wind Solar Other Renewables 20,000 15,000 10,000 Terawatt Hours Per Year 5, % of electricity from renewables FIGURE 5b Electricity Generation, High Efficiency Scenario 25,000 20,000 Avoided generation from efficiency measures and structural economic change 15,000 10,000 Terawatt Hours Per Year 5, % of electricity from renewables
37 FIGURE 5c Electricity Generation, High Renewables Scenario 25,000 Gas 20,000 Coal Nuclear Hydro Wind Solar Other Renewables Avoided generation from efficiency measures and structural economic change 15,000 10,000 Terawatt Hours Per Year 5, % of electricity from renewables FIGURE 5d Electricity Generation, Low-Carbon Scenario 25,000 20,000 Avoided generation from efficiency measures and structural economic change 15,000 10,000 Terawatt Hours Per Year 5, % of electricity from renewables
38 Entri Analysis and Report Shifting to Low-Carbon Electricity in China Signs of Good Intentions
39 Signs of Difficulties Ahead
40 Entri Analysis and Report Policy Recommendations China s regulators should issue timely and technology-forcing industrial process standards
41 BOX 2 Stringent Standards to Manage Chinese Power Demand Sector Industrial 69% 55% Other 2% 1% China s leaders should direct the State Grid Corporation and the South China Grid system reliability and security
42 Entri Analysis and Report China s grid companies should replicate the essential elements of the Olympic Peninsula Project in China s electricity sector. demand-side management (DSM) costs Make carbon-saving the top criterion for all decisions about electricity supply investment. cut coal power generation, such as a carbon standard if it hopes to transform its coal-based electricity supply system to a low-carbon system
43 BOX 3 Olympic Peninsula Smart Grid Demonstration Project et al,
44
45
46 Entri Analysis and Report The NDRC should consider a demand charge for commercial and residential consumers.
47 markets. * sold Collect, publish, and analyze the data that matter. renewables installations and monitor their performance. *
48 Entri Analysis and Report
49 APPENDICES
50 Appendix I Detailed Modeling Assumptions Demographic and Economic Assumptions DEMOGRAPHIC ASSUMPTIONS ECONOMIC ASSUMPTIONS
51 Technology Parameters Technology Conversion Historic Capacity Factor Fuel Cost (RMB/GJ) O&M Cost (RMB/kWh) Technology (Year) Fuel Carbon (kgc/gj) Electricity Use Onsite (%) N/A Concentrated Solar Power N/A N/A N/A N/A N/A Geothermal N/A Technology Expectations (Annual Rates of Change) Technology Conversion Capital Cost Fuel Cost O&M Cost N/A N/A N/A N/A N/A 0 N/A 0 N/A Nuclear Power
52 Appendix I Detailed Modeling Assumptions Conservation Assumptions GENERAL RESIDENTIAL 2 per Household per Year after 120 m 2 per Household 2 per Household per Year after 200 m 2 per Household RESIDENTIAL WATER HEATING Capital Cost Life Time Average Capacity of Electricity Water Heating Electricity Water Heating Share out of 0.3 Electricity Water Heating Share out of 0.3 at Policy Scenario in US$/Unit 10 Years 1.5 kw/unit RESIDENTIAL AIR CONDITIONING Capital Cost Life Time Average Capacity at Baseline in 2040 Average Capacity at Policy in US$/Unit 15 Years 2 kw/unit 1.5 kw/unit
53 Conservation Assumptions, cont. RESIDENTIAL LIGHTING Capital Cost of LEDs 5 US$/Unit Life Time 20 Years Capacity of LEDs kw/unit LED Cost Improvement 0 COMMERCIAL LIGHTING Capital Cost 19 US$/Unit Life Time 20 Years 2 /Year Average Capacity at Policy in kw/unit COMMERCIAL AIR CONDITIONING Life Time 20 Years Electricity Consumption in kwh/m 2 /Year INDUSTRY
54 Appendix II Summary of Results Baseline Scenario total Demand (TWh/Year) Installed Capacity (GW) Generating Cost (Billion RMB) Cost of Transmission (Billion RMB/Year) Cost of Demand/Peak Reduction Measures (Billion RMB/Year) Cost of Storage (Billion RMB/Year) Cost of All Measures (Billion RMB/Year) Population (Millions) GDP (2010 USD per Capita) Power Use per Capita (kwh) Carbon Dioxide Emissions (Million Tons/Year) Power Demand Growth (GDP Growth) 4,693 6,155 8,952 11,413 14,063 16,466 19,028 20,950 22, ,538 1,019 1,429 2,097 2,616 3,174 3,679 4,216 4,619 5, ,269 1,708 2,689 4,197 5,548 7,241 9,090 11,328 13,525 15, , ,377 N/A ,824 2,883 4,484 5,908 7,682 9,606 11,924 14,180 16, , ,347 1,369 1,386 1,393 1,374 1,355 1,337 1,319 1,300 N/A 5,549 6,308 8,737 10,880 13,420 15,927 18,720 21,160 23,687 N/A 3,484 4,497 6,459 8,192 10,234 12,149 14,234 15,889 17,523 N/A 2,766 3,638 4,915 6,254 8,087 9,767 11,560 12,901 14, , N/A CapaCity (GW) Solar PV [3 MW] Concentrated Solar Power [30 MW] Wind Power, On Shore [30 MW scale] Wind Power, Off Shore [30 MW scale] Hydro, Large Scale Hydro, Small Scale Geothermal Biomass [25 MW] Sub-Critical Coal Sub-Critical Coal w/ Biomass Super-Critical Coal [1000 MW] Super-Critical Coal [600 MW] IGCC CCS Coal [1,000 MW] Nuclear Power Natural Gas, Peak Load Natural Gas, Base Load total N/A N/A N/A N/A N/A N/A N/A N/A N/A N/A ,357 1,812 2,361 2,864 3,399 3,801 4,184 N/A N/A N/A N/A N/A N/A 1,019 1,429 2,097 2,616 3,174 3,679 4,216 4,619 5,004 N/A CapaCity MiX GENERatiON (twh) Solar PV [3 MW] Concentrated Solar Power [30 MW] Wind Power, On Shore [30 MW scale] Wind Power, Off Shore [30 MW scale] Hydro, Large Scale Hydro, Small Scale Geothermal Biomass [25 MW] Sub-Critical Coal Sub-Critical Coal w/ Biomass Super-Critical Coal [1000 MW] Super-Critical Coal [600 MW] IGCC CCS Coal [1000 MW] Nuclear Power Natural Gas, Peak Load Natural Gas, Base Load Percent of Renewables total , ,051 1,051 1,051 1,051 1,051 1,051 8, , ,590 4,852 6,896 9,206 11,997 14,549 17,272 19,310 21, , , , N/A 4,714 6,584 9,577 12,209 15,043 17,614 20,355 22,411 24, , China s Future Generation
55 total Demand (TWh/Year) Installed Capacity (GW) Generating Cost (Billion RMB) Cost of Transmission (Billion RMB/Year) Cost of Demand/Peak Reduction Measures (Billion RMB/Year) Cost of Storage (Billion RMB/Year) Cost of All Measures (Billion RMB/Year) Population (Millions) GDP (2010 USD per Capita) Power Use per Capita (kwh) Carbon Dioxide Emissions (Million Tons/Year) Power Demand Growth (GDP Growth) 4,693 5,329 6,476 7,238 7,982 8,907 10,028 10,883 11, ,510 1,019 1,255 1,576 1,737 1,894 2,087 2,321 2,499 2,683 85,363 1,708 2,362 3,163 3,693 4,293 5,087 6,120 7,158 8, , ,505 N/A ,188 2,112 3,427 4,597 6,498 7, , ,824 2,702 3,932 5,113 6,659 8,798 11,036 14,001 16, ,226 1,347 1,369 1,386 1,393 1,374 1,355 1,337 1,319 1,300 N/A 5,549 6,308 8,415 10,381 12,805 15,795 19,484 23,123 27,178 N/A 3,484 3,894 4,673 5,195 5,809 6,572 7,501 8,254 9,047 N/A 2,766 3,001 3,099 3,306 3,794 4,430 5,205 5,793 6, , N/A CapaCity (GW) Solar PV [3 MW] Concentrated Solar Power [30 MW] Wind Power, On Shore [30 MW scale] Wind Power, Off Shore [30 MW scale] Hydro, Large Scale Hydro, Small Scale Geothermal Biomass [25 MW] Sub-Critical Coal Sub-Critical Coal w/ Biomass Super-Critical Coal [1000 MW] Super-Critical Coal [600 MW] IGCC CCS Coal [1,000 MW] Nuclear Power Natural Gas, Peak Load Natural Gas, Base Load total N/A N/A N/A N/A N/A N/A N/A N/A N/A N/A ,081 1,272 1,504 1,681 1,863 N/A N/A N/A N/A N/A N/A 1,019 1,255 1,576 1,737 1,894 2,087 2,321 2,499 2,683 N/A CapaCity MiX GENERatiON (twh) Solar PV [3 MW] Concentrated Solar Power [30 MW] Wind Power, On Shore [30 MW scale] Wind Power, Off Shore [30 MW scale] Hydro, Large Scale Hydro, Small Scale Geothermal Biomass [25 MW] Sub-Critical Coal Sub-Critical Coal w/ Biomass Super-Critical Coal [1000 MW] Super-Critical Coal [600 MW] IGCC CCS Coal [1000 MW] Nuclear Power Natural Gas, Peak Load Natural Gas, Base Load Percent of Renewables total , ,051 1,051 1,051 1,051 1,051 1,051 8, , ,590 3,968 4,247 4,740 5,493 6,464 7,644 8,540 9,466 54, , , N/A 4,714 5,701 6,928 7,743 8,539 9,529 10,727 11,642 12,586 78,109 China s Future Generation 51
56 Appendix II Summary of Results High Renewables Scenario total Demand (TWh/Year) Installed Capacity (GW) Generating Cost (Billion RMB) Cost of Transmission (Billion RMB/Year) Cost of Demand/Peak Reduction Measures (Billion RMB/Year) Cost of Storage (Billion RMB/Year) Cost of All Measures (Billion RMB/Year) Population (Millions) GDP (2010 USD per Capita) Power Use per Capita (kwh) Carbon Dioxide Emissions (Million Tons/Year) Power Demand Growth (GDP Growth) 4,693 5,361 6,534 7,232 7,926 8,874 10,034 10,921 11, ,900 1,019 1,295 1,639 2,121 2,607 3,230 3,948 4,740 5, ,299 1,708 2,284 2,991 3,810 4,544 5,441 6,391 7,392 8, , ,774 N/A ,184 2,021 3,249 4,364 6,251 7, , ,824 2,636 3,793 5,331 6,992 9,216 11,397 14,399 16, , ,347 1,369 1,386 1,393 1,374 1,355 1,337 1,319 1,300 N/A 5,549 6,308 8,415 10,381 12,805 15,795 19,484 23,123 27,178 N/A 3,484 3,917 4,714 5,191 5,768 6,548 7,506 8,283 9,077 N/A 2,766 3,247 3,598 2,920 2,456 2,029 1, , N/A CapaCity (GW) Solar PV [3 MW] Concentrated Solar Power [30 MW] Wind Power, On Shore [30 MW scale] Wind Power, Off Shore [30 MW scale] Hydro, Large Scale Hydro, Small Scale Geothermal Biomass [25 MW] Sub-Critical Coal Sub-Critical Coal w/ Biomass Super-Critical Coal [1000 MW] Super-Critical Coal [600 MW] IGCC CCS Coal [1,000 MW] Nuclear Power Natural Gas, Peak Load Natural Gas, Base Load total Storage ,263 1,377 N/A N/A ,147 1,373 1,374 N/A N/A N/A N/A N/A N/A N/A N/A , N/A N/A N/A N/A N/A ,036 1,126 N/A 1,019 1,295 1,639 2,121 2,607 3,230 3,948 4,740 5,063 N/A N/A CapaCity MiX GENERatiON (twh) Solar PV [3 MW] Concentrated Solar Power [30 MW] Wind Power, On Shore [30 MW scale] Wind Power, Off Shore [30 MW scale] Hydro, Large Scale Hydro, Small Scale Geothermal Biomass [25 MW] Sub-Critical Coal Sub-Critical Coal w/ Biomass Super-Critical Coal [1000 MW] Super-Critical Coal [600 MW] IGCC CCS Coal [1000 MW] Nuclear Power Natural Gas, Peak Load Natural Gas, Base Load Percent of Renewables total ,388 1,880 2,051 7, ,089 1,542 2,068 2,412 8, ,143 1,756 2,256 2,794 3,427 3,514 15, , ,055 1,181 1,245 1,309 1,373 1,437 9, , ,590 4,387 5,089 4,241 3,392 2,544 1, , ,232 2,069 2,249 6, N/A 4,714 5,735 6,989 7,737 8,479 9,493 10,734 11,682 12,627 78, China s Future Generation
57 Low Carbon Mix Scenario total Demand (TWh/Year) Installed Capacity (GW) Generating Cost (Billion RMB) Cost of Transmission (Billion RMB/Year) Cost of Demand/Peak Reduction Measures (Billion RMB/Year) Cost of Storage (Billion RMB/Year) Cost of All Measures (Billion RMB/Year) Population (Millions) GDP (2010 USD per Capita) Power Use per Capita (kwh) Carbon Dioxide Emissions (Million Tons/Year) Power Demand Growth (GDP Growth) 4,693 5,353 6,510 7,216 7,919 8,869 10,037 10,942 11, ,981 1,019 1,288 1,613 2,039 2,468 2,936 3,512 4,161 4, ,178 1,708 2,299 3,059 3,869 4,617 5,591 6,685 7,824 8, , ,073 N/A ,174 2,011 3,220 4,301 6,116 7, , ,824 2,649 3,848 5,355 7,028 9,281 11,513 14,542 16, , ,347 1,369 1,386 1,393 1,374 1,355 1,337 1,319 1,300 N/A 5,549 6,308 8,415 10,381 12,805 15,795 19,484 23,123 27,178 N/A 3,484 3,911 4,697 5,179 5,763 6,544 7,508 8,298 9,118 N/A 2,766 3,189 3,378 2,743 2,304 1,880 1, , N/A CapaCity (GW) Solar PV [3 MW] Concentrated Solar Power [30 MW] Wind Power, On Shore [30 MW scale] Wind Power, Off Shore [30 MW scale] Hydro, Large Scale Hydro, Small Scale Geothermal Biomass [25 MW] Sub-Critical Coal Sub-Critical Coal w/ Biomass Super-Critical Coal [1000 MW] Super-Critical Coal [600 MW] IGCC CCS Coal [1,000 MW] Nuclear Power Natural Gas, Peak Load Natural Gas, Base Load total Storage ,062 1,138 N/A N/A ,091 1,033 N/A N/A N/A N/A N/A N/A N/A N/A N/A N/A N/A N/A N/A ,100 N/A 1,019 1,288 1,613 2,039 2,468 2,936 3,512 4,161 4,400 N/A N/A CapaCity MiX GENERatiON (twh) Solar PV [3 MW] Concentrated Solar Power [30 MW] Wind Power, On Shore [30 MW scale] Wind Power, Off Shore [30 MW scale] Hydro, Large Scale Hydro, Small Scale Geothermal Biomass [25 MW] Sub-Critical Coal Sub-Critical Coal w/ Biomass Super-Critical Coal [1000 MW] Super-Critical Coal [600 MW] IGCC CCS Coal [1000 MW] Nuclear Power Natural Gas, Peak Load Natural Gas, Base Load Percent of Renewables total ,177 1,581 1,695 6, ,272 1,694 1,902 6, ,030 1,552 1,915 2,269 2,723 2,643 12, , ,055 1, , , ,590 4,307 4,767 3,972 3,178 2,383 1, , ,273 1,885 2,497 3,109 10, ,099 1,917 2,197 6, N/A 4,714 5,726 6,965 7,719 8,472 9,488 10,737 11,705 12,685 78,103 China s Future Generation 53
58 Appendix III Alternative High Renewables Scenario Alternative High Renewables Scenario: Using Coal Instead of Natural Gas to Backup Renewables FIGURE IIIa Electricity FIGURE Figure III 5b Electricity Generation, Electricity Generation, Generation, High Renewables High High Renewables Efficiency Scenario Scenario with Coal with Backup Coal Backup 25,000 Gas 20,000 Coal Nuclear Hydro Wind Solar Other Renewables Avoided generation from efficiency measures and structural economic change 15,000 10,000 Terawatt Hours Per Year 5, % of electricity from renewables
59 FIGURE IIIb Carbon Emissions Baseline
60 Appendix IV The China 8760 Grid Model The China 8760 Grid Model: Methodology and Overview NOTE: This appendix includes only the introduction from a separate methodology paper that presents detailed methods and mathematical formulas for the China 8760 Grid Model. The latest hour-by- ology has been published at Assessing the Future in China. Overview of the Model
61 population totals are tabulated.
62
63 NOTES AND REFERENCES 2 Renewable Electricity Futures Study (Entire Report) Journal of Applied Meteorology and Climate Energy Subsidy Reform: Lessons and Implications Science
64 Notes and References hourly 22 Energy Policy
65 Update of the MIT 2003 Future of Nuclear Power Science Journal of Meteorological Research and Application Electric Power Technologic Economics if all other factors are held constant Estimating Total GDP Elasticity partial total total
66 Notes and References Science Magazine Science Science Science The Economist Bloomberg - China s Power Sector: A Backgrounder for China Daily
67 See Renewable Electricity Futures Study op. cit. Challenge Caixin China Set to Subsidize Renewable Energy China Set to Pay Renewable-Power Subsidies After Two-Year Delay
68 Notes and References Natural Resources Journal 2 Science - New York Times China Daily op. cit.
69 PHOTOGRAPHY CREDITS 2 Global Global Global
70 Why we are here To stop the degradation of the planet s natural environment and FPO
Keisuke Sadamori Director, Energy Markets and Security International Energy Agency Kuala Lumpur, 8 October
 Keisuke Sadamori Director, Energy Markets and Security International Energy Agency Kuala Lumpur, 8 October The context Southeast Asia is a key pillar of Asia s growth A mix of countries with disparate
GLOBAL RENEWABLE ENERGY MARKET OUTLOOK 2013
 GLOBAL RENEWABLE ENERGY MARKET OUTLOOK 213 FACT PACK GUY TURNER HEAD OF ECONOMICS AND COMMODITIES APRIL 26, 213 GLOBAL RENEWABLE ENERGY MARKET OUTLOOK, 26 APRIL 213 1 INTRODUCTION This year s Global Renewable
Energy [R]evolution vs. IEA World Energy Outlook scenario
![Energy [R]evolution vs. IEA World Energy Outlook scenario](/thumbs/35/17229912.jpg "Energy [R]evolution vs. IEA World Energy Outlook scenario") Energy [R]evolution vs. IEA World Energy Outlook scenario New set of scenarios takes climate crisis into account World Energy Outlook (WEO) 2008 for the first time takes the climate crisis really into
Energy [R]evolution vs. IEA World Energy Outlook scenario New set of scenarios takes climate crisis into account World Energy Outlook (WEO) 2008 for the first time takes the climate crisis really into
Success story: Feed-In Tariffs Support renewable energy in Germany
 Success story: Feed-In Tariffs Support renewable energy in Germany This document will show how this success story has been brought about and is made up of the following sections: 1. What is a Feed-In Tariff?
Germany Energy efficiency report
 Germany Energy efficiency report Objectives: 231 TWh of end-user energy savings by 216 Overview 29 2-29 (% / year) Primary intensity (EU=1) 1 99 + -1.3% - CO 2 intensity (EU=1) 16 - -1.6% - CO 2 emissions
Electricity Prices Panel
 Electricity Prices Panel Presentation to CCRE Roundtable Hockley Valley March 27, 214 Amir Shalaby, Vice President, Power System Planning March 27, 214 Today s Journey to Residential Bills Part I: Electricity
Phakwe group. Growing with Africa
 Phakwe group Growing with Africa GROUP STRUCTURE 2 Energy supply, demand and security There are a wide range of energy resources, with different security of supply and environmental issues: Non-renewable
OUTLOOK FOR NATURAL GAS IN EUROPE
 6th German-Norwegian Energy Conference OUTLOOK FOR NATURAL GAS IN EUROPE Dr. Berit Tennbakk, Partner, RETROSPECT FALLING AND CONVERGING GAS PRICES HISTORICAL DEVELOPMENT MAIN DRIVERS Financial crisis Fukushima
Please address your inquiries to [email protected].
 Excerpt from: ii - EXCERPT FROM ENERGY BALANCES OF OECD COUNTRIES (215 edition) The following analysis is an excerpt from the publication Energy Balances of OECD Countries (215 edition). Please note that
Renewable Choice Energy
 Catawba College Table of Contents About Renewable Choice The Problem: Electricity Production Today The Solutions: Renewable Energy Sources Renewable Energy Credits (RECs) Who can participate in Renewable
International Solar Energy Arena January 23rd, 2009, Istanbul STEAM (Strategic Technical Economic Research Center)
") International Solar Energy Arena January 23rd, 2009, Istanbul STEAM (Strategic Technical Economic Research Center) Good morning. Sayin Bakanım. Members of Parliament. Ladies and Gentlemen. Slide 1: Opening
International Solar Energy Arena January 23rd, 2009, Istanbul STEAM (Strategic Technical Economic Research Center) Good morning. Sayin Bakanım. Members of Parliament. Ladies and Gentlemen. Slide 1: Opening
Energy Megatrends 2020
 Energy Megatrends 2020 Esa Vakkilainen 1 NOTE The data included in the following is mainly based on International Energy Agency's (IEA) World Energy Outlook 2007 IEA is considered the most reliable source
Evolution of the smart grid in China
 18 Evolution of the smart grid in China Development of this enormous market could shape the future of the smart grid globally. David Xu, Michael Wang, Claudia Wu, and Kevin Chan China has become the world
Power Generation. Lilian Macleod Power Supply Manager National Grid
 Power Generation Place your chosen image here. The four corners must just cover the arrow tips. For covers, the three pictures should be the same size and in a straight line. This text box and image can
Levelized Cost of New Electricity Generating Technologies
 Levelized Cost of New Electricity Generating Technologies The Energy Information Administration (EIA) produces forecasts of energy supply and demand for the next 20 years using the National Energy Modeling
China s CO2 Emission Scenario Toward 2 degree global target. Jiang Kejun. Energy Research Institute, China
 China s CO2 Emission Scenario Toward 2 degree global target Jiang Kejun Energy Research Institute, China PUBLIC CONFERENCE Victoria University, Thursday 26 June, 214 1 ERI, China Framework of Integrated
Fact Sheet on China s energy sector and Danish solutions
 Fact Sheet on China s energy sector and Danish solutions 1. EXPANSION WITH RENEWABLE ENERGY: China focuses on a massive expansion with non fossil energy that is renewable energy and nuclear energy. The
ERCOT Analysis of the Impacts of the Clean Power Plan Final Rule Update
 ERCOT Analysis of the Impacts of the Clean Power Plan Final Rule Update ERCOT Public October 16, 2015 ERCOT Analysis of the Impacts of the Clean Power Plan Final Rule Update In August 2015, the U.S. Environmental
Finding a green engine for economic growth China s renewable energy policies
 Low Carbon Green Growth Roadmap for Asia and the Pacific CASE STUDY Finding a green engine for economic growth China s renewable energy policies Key points China s renewable energy industry has been elevated
Energy Projections 2006 2030 Price and Policy Considerations. Dr. Randy Hudson Oak Ridge National Laboratory
 Energy Projections 2006 2030 Price and Policy Considerations Dr. Randy Hudson Oak Ridge National Laboratory There is perhaps no single current topic so potentially impacting to all life on this planet
CHINA 2050 HIGH RENEWABLE ENERGY PENETRATION SCENARIO AND RODAMAP STUDY
 国 家 发 展 和 改 革 委 员 会 能 源 研 究 所 Energy Research Institute National Development and Reform Commission CHINA 2050 HIGH RENEWABLE ENERGY PENETRATION SCENARIO AND RODAMAP STUDY CHINA NATIONAL RENEWABLE ENERGY
Energy and Consumer Impacts of EPA s Clean Power Plan. Prepared for the American Coalition for Clean Coal Electricity
 Energy and Consumer Impacts of EPA s Clean Power Plan Prepared for the American Coalition for Clean Coal Electricity Contents Executive Summary Overview of the Clean Power Plan NERA Methodology Baseline
Energy storage in the UK and Korea: Innovation, Investment and Co-operation Appendix 4.1: Stakeholder interviews from Korea
 Energy storage in the UK and Korea: Innovation, Investment and Co-operation Appendix.1: Stakeholder interviews from Korea Peter Taylor & Lloyd Davies, University of Leeds Appendix.1: Stakeholder interviews
Busting Myths about Renewable Energy
 Symposium on Renewable Energy: the Future for Australia, UNSW 15 April 2014 Busting Myths about Renewable Energy Dr Mark Diesendorf Institute of Environmental Studies University of New South Wales Sydney,
Electricity Sources. Coal Fleet
 This paper is called Coal Facts because it provides factual information and data related to coal-based electricity. Most of the data are taken from independent third party sources, such as the Energy Information
Argentina Energy efficiency report
 Argentina Energy efficiency report Objectives: o 5.4% energy savings in industry in 216 o 6% electricity savings in 216 Overview 2- (%/year) Primary intensity (EU=1)¹ 16 - -2.3% + CO 2 intensity (EU=1)
CHILE LEVELISED COST OF ENERGY
 CHILE LEVELISED COST OF ENERGY PRESENTED TO NRDC TYLER TRINGAS, ENERGY ECONOMICS APRIL 2011 Chile Levelised Cost of Energy, April 2011 1 CONTENTS Introduction Objectives Levelised Cost of Energy Model
Financing Energy Efficiency and Renewable Energy through the India Renewable Energy Development Agency
 RENEWABLE ENERGY INDUSTRIAL ENERGY EFFICIENCY BUILDING ENERGY EFFICIENCY Financing Energy Efficiency and Renewable Energy through the India Renewable Energy Development Agency A RANGE OF FINANCIAL SUPPORT
SECTION 1. PREAMBLE 3 SECTION 2. EXECUTIVE SUMMARY 4 ABOUT US 6
 CONTENTS SECTION 1. PREAMBLE 3 SECTION 2. EXECUTIVE SUMMARY 4 ABOUT US 6 Disclaimer notice on page 8 applies throughout. Page 2 SECTION 1. PREAMBLE The New Energy Outlook (NEO) is Bloomberg New Energy
Status of China s regional trading programs: progress and challenge
 Status of China s regional trading programs: progress and challenge Fei TENG Institute of Energy, Environment and Economy, Tsinghua University 2013 Aug 13-15 Contents Background Pilot project at local
China Energy efficiency report
 China Energy efficiency report Objective: 16% reduction in primary energy intensity by 215 Overview 211-211 (%/year) Primary intensity (EU=1)¹ 222 -- -2.8% ++ CO 2 intensity (EU=1) 294 -- -2.5% + CO 2
GENERATION TECHNOLOGY ASSESSMENT
 SPO PLANNING ANALYSIS GENERATION TECHNOLOGY ASSESSMENT Technology Cost & Performance Milestone 2 Public Technical Conference OCTOBER 30, 2014 NOTE: ALL IRP MATERIALS ARE PRELIMINARY & SUBJECT TO CHANGE
Offshore Wind: some of the Engineering Challenges Ahead
 Offshore Wind: some of the Engineering Challenges Ahead David Infield CDT in Wind Energy Systems Institute of Energy and Environment University of Strathclyde International context (from IPCC report) Greenhouse
Critical Policy Options to Protect Industry Competitiveness
 Critical Policy Options to Protect Industry Competitiveness Graham Weale Chief Economist, RWE AG IEA Energy Business Council Meeting, Paris 4 th June 2013 RWE Group a leading European energy utility >
Clean Energy Jobs Plan
 Clean Energy Jobs Plan Introduction When I was governor, California was the world leader in renewable energy and it led the nation in efficiency standards. Our programs saved California consumers billions
L A Z A R D ' S L E V E L I Z E D C O S T O F E N E R G Y A N A L Y S I S V E R S I O N 9. 0
 C O N F I D E N T I A L N O V E M B E R 2 0 1 5 L A Z A R D ' S L E V E L I Z E D C O S T O F E N E R G Y A N A L Y S I S V E R S I O N 9. 0 L A Z A R D ' S L E V E L I Z E D C O S T O F E N E R G Y A
Levelized Cost and Levelized Avoided Cost of New Generation Resources in the Annual Energy Outlook 2015
 June 2015 Levelized Cost and Levelized Avoided Cost of New Generation Resources in the Annual Energy Outlook 2015 This paper presents average values of levelized costs for generating technologies that
The Future of Energy. Prof. Wesley Henderson Dept. Chemical & Biomolecular Engineering NC State University. Seminar 2
 The Future of Energy Prof. Wesley Henderson Dept. Chemical & Biomolecular Engineering NC State University Seminar 2 Outline of Lectures Seminar 1: Energy & Electricity Use in the U.S. Peak Oil? Clean Coal
Photovoltaik und globale Energieversorgung
 11/05/2011 EKZ Elektrizitätswerke des Kantons Zürich 1 Photovoltaik und globale Energieversorgung Arnulf Jäger-Waldau European Commission, DG JRC, Ispra Institute for Energy Renewable Energies Disclaimer
NEVADA S ELECTRIC POWER SYSTEM AND THE CLEAN POWER PLAN
 ADVANCED ENERGY ECONOMY the business voice of advanced energy NEVADA S ELECTRIC POWER SYSTEM AND THE CLEAN POWER PLAN The U.S. Environmental Protection Agency (EPA) will soon release the final rule for
Some micro- and macro-economics of offshore wind*
 Some micro- and macro-economics of offshore wind* EPSRC SUPERGEN Wind Energy Hub University of Strathclyde May 2016 Fraser of Allander Institute Energy Modelling Team Fraser of Allander Institute Department
RENEWABLE ENERGY IN AUSTRALIA
 RENEWABLE ENERGY IN AUSTRALIA Increasing electricity generation from renewable energy sources is one of the main strategies to reduce greenhouse emissions from the power sector. Australia has historically
A macro-economic viewpoint. What is the real cost of offshore wind? siemens.com / wind
 A macro-economic viewpoint What is the real cost of offshore wind? siemens.com / wind in the cost debate A broader view of the value of renewables. Globally, installed power generation capacity currently
WORLD ENERGY OUTLOOK 2012 FACTSHEET How will global energy markets evolve to 2035?
 How will global energy markets evolve to 2035? Taking all new developments and policies into account, the world is still failing to put the global energy system onto a more sustainable path. The New Policies
WORLD ENERGY INVESTMENT OUTLOOK 2014 FACTSHEET OVERVIEW
 OVERVIEW More than $1.6 trillion was invested in 2013 in energy supply, a figure that has more than doubled in real terms since 2000, and a further $130 billion to improve energy efficiency. Renewables
Overview on SEA output
 1 st SEA workshop of the revised PDP VII Overview on SEA output of Project N a t i o n a l P o w e r D e v e l o p m e n t P l a n p e r i o d 2 0 11-2 0 2 0, v i s i o n 2 0 3 0 ( P D P V I I ) P r e
NEW NUCLEAR POWER PLANT UNIT IN FINLAND ACCEPTED BY THE FINNISH PARLIAMENT
 International Conference Nuclear Energy for New Europe 2002 Kranjska Gora, Slovenia, September 9-12, 2002 www.drustvo-js.si/gora2002 NEW NUCLEAR POWER PLANT UNIT IN FINLAND ACCEPTED BY THE FINNISH PARLIAMENT
Making Coal Use Compatible with Measures to Counter Global Warming
 Making Use Compatible with Measures to Counter Global Warming The J-POWER Group is one of the biggest coal users in Japan, consuming approximately 2 million tons of coal per year at eight coal-fired power
Sweden Energy efficiency report
 Sweden Energy efficiency report Objectives: o 41 TWh of end use energy savings in 216 o 2 reduction in total energy intensity by 22 Overview - (%/year) Primary intensity (EU=1)¹ 124 - -1.8% + CO 2 intensity
Fiscal Year 2011 Resource Plan
 Salt River Project Fiscal Year 2011 Resource Plan Page 1 Last summer SRP hosted three resource planning workshops for a diverse group of stakeholders and customers to explain the planning process, discuss
UK renewable energy an update
 UK renewable energy an update 30 October 2014 Robert Hull, Managing Director Renewable energy key challenges 1 2 3 Costs to Climate change: Risks to security consumers: decarbonising of supply: short affordability
Implications of Abundant Natural Gas
 Implications of Abundant Natural Gas JAE EDMONDS AND HAEWON MCJEON APRIL 2013 May 29, 2013 1 Background May 29, 2013 2 The natural gas revolution The application of technologies for accessing unconventional
World Energy Outlook 2007: China and India Insights. www.worldenergyoutlook.org International Energy Agency
 World Energy Outlook 27: China and India Insights www.worldenergyoutlook.org International Energy Agency Why Focus on China & India? Increase in World Primary Energy Demand, Imports & Energy-Related CO
Annual Electricity and Heat Questionnaire
 Annual Electricity and Heat Questionnaire IEA Statistics Course Pierre Boileau International Energy Agency OVERVIEW Global trends in electricity production 1973-2009 IEA Annual Electricity and Heat Questionnaire
The Economics of Nuclear Power: Is New Nuclear Competitive?
 The Economics of Nuclear Power: Is New Nuclear Competitive? Craig A. Severance CPA Author, Business Risks and Costs of New Nuclear Power (2009) Co-Author, The Economics of Nuclear and Coal Power (1976)
Danish Energy Model RE Policy Tools MAIN Asian Dialog, Bali January 20-22 2014. Mr. Henrik Breum Special Advisor
 Danish Energy Model RE Policy Tools MAIN Asian Dialog, Bali January 20-22 2014 Mr. Henrik Breum Special Advisor Agenda Danish Energy Model RE Policy Tools Introduction The Danish Energy Model Past, now
Comparison of CO 2 Abatement Costs in the United States for Various Low and No Carbon Resources. Total System Levelized Cost Based on EIA LCOE
 Comparison of CO 2 Abatement Costs in the United States for Various Low and No Carbon Resources Every year the Energy Information Administration (EIA) publishes its Annual Energy Outlook (AEO). In the
WIND AND SOLAR ENERGY DEVELOPMENTS IN IRAN
 WIND AND SOLAR ENERGY DEVELOPMENTS IN IRAN H. Kazemi Karegar a,b, A.Zahedi a,v. Ohis a, G. taleghani b and M. Khalaji b a Department of Electrical & Computer Systems Engineering, PO Box 35, Monash University,
Energy Productivity & Pricing
 Energy Productivity & Pricing Markets for energy, renewable energy and carbon Dr Jenny Riesz February 2014 2 Average electricity retail prices Electricity price rises CSIRO Future Grid (2013) Change and
FINDING YOUR CHEAPEST WAY TO A LOW CARBON FUTURE. The Danish Levelized Cost of Energy Calculator
 FINDING YOUR CHEAPEST WAY TO A LOW CARBON FUTURE The Danish Levelized Cost of Energy Calculator Low carbon transition is a multifaceted challenge involving political, technical and economic elements. Denmark
Germany's energy transition: Status quo and Challenges.
 Ulrich Benterbusch Germany's energy transition: Status quo and Challenges. 2 nd Session Group of Experts on Renewable Energy, UNECE, Geneva 1 Agenda. Energy transition: Status quo and official goals. German
How to Earn the LEED Green Power Credit
 3D EG REES WH ITE PAPER How to Earn the LEED Green Power Credit Using on-site and off-site renewable energy to mitigate the impact of greenhouse gas emissions associated with a LEED project s energy use
SOLAR ELECTRICITY: PROBLEM, CONSTRAINTS AND SOLUTIONS
 SOLAR ELECTRICITY: PROBLEM, CONSTRAINTS AND SOLUTIONS The United States generates over 4,110 TWh of electricity each year, costing $400 billion and emitting 2.5 billion metric tons of carbon dioxide (Yildiz,
RE-POWERING MARKETS Market design and regulation during the transition to low-carbon power systems
 RE-POWERING MARKETS Market design and regulation during the transition to low-carbon power systems EC-IEA Roundtatble on electricity market design and regulation Brussels, 18 February 2016 Power markets
Integrating End-User and Grid Focused Batteries and Long-Term Power-to-Gas Storage for Reaching a 100 % Renewable Energy Supply
 Integrating End-User and Grid Focused Batteries and Long-Term Power-to-Gas Storage for Reaching a 100 % Renewable Energy Supply M. Hlusiak, Ch. Breyer 7 th International Renewable Energy Storage Conference
ENERGY SECTOR JOBS TO 2030: A GLOBAL ANALYSIS
 ENERGY SECTOR JOBS TO : A GLOBAL ANALYSIS Final report For Greenpeace International Authors Jay Rutovitz, Alison Atherton Institute for Sustainable Futures UTS 2009 Disclaimer While all due care and attention
Distributed Generation: Frequently Asked Questions
 Distributed Generation: Frequently Asked Questions 1) What is distributed generation (DG)? Generating technologies located close to where the electricity is being used that are connected to the electric
FINANCING OF LOW-CARBON ENERGY TECHNOLOGIES
 FINANCING OF LOW-CARBON ENERGY TECHNOLOGIES Juan Alario Associate Director Head of Division, Energy Efficiency and Renewables European Investment Bank (EIB) III International Conference on Energy Innovation
For an inclusive business model in Sub-Saharan Africa: The case of renewable energy
 For an inclusive business model in Sub-Saharan Africa: The case of renewable energy To address the economic, social and environmental challenges of the energy situation of Africa, GreenWish is developing
SUSTAINABLE ENERGY BLUEPRINT
 SUSTAINABLE ENERGY BLUEPRINT A PLAUSIBLE STRATEGY FOR ACHIEVING A NO-NUCLEAR, LOW- CARBON, HIGHLY-EFFICIENT AND SUSTAINABLE ENERGY FUTURE The following statement outlines an ambitious but doable strategy
Portfolio Manager and Green Power Tracking
 Building owners and operators can buy green power products as a way of reducing the environmental impacts associated with purchased electricity use in their facilities. The Environmental Protection Agency
CRS Report Summaries WORKING DRAFT
 CRS Report Summaries R40147 Green Buildings This is a definition and analysis of the cost and benefits of green buildings. It also cites agencies and laws that encourage the building of environmentally
Renewable Energy Promotion Policies in Chinese Taipei
 Renewable Energy Promotion Policies in Chinese Taipei Bureau of Energy, Ministry of Economic Affairs Chinese Taipei November 12, 2014 RE for CT - 1 Current Development of Renewables in Chinese Taipei RE
H1 2014 LEVELISED COST OF ELECTRICITY - PV
 H1 2014 LEVELISED COST OF ELECTRICITY - PV JENNY CHASE 4 FEBRUARY 2014 LCOE OF PV, FEBRUARY 2014 1 PV EXPERIENCE CURVE, 1976-2013 (2013 $/W) 100 Cost per W (2013 $) 1976 10 1985 2003 2006 1 2012 2013 Q3
KAYA IDENTITY ANALYSIS OF DECARBONIZATION OF THE NY ECONOMY REQUIRED FOR CLIMATE ACTION PLAN GOAL OF 40% REDUCTION BY 2030
 KAYA IDENTITY ANALYSIS OF DECARBONIZATION OF THE NY ECONOMY REQUIRED FOR CLIMATE ACTION PLAN GOAL OF 40% REDUCTION BY 2030 Roger Caiazza Not representing EEANY DISCLAIMERS The following analysis does not
1: Levelized Cost of Energy Calculation. Methodology and Sensitivity
 1: Levelized Cost of Energy Calculation Methodology and Sensitivity What is LCOE? Levelized Cost of Energy (LCOE) is the constant unit cost (per kwh or MWh) of a payment stream that has the same present
Sustainable and Renewable Energy Development Authority (SREDA) of Bangladesh Role and Responsibility
 of Bangladesh Role and Responsibility") Sustainable and Renewable Energy Development Authority (SREDA) of Bangladesh Role and Responsibility Welcome to SREDA Siddique Zobair Member (EE & C) Sustainable & Renewable Energy Development Authority
Sustainable and Renewable Energy Development Authority (SREDA) of Bangladesh Role and Responsibility Welcome to SREDA Siddique Zobair Member (EE & C) Sustainable & Renewable Energy Development Authority
Hungary Energy efficiency report
 Hungary Energy efficiency report Objectives: o 1.4 Mtoe of end-user energy savings by 216, including 312 ktoe in industry o 1.9 Mtoe of primary energy savings by 23, including around 4% in the power sector
From today s systems to the future renewable energy systems. Iva Ridjan US-DK summer school AAU Copenhagen 17 August 2015
 From today s systems to the future renewable energy systems Iva Ridjan US-DK summer school AAU Copenhagen 17 August 2015 STRUCTURE OF ENERGY SYSTEMS 8/17/2015 Copenhagen, Denmark 2 Components Demand Heat
Projected Costs of Generating Electricity
 Executive Summary Projected Costs of Generating Electricity 2015 Edition Projected Costs of Generating Electricity 2015 Edition INTERNATIONAL ENERGY AGENCY NUCLEAR ENERGY AGENCY ORGANISATION FOR ECONOMIC
SMARTGRID Roadmap 1.
 SMARTGRID Roadmap 1. Introduction to the Smart Grid Roadmap to 25 Ireland faces the same long term energy challenges as the rest of the world: a need to move towards competitively priced, environmentally
Analysis of electricity production in EU-28 up to 2014 with a focus on renewables
 Renewables International. www.renewablesinternational.net Analysis of electricity production in EU-28 up to 2014 with a focus on renewables Bernard CHABOT BCCONSULT, Garbejaire B107, 06560 VALBONNE, France
Financing New Coal-Fired Power Plants
 Financing New Coal-Fired Power Plants Guidance Note 2011 Coal is likely to be part of the energy mix for the foreseeable future. Therefore, to limit dangerous climate change, coal-fired power generation
Energy Efficiency Indicators for Public Electricity Production from Fossil Fuels
 international energy agency agence internationale de l energie Energy Efficiency Indicators for Public Electricity Production from Fossil Fuels IEA Information paper In Support of the G8 Plan of Action
Increasing Costs in Electric Markets
 Increasing Costs in Electric Markets Item No.: A-3A June 19, 2008 Mr. Chairman and Commissioners, good morning. I am here to present the Office of Enforcement s assessment of likely electricity costs in