Weather Radar Basics
|
|
|
- Jacob Hunt
- 10 years ago
- Views:
Transcription
1 Weather Radar Basics
2 RADAR: Radio Detection And Ranging Developed during World War II as a method to detect the presence of ships and aircraft (the military considered weather targets as noise) Since WW II, there have been many advances in radar technology (e.g., Doppler techniques) and it s used on land, sea, and in space for both research and operational needs
 and it s used on land, sea, and in space for both research")
3 Feedhorn Anatomy of a Weather Radar Antenna Radome Photo by D. Zrnic Receiver Transmitter Transmitter - generates the microwave signal of the correct phase and amplitude. For a weather radar, the wavelength of the signal is ~ 10cm Antenna - the main purpose of the antenna (also called the dish ) is to focus the transmitted power into a small beam and also to listen and collect the returned signal Feedhorn - directs the signal from the transmitter onto the antenna (also directs the return signal from the antenna to the receiver) Receiver - detects the signal returned from a target Radome - protects the antenna from high winds

4 Weather Radar Scanning For a radar to find a target of interest (e.g., a cloud), 3 pieces of information are needed: Azimuth angle (direction relative to north) Elevation angle (angle above the ground) Images on this p age made availab le from the University of Illinois W W 2010 Project Distance to the target of interest
, 3 pieces of information are needed: Azimuth angle (direction")
5 Weather Radar Scanning In meteorology, radars usually employ one of two scanning techniques: Plan Position Indicator (PPI): The radar holds its elevation angle constant but varies its azimuth angle. If the radar rotates through 360 degrees, the scan is called a "surveillance scan". If the radar rotates through less than 360 degrees, the scan is called a "sector scan". Range Height Indicator (RHI): the radar holds its azimuth angle constant but varies its elevation angle. The elevation angle normally is rotated from near the horizon to near the zenith (the point in the sky directly overhead). Images from the University of Illinois WW2010 Project We are most concerned with the PPI scan. The Weather Service radars operate by collecting a series of surveillance scans at increasing elevation angles. It takes the radar ~ 5 minutes to collect the data, depending on how many elevation angles are used. The radar then repeats the cycle.
.")
6 Applications of Weather Radar: National Weather Service Radar is an important component in the arsenal of forecaster tools to understand both the current state of the atmosphere as well as what might happen in the near future. While satellite data gives a forecaster a sense of the big picture, radar provides more detail on at smaller scales of weather. NW S radar coverage NOAA GOES Visible image 29 September :15 UTC NWS NEXRAD (KABX) Radar Reflectivity 29 September :08 UTC

7 NWS Next Generation Weather Radar (NEXRAD) Sites D. Zrnic The NWS currently operates 158 NEXRAD sites across the US Significant improvements over older weather radar systems: Ability to see motion of air (precipitation) using Doppler effect Increased sensitivity and resolution allows observation of cold fronts, dry lines, and thunderstorm gust fronts
 using Doppler effect Increased sensitivity and resolution allows")
8 Weather Service forecasters use radar to help determine: the movement and trend of thunderstorms variability and concentration of precipitation There are two important aspects of radar that we re concerned with: Amount of energy scattered back from a target to the radar estimate the intensity of storms and the amount of precipitation Velocity of a target relative to the radar estimate air motions and circulations within clouds

9 How Does the Radar Sense a Target in the Atmosphere? Radars operate by sending out energy from a source and listening to the amount that is reflected (scattered) from targets Targets can be trees, cloud, bumblebees or anything else the radar pulse intercepts Weather radars utilize frequency of ~ 3000 MHz (10 cm wavelength) - radio waves The radar transmits short pulses of these radio waves at rate of ~ 1000 pulses/s Image from The USA TODAY Weather Book b y Jack Williams Each pulse is very short, lasting only about 1/1,000,000 s
 - radio waves The radar transmits short pulses of these radio waves at rate of ~ 1000 pulses/s Image from The USA TODAY")
10 After each pulse, there is a short period for radar to listen to the scattered signal from the target of interest The scattered signal is a result of energy from the transmitted pulse interacting with the target (snow, rain, hail, etc) A small portion of the transmitted power is returned to the radar (the echo), received by the antenna, and analyzed by the radar signal processor. Once that s done, precipitation rates can be determined (we ll talk about this in more detail later) Image from the University of Illinois WW2010 Project Image from the University of Illinois WW2010 Project
 Image from the University of Illinois WW2010")
11 Detecting Targets (continued) The return signal received by the radar is related to the diameter of the particles in our target echo: the bigger the particles the bigger the amount of return signal. It turns out that the target echo is related to the diameters of the precipitation particles in a very non-linear way: P r ~ D i 6 Increase particle diameter by factor of 2 P r increases by factor of 64 Increase particle diameter by factor of 3 P r increases by factor of 729

12 Detecting Targets (continued) The term D i 6 has a special name in radar meteorology: reflectivity factor (Z) Z can take on a tremendous range of values: (fog) - 50,000,000 (hail) To compress this into a more manageable range, define another parameter: dbz = 10log 10 (Z) dbz values are what you typically see on radar displays (e.g., on T.V.) Try this: What are the corresponding dbz values of fog and hail?
 dbz values are what you typically see on radar displays (e.g., on T.V.")
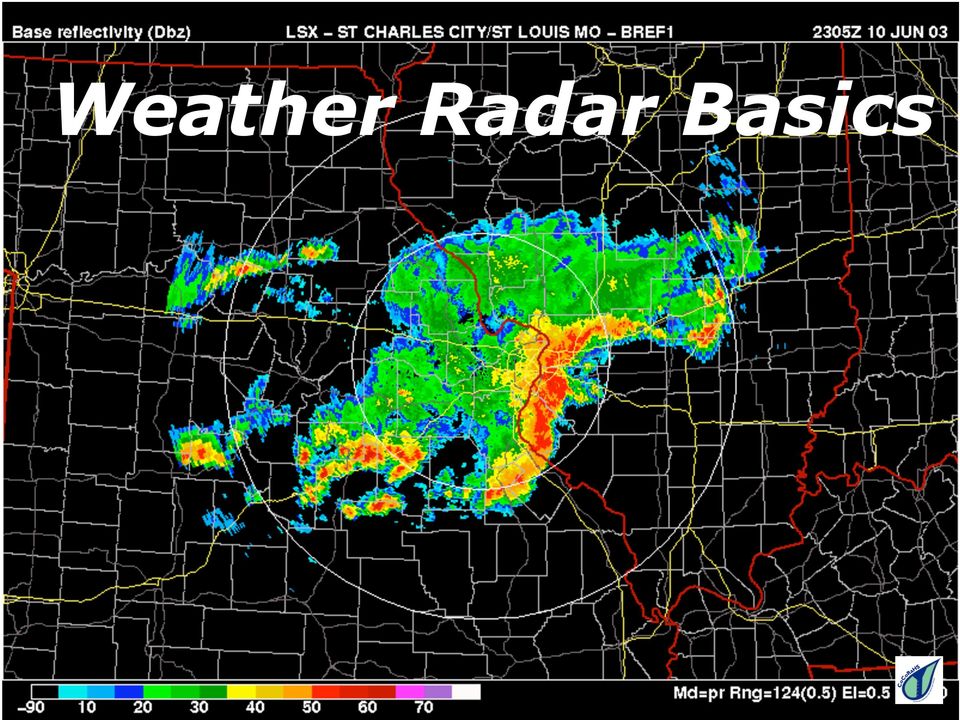
13 Radar Display Example Squall line thunderstorm Trailing stratiform region Direction of motion Convective line dbz NWS NEXRAD (KLSX) Radar Reflectivity 10 June UTC Squall lines are made up of a number of individual thunderstorms. Although the lifetime of an individual thunderstorm cell (identified as red areas in the radar echo pattern) may only be an hour or so, new cells continually regenerate along the convective line and the whole squall line system may last many hours or up to several days.

14 Questions to Consider 1. What do you notice about the echo pattern of the squall line? 2. Where are the largest particles (and likely the most intense precipitation) concentrated? 3. What features in the radar echo display distinguish the convective line from the trailing stratiform region? 4. Pick an averge dbz value from the convective line and trailing stratiform region and determine the corresponding Z values

15 Estimating Precipitation with Radar We saw earlier that the reflectivity factor (Z) is related to the size of precipitation particles in the radar echo. If we assume that our radar echo has a known distribution of precipitation particles (i.e., number of drops of different size categories), we can relate the reflectivity factor (Z) to the rainfall rate (R - mm/hr) in our echo feature: Z=A*R B (A and B are constants determined by the assumed drop size distribution) This kind of equation between reflectivity factor and rain rate is called a Z-R relation
 This kind of equation between reflectivity factor and rain rate is called a Z-R")
16 The NWS utilizes a single Z-R relation almost exclusively for all NEXRAD radar data around the US: Z=300*R 1.4 R=(Z/300) (1/1.4) Now, let s practice estimating rainfall from radar data: 1. Using our squall line example and the above NWS Z-R relationship, estimate an average rain rate in the convective line and stratiform regions 2. What assumption do we have to make in order to apply this Z-R relation in different part of the squall line?

17 As you ve probably noticed, the precipitation estimates from radar data don t always agree with rain gauges! Meteorologists have been working on this problem for over 50 years now. Why is it so difficult to compare rain gauge and radar measurements? Besides assumptions in the Z-R relation, there are a number of other complications: The radar samples precipitation in the cloud some distance above the ground. Particles may evaporate or otherwise be modified before they hit the surface. Clouds and precipitation frequently consist of a variety of particle types (e.g., ice and rain). Each particle interacts with the radar's energy in its own unique way.

18 Other factors complicating the comparison of radar and rain gauge estimates of precipitation The region sampled by the radar increases with distance. The wider the beam, the greater the likelihood of sampling a mixture of precipitation types, or the greater the likelihood of sampled both inside and outside of a cloud. ice crystalsnowflake hail ground clutter wind raindrop graupel evaporation Rain gauge Obstacles frequently block a portion of the radar beam, resulting in an artificially high power return.

19 Given all the issues, why use radar to measure precipitation? Radar is the only way to map the spatial distribution of precipitation over large areas Topography or other logistics may prevent locating gauges in many areas NWS NEXRAD (KGLD) Storm Total Precipitation 16 May :58 UTC Radar can be used as a forecasting tool for flash flooding and severe thunderstorms

20 Measuring Air Motion with Radar In addition to measuring the amount of signal returned from targets, NEXRAD radar has the added capability of being able to measure a frequency shift that is introduced into the reflected signal by the motion of the precipitation particles. This frequency shift is then used to determine wind speed (we assume that the particles are instantaneously moved around by the wind). The amount of shift can be determined by comparing the frequency of the transmit pulse with the frequency of the reflected pulse Particles moving toward the radar are shifted to higher frequency Images from The USA TODAY Weather Book b y Jack Williams Particles moving away from the radar are shifted to lower frequency

21 How Much Frequency Shift Does the Wind R Produce? The equation that determines how much frequency shift is Phase shift due to target produced by a moving target is: f t = 2V/ λ = Doppler frequency shift of target (this equation is derived on the next page) How does f t compare to the frequency of the wave transmitted by the radar? Questions to consider: 1. If the wind speed (V) = 10 m/s, what is the resulting frequency shift of the wind (assume λ = 10 cm for a weather radar)? 2. How does this frequency shift compare to the frequency of the radar wave? To figure this out, we need to determine the radar frequency: f r = V w / λ, where V w = c = the speed of light = 3 x 10 8 m/s
22 Deriving the Frequency Shift of Moving Target Total distance traversed by pulse = 2R Total distance in terms of λ = 2R/ λ Total distance in radians = (2R/ λ)*2π = 4πR/ λ Assume radar emits wave with phase = Ψ 0 Return wave phase to radar = Ψ R = Ψ 0 + 4πR/ λ Frequency shift (ω ) = Δ Ψ R / Δt = (4π/ λ)* ΔR/ Δt Setting ΔR/ Δt = V (velocity of target) and recalling that Δ Ψ R / Δt = ω = 2πf f t = 2V/ λ = Doppler frequency shift of target
23 Examples of Air Motions Detected with Doppler Radar The NWS utilizes the Doppler capability of the NEXRAD radars to detect storm circulations (e.g., tornados and hurricane spiral bands) as well as to identify air flow boundaries created by storms (e.g., outflows and microbursts). In cases when only one radar is available, the air motion that is detected is relative to the location of the radar: radar meteorologists call this radial velocity flow toward the radar is called inbound and flow away from the radar is called outbound. By convention, velocities toward the radar (inbound) are negative and velocities away from the radar (outbound) are positive. We ll consider two examples for the purposes of our discussion: tornados and microbursts
24 Example of a tornado observed by the CSU-CHILL radar The image on the left (a) shows the velocity signature seen on the CHILL radar display. The white arcs across the image represent range rings and show the distance from the radar to the echo of interest. The tornado is located at the T, marking the boundary of the outbound and inbound velocities. Note that in this case, the inbound velocities are so large that they are folded to positive values. Because another radar was also sampling this storm, the velocities from each radar could be combined to reconstruct the actual wind direction and speed relative to the ground. The image on the right (b) shows the actual wind vectors in the vicinity of the tornado (b) Velocity relative to ground (m/s) (a) Velocity relative to CHILL radar (m/s) T Radial velocity signature observed from the CSU-CHILL on 29 August :36 UTC. Negative (blue-green colors) represent flow toward the radar. Radial velocity vectors corresponding to (a). Color contours represent wind speed in m/s. Reflectivity contours are indicated by the solid lines.
25 Microbursts Microbursts are formed in regions where thunderstorm downdrafts are concentrated in a very small area (less than ~4 km in width). Microbursts can be wet or dry depending on the humidity of the air surrounding the thunderstorm. Dry microbursts are quite common in arid portions of the western U.S. Images from the University of Illinois WW2010 Project
26 Example of a microburst observed by the CSU-CHILL radar The images below show a fairly typical microburst signature on the radar display. The left image (a) shows the radar reflectivity (dbz) and the right image(b) shows the corresponding radial velocity (m/s) relative to the CHILL radar. In a microburst, the spreading out of the air near the ground surface is similar to turning a garden hose on and aiming the end toward the pavement. (a) Radar reflectivity (dbz) (b) Radial velocity (m/s) Flow toward radar Flow away from radar Radar reflectivity (dbz) observed from the CSU-CHILL on 27 June :27 UTC. Radial velocity signature observed from the CSU-CHILL on 27 June :27 UTC. Question to Consider: Draw a cartoon of a vertical slice through a microburst and describe how it would be an aviation hazard
WSR - Weather Surveillance Radar
 1 of 7 Radar by Paul Sirvatka College of DuPage Meteorology WSR - Weather Surveillance Radar It was learned during World War II that electromagnetic radiation could be sent out, bounced off an object and
SIXTH GRADE WEATHER 1 WEEK LESSON PLANS AND ACTIVITIES
 SIXTH GRADE WEATHER 1 WEEK LESSON PLANS AND ACTIVITIES WATER CYCLE OVERVIEW OF SIXTH GRADE WATER WEEK 1. PRE: Evaluating components of the water cycle. LAB: Experimenting with porosity and permeability.
Active and Passive Microwave Remote Sensing
 Active and Passive Microwave Remote Sensing Passive remote sensing system record EMR that was reflected (e.g., blue, green, red, and near IR) or emitted (e.g., thermal IR) from the surface of the Earth.
Regional Forecast Center Timişoara 15. Gh. Adam St., Timişoara, Romania, e-mail: [email protected]
 Analele UniversităŃii din Oradea Seria Geografie Tom XX, no. 2/2010 (December), pp 197-203 ISSN 1221-1273, E-ISSN 2065-3409 Article no. 202106-492 SOME DOPPLER RADAR FEATURES OF SEVERE WEATHER IN SUPERCELLS
Roelof Bruintjes, Sarah Tessendorf, Jim Wilson, Rita Roberts, Courtney Weeks and Duncan Axisa WMA Annual meeting 26 April 2012
 Aerosol affects on the microphysics of precipitation development in tropical and sub-tropical convective clouds using dual-polarization radar and airborne measurements. Roelof Bruintjes, Sarah Tessendorf,
Weather Help - NEXRAD Radar Maps. Base Reflectivity
 Weather Help - NEXRAD Radar Maps Base Reflectivity Base Reflectivity Severe Thunderstorm/Torna do Watch Areas 16 levels depicted with colors from dark green (very light) to red (extreme) that indicate
Introduction to the forecasting world Jukka Julkunen FMI, Aviation and military WS
 Boundary layer challenges for aviation forecaster Introduction to the forecasting world Jukka Julkunen FMI, Aviation and military WS 3.12.2012 Forecast for general public We can live with it - BUT Not
3.5 THREE-DIMENSIONAL HIGH-RESOLUTION NATIONAL RADAR MOSAIC
 3.5 THREE-DIMENSIONAL HIGH-RESOLUTION NATIONAL RADAR MOSAIC Jian Zhang 1, Kenneth Howard 2, Wenwu Xia 1, Carrie Langston 1, Shunxin Wang 1, and Yuxin Qin 1 1 Cooperative Institute for Mesoscale Meteorological
WEATHER AND CLIMATE practice test
 WEATHER AND CLIMATE practice test Multiple Choice Identify the choice that best completes the statement or answers the question. 1. What role does runoff play in the water cycle? a. It is the process in
Two primary advantages of radars: all-weather and day /night imaging
 Lecture 0 Principles of active remote sensing: Radars. Objectives: 1. Radar basics. Main types of radars.. Basic antenna parameters. Required reading: G: 8.1, p.401-40 dditional/advanced reading: Online
Storms Short Study Guide
 Name: Class: Date: Storms Short Study Guide Multiple Choice Identify the letter of the choice that best completes the statement or answers the question. 1. A(n) thunderstorm forms because of unequal heating
FORENSIC WEATHER CONSULTANTS, LLC
 SAMPLE, CONDENSED REPORT DATES AND LOCATIONS HAVE BEEN CHANGED FORENSIC WEATHER CONSULTANTS, LLC Howard Altschule Certified Consulting Meteorologist 1971 Western Avenue, #200 Albany, New York 12203 518-862-1800
Radar Systems Engineering Lecture 6 Detection of Signals in Noise
 Radar Systems Engineering Lecture 6 Detection of Signals in Noise Dr. Robert M. O Donnell Guest Lecturer Radar Systems Course 1 Detection 1/1/010 Block Diagram of Radar System Target Radar Cross Section
A.4 SEVERE WEATHER PLAN
 Page 1 of 5 A.4 SEVERE WEATHER PLAN 1.0 Purpose 1.1 The purpose of this Severe Weather Response Plan is to minimize the impact on the University from a severe weather incident 2.0 Applicability 2.1 This
Technical Attachment. The National Weather Service Estimated Actual Velocity Radar Tool. Ken Falk WFO Shreveport, Louisiana
 SRH STSD 2007-03 October 2007 Technical Attachment The National Weather Service Estimated Actual Velocity Radar Tool 1. Introduction Ken Falk WFO Shreveport, Louisiana A radar analysis tool has been introduced
Development of an Integrated Data Product for Hawaii Climate
 Development of an Integrated Data Product for Hawaii Climate Jan Hafner, Shang-Ping Xie (PI)(IPRC/SOEST U. of Hawaii) Yi-Leng Chen (Co-I) (Meteorology Dept. Univ. of Hawaii) contribution Georgette Holmes
v = fλ PROGRESSIVE WAVES 1 Candidates should be able to :
 PROGRESSIVE WAVES 1 Candidates should be able to : Describe and distinguish between progressive longitudinal and transverse waves. With the exception of electromagnetic waves, which do not need a material
Networking Break 3:00 pm 3:30 pm
 Networking Break 3:00 pm 3:30 pm Sponsored by: Track D: Claims Technology & Innovation Forensic Meteorology: How Weather Experts, Advanced Data and Computer Models Are Now Being Used For Claims Investigations
Name Period 4 th Six Weeks Notes 2015 Weather
 Name Period 4 th Six Weeks Notes 2015 Weather Radiation Convection Currents Winds Jet Streams Energy from the Sun reaches Earth as electromagnetic waves This energy fuels all life on Earth including the
Antennas & Propagation. CS 6710 Spring 2010 Rajmohan Rajaraman
 Antennas & Propagation CS 6710 Spring 2010 Rajmohan Rajaraman Introduction An antenna is an electrical conductor or system of conductors o Transmission - radiates electromagnetic energy into space o Reception
WeatherBug Vocabulary Bingo
 Type of Activity: Game: Interactive activity that is competitive, and allows students to learn at the same time. Activity Overview: WeatherBug Bingo is a fun and engaging game for you to play with students!
Lecture 7a: Cloud Development and Forms
 Lecture 7a: Cloud Development and Forms Why Clouds Form Cloud Types (from The Blue Planet ) Why Clouds Form? Clouds form when air rises and becomes saturated in response to adiabatic cooling. Four Ways
Precipitation Remote Sensing
 Precipitation Remote Sensing Huade Guan Prepared for Remote Sensing class Earth & Environmental Science University of Texas at San Antonio November 14, 2005 Outline Background Remote sensing technique
Anticyclones, depressions, hot & drought, cold & snow
 AS/A2-Level Geography Anticyclones, depressions, hot & drought, cold & snow Learning Objectives: To describe and explain the weather associated with high and low pressure systems and their links to extreme
Group Session 1-3 Rain and Cloud Observations
 Group Session 1-3 Rain and Cloud Observations Targets in Science Plans CINDY Science Plan (Apr. 2009) DYNAMO SPO (Jul. 2009) Atmospheric Research a. Preconditioning processes b. Rossby wave c. Diabatic
COLLATED QUESTIONS: ELECTROMAGNETIC RADIATION
 COLLATED QUESTIONS: ELECTROMAGNETIC RADIATION 2011(2): WAVES Doppler radar can determine the speed and direction of a moving car. Pulses of extremely high frequency radio waves are sent out in a narrow
In a majority of ice-crystal icing engine events, convective weather occurs in a very warm, moist, tropical-like environment. aero quarterly qtr_01 10
 In a majority of ice-crystal icing engine events, convective weather occurs in a very warm, moist, tropical-like environment. 22 avoiding convective Weather linked to Ice-crystal Icing engine events understanding
Finnish Meteorological Institute s Services for Insurance Sector
 Finnish Meteorological Institute s Services for Insurance Sector Regional training workshop Role of the NMHSs in support of DRR- related activities in the field of insurance Janne Miettinen, Account Manager,
Comparison of visual observations and automated ceilometer cloud reports at Blindern, Oslo. Anette Lauen Borg Remote sensing MET-Norway
 Comparison of visual observations and automated ceilometer cloud reports at Blindern, Oslo Anette Lauen Borg Remote sensing MET-Norway A test of our ceilometer data To fully exploit our new ceilometer
Basics of weather interpretation
 Basics of weather interpretation Safety at Sea Seminar, April 2 nd 2016 Dr. Gina Henderson Oceanography Dept., USNA [email protected] Image source: http://earthobservatory.nasa.gov/naturalhazards/view.php?id=80399,
NOAA s National Weather Service Milwaukee/Sullivan
 NOAA s National Weather Service Milwaukee/Sullivan Marcia Cronce Meteorologist, Aviation Focal Point August 2014 weather.gov/milwaukee NWS Part of the Federal Government DOC - Department of Commerce NOAA
Making Aviation Safer: Results of the National Aviation Weather Program s 10-Year Goal to Reduce Weather- Related Accidents by 80 Percent
 1 Making Aviation Safer: Results of the National Aviation Weather Program s 10-Year Goal to Reduce Weather- Related Accidents by 80 Percent Friends/Partners of Aviation Weather October 9, 2008 Jud Stailey,
How to use and interpret Doppler weather radar
 How to use and interpret Doppler weather radar A novice guide to understanding the principles of radar and how to use base reflectivity and base velocity to show that more than rain and wind is occurring
Radar Measurement of Rain Storage in a Deciduous Tree
 39 Chapter 3 Radar Measurement of Rain Storage in a Deciduous Tree Joost de Jong, Henk de Groot, Wim Klaassen, and Piet Kuiper Abstract. The potential of radar to estimate the amount of rain, stored in
A model to observation approach to evaluating cloud microphysical parameterisations using polarimetric radar
 A model to observation approach to evaluating cloud microphysical parameterisations using polarimetric radar Monika Pfeifer G. Craig, M. Hagen, C. Keil Polarisation Doppler Radar POLDIRAD Rain Graupel
Hurricanes. Characteristics of a Hurricane
 Hurricanes Readings: A&B Ch. 12 Topics 1. Characteristics 2. Location 3. Structure 4. Development a. Tropical Disturbance b. Tropical Depression c. Tropical Storm d. Hurricane e. Influences f. Path g.
Nowcasting: analysis and up to 6 hours forecast
 Nowcasting: analysis and up to 6 hours forecast Very high resoultion in time and space Better than NWP Rapid update Application oriented NWP problems for 0 6 forecast: Incomplete physics Resolution space
Deployment of the X-band dual polarization phased array radar in the Dallas-Forth Worth Urban Demonstration Network
 ERAD 2014 - THE EIGHTH EUROPEAN CONFERENCE ON RADAR IN METEOROLOGY AND HYDROLOGY Deployment of the X-band dual polarization phased array radar in the Dallas-Forth Worth Urban Demonstration Network Krzysztof
Flight Operations Briefing Notes
 Flight Operations Briefing Notes I Introduction Although more and more aircraft are equipped with one or two airborne weather radars, incursions into very active cumulonimbus still occur, resulting in
Heat Transfer and the Movement of Air
 LESSON 4 Heat Transfer and the Movement of Air INTRODUCTION How can a hang glider stay up in the air for hours without a motor? How can a bird soar over an open field without flapping its wings? They can
A Microwave Retrieval Algorithm of Above-Cloud Electric Fields
 A Microwave Retrieval Algorithm of Above-Cloud Electric Fields Michael J. Peterson The University of Utah Chuntao Liu Texas A & M University Corpus Christi Douglas Mach Global Hydrology and Climate Center
Activity 4 Clouds Over Your Head Level 1
 Activity 4 Clouds Over Your Head Level 1 1 Objectives: Students will become familiar with the four main types of clouds: stratus, cirrus, cumulus, and cumulonimbus and their characteristics. Students will
RPG MWR PRO TN03 2012 09 Page 1 / 12 www.radiometer physics.de Radiometer Physics GmbH +49 2225 99981 0
 Applications Tropospheric profiling of temperature, humidity and liquid water High resolution boundary layer temperature profiles, better resolution than balloons Input for weather and climate models (data
Partnerships Implementing Engineering Education Worcester Polytechnic Institute Worcester Public Schools
 Partnerships Implementing Engineering Education Worcester Polytechnic Institute Worcester Public Schools Supported by: National Science Foundation Weather: 4.H.3 Weather and Classical Instruments Grade
Cloud seeding. Frequently Asked Questions. What are clouds and how are they formed? How do we know cloud seeding works in Tasmania?
 What are clouds and how are they formed? Clouds are composed of water droplets and sometimes ice crystals. Clouds form when air that is rich in moisture near the Earth s surface rises higher into the atmosphere,
ESCI 107/109 The Atmosphere Lesson 2 Solar and Terrestrial Radiation
 ESCI 107/109 The Atmosphere Lesson 2 Solar and Terrestrial Radiation Reading: Meteorology Today, Chapters 2 and 3 EARTH-SUN GEOMETRY The Earth has an elliptical orbit around the sun The average Earth-Sun
P2.15 A Data Quality Comparison of the WSR-88D Legacy Radar Data Acquisition (RDA) to the Open RDA (ORDA), in a Challenging Clutter Regime
 to the Open RDA (ORDA), in a Challenging Clutter Regime") P2.15 A Data Quality Comparison of the WSR-88D Legacy Radar Data Acquisition (RDA) to the Open RDA (ORDA), in a Challenging Clutter Regime Charles A. Ray* RS Information Systems, Inc. Norman, OK 73072
P2.15 A Data Quality Comparison of the WSR-88D Legacy Radar Data Acquisition (RDA) to the Open RDA (ORDA), in a Challenging Clutter Regime Charles A. Ray* RS Information Systems, Inc. Norman, OK 73072
FOR SUBSCRIBERS ONLY! - TRIAL PASSWORD USERS MAY NOT REPRODUCE AND DISTRIBUTE PRINTABLE MATERIALS OFF THE SOLPASS WEBSITE!
 FOR SUBSCRIBERS ONLY! - TRIAL PASSWORD USERS MAY NOT REPRODUCE AND DISTRIBUTE PRINTABLE MATERIALS OFF THE SOLPASS WEBSITE! 1 NAME DATE GRADE 5 SCIENCE SOL REVIEW WEATHER LABEL the 3 stages of the water
Precipitation forms from water droplets or ice crystals.
 KEY CONCEPT Water falls to Earth s surface as precipitation. BEFORE, you learned Water moves between Earth's surface and the atmosphere Water vapor condenses into clouds NOW, you will learn How precipitation
Overview of the IR channels and their applications
 Ján Kaňák Slovak Hydrometeorological Institute [email protected] Overview of the IR channels and their applications EUMeTrain, 14 June 2011 Ján Kaňák, SHMÚ 1 Basics in satellite Infrared image interpretation
Mobile Computing. Chapter 5: Satellite Systems
 Mobile Computing Chapter 5: Satellite Systems Prof. Sang-Jo Yoo History of satellite communication 1945 Arthur C. Clarke publishes an essay about Extra Terrestrial Relays 1957 First satellite SPUTNIK by
Wind Field Observations with a Monostatic and Bistatic C-band Doppler Radar Network
 Wind Field Observations with a Monostatic and Bistatic C-band Doppler Radar Network Martin Hagen, DLR Oberpfaffenhofen Wind field and Doppler radar Doppler radar (and lidar) can only measure one component
MICROPHYSICS COMPLEXITY EFFECTS ON STORM EVOLUTION AND ELECTRIFICATION
 MICROPHYSICS COMPLEXITY EFFECTS ON STORM EVOLUTION AND ELECTRIFICATION Blake J. Allen National Weather Center Research Experience For Undergraduates, Norman, Oklahoma and Pittsburg State University, Pittsburg,
1. Specific Differential Phase (KDP)
") 1. Specific Differential Phase (KDP) Instructor Notes: Welcome to the dual polarization radar course. I am Clark Payne with the Warning Decision Training Branch. This lesson is part of the dual-pol products
1. Specific Differential Phase (KDP) Instructor Notes: Welcome to the dual polarization radar course. I am Clark Payne with the Warning Decision Training Branch. This lesson is part of the dual-pol products
Satellite Altimetry Missions
 Satellite Altimetry Missions SINGAPORE SPACE SYMPOSIUM 30 TH SEPTEMBER 2015 AUTHORS: LUCA SIMONINI/ ERICK LANSARD/ JOSE M GONZALEZ www.thalesgroup.com Table of Content General Principles and Applications
How To Use A Karlsruhe Doppler Lidar
 Andreas Wieser Institut für Meteorologie und Klimaforschung Forschungsbereich Troposphäre (IMK-TRO) First measurements with the new Karlsruhe Doppler Lidar June 03, 2004 Forschungszentrum Karlsruhe we
UTILIZING GOOGLE EARTH AS A GIS PLATFORM FOR WEATHER APPLICATIONS
 UTILIZING GOOGLE EARTH AS A GIS PLATFORM FOR WEATHER APPLICATIONS Travis M. Smith 1,2 and Valliappa Lakshmanan 1,2 1 U. of Oklahoma/CIMMS; 2 NOAA/NSSL 1. Introduction Google Earth (formerly known as Keyhole;
Thunderstorm Basics. Updraft Characteristics (Rising Air) Downdraft Characteristics (Air Descends to the Ground)
 Downdraft Characteristics (Air Descends to the Ground)") Thunderstorm Basics Updraft Characteristics (Rising Air) Cumulus Tower Upward Cloud Motion Updraft Dominant Downdraft/Updraft Downdraft Dominant Rain-Free Base Downdraft Characteristics (Air Descends to
Thunderstorm Basics Updraft Characteristics (Rising Air) Cumulus Tower Upward Cloud Motion Updraft Dominant Downdraft/Updraft Downdraft Dominant Rain-Free Base Downdraft Characteristics (Air Descends to
Joint Polar Satellite System (JPSS)
") Joint Polar Satellite System (JPSS) John Furgerson, User Liaison Joint Polar Satellite System National Environmental Satellite, Data, and Information Service National Oceanic and Atmospheric Administration
Joint Polar Satellite System (JPSS) John Furgerson, User Liaison Joint Polar Satellite System National Environmental Satellite, Data, and Information Service National Oceanic and Atmospheric Administration
ANALYSIS OF THUNDERSTORM CLIMATOLOGY AND CONVECTIVE SYSTEMS, PERIODS WITH LARGE PRECIPITATION IN HUNGARY. Theses of the PhD dissertation
 ANALYSIS OF THUNDERSTORM CLIMATOLOGY AND CONVECTIVE SYSTEMS, PERIODS WITH LARGE PRECIPITATION IN HUNGARY Theses of the PhD dissertation ANDRÁS TAMÁS SERES EÖTVÖS LORÁND UNIVERSITY FACULTY OF SCIENCE PhD
6.4 THE SIERRA ROTORS PROJECT, OBSERVATIONS OF MOUNTAIN WAVES. William O. J. Brown 1 *, Stephen A. Cohn 1, Vanda Grubiši 2, and Brian Billings 2
 6.4 THE SIERRA ROTORS PROJECT, OBSERVATIONS OF MOUNTAIN WAVES William O. J. Brown 1 *, Stephen A. Cohn 1, Vanda Grubiši 2, and Brian Billings 2 1 National Center for Atmospheric Research, Boulder, Colorado.
MountainZebra: Real-Time Archival and 4D Visualization of Radar Volumes Over Complex Terrain
 MountainZebra: Real-Time Archival and D Visualization of Radar Volumes Over Complex Terrain Curtis James, Stacy Brodzik, Harry Edmon, Robert Houze, and Sandra Yuter Department of Atmospheric Sciences,
Primus 880 Weather Radar. Reliable Weather Avoidance Radar
 Primus 880 Weather Radar Reliable Weather Avoidance Radar Honeywell, the world s leader in avionics continues the development of weather radar systems with the Primus 880 featuring 10 kilowatts of transmitter
Airborne-Weather-Radar Interpretation Ian Gilbert
 Ian Gilbert This familiarisation is targeted for aircraft equipped with Honeywell weather radar. The fundamental principles are, however, applicable to all weather radars in all aircraft. Weather-Radar
Radar Signal Processing:
 Radar Signal Processing: Hardware Accelerator and Hardware Update First Semester Report Fall Semester 2007 by Michael Neuberg Christopher Picard Prepared to partially fulfill the requirements for ECE401
Pilot s Guide RDR 2000 Digital Weather Radar System B
 Pilot s Guide RDR 2000 Digital Weather Radar System B 006-08755-0001 Revision 3 a WARNING Information subject to the export control laws. This document, which includes any attachments and exhibits hereto,
Amplification of the Radiation from Two Collocated Cellular System Antennas by the Ground Wave of an AM Broadcast Station
 Amplification of the Radiation from Two Collocated Cellular System Antennas by the Ground Wave of an AM Broadcast Station Dr. Bill P. Curry EMSciTek Consulting Co., W101 McCarron Road Glen Ellyn, IL 60137,
Name: Date: LAB: Dew Point and Cloud Formation Adapted from Exploration in Earth Science, The Physical Setting, United Publishing Company, Inc.
 Name: _ Date: LAB: Dew Point and Cloud Formation Adapted from Exploration in Earth Science, The Physical Setting, United Publishing Company, Inc. Introduction: Cumulus clouds are our puffy fair weather
Temperature affects water in the air.
 KEY CONCEPT Most clouds form as air rises and cools. BEFORE, you learned Water vapor circulates from Earth to the atmosphere Warm air is less dense than cool air and tends to rise NOW, you will learn How
Analyze Weather in Cold Regions and Mountainous Terrain
 Analyze Weather in Cold Regions and Mountainous Terrain Terminal Learning Objective Action: Analyze weather of cold regions and mountainous terrain Condition: Given a training mission that involves a specified
Air Masses and Fronts
 Air Masses and Fronts Air Masses The weather of the United States east of the Rocky Mountains is dominated by large masses of air that travel south from the wide expanses of land in Canada, and north from
This chapter discusses: 1. Definitions and causes of stable and unstable atmospheric air. 2. Processes that cause instability and cloud development
 Stability & Cloud Development This chapter discusses: 1. Definitions and causes of stable and unstable atmospheric air 2. Processes that cause instability and cloud development Stability & Movement A rock,
5. Satellite Systems. History of Satellite Communications
 5. Satellite Systems History and Orbits Routing, Localization, and Hand-over Systems 2005 Burkhard Stiller and Jochen Schiller FU Berlin M5 1 History of Satellite Communications 1945 Arthur C. Clarke about
Chapter 7 Stability and Cloud Development. Atmospheric Stability
 Chapter 7 Stability and Cloud Development Atmospheric Stability 1 Cloud Development - stable environment Stable air (parcel) - vertical motion is inhibited if clouds form, they will be shallow, layered
WEATHER THEORY Temperature, Pressure And Moisture
 WEATHER THEORY Temperature, Pressure And Moisture Air Masses And Fronts Weather Theory- Page 77 Every physical process of weather is a result of a heat exchange. The standard sea level temperature is 59
Electromagnetic Radiation (EMR) and Remote Sensing
 and Remote Sensing") Electromagnetic Radiation (EMR) and Remote Sensing 1 Atmosphere Anything missing in between? Electromagnetic Radiation (EMR) is radiated by atomic particles at the source (the Sun), propagates through
Electromagnetic Radiation (EMR) and Remote Sensing 1 Atmosphere Anything missing in between? Electromagnetic Radiation (EMR) is radiated by atomic particles at the source (the Sun), propagates through
FORENSIC WEATHER CONSULTANTS, LLC
 NOTE: MOST TIMES, LOCATIONS & DATA HAVE BEEN CHANGED FOR THIS SAMPLE REPORT FORENSIC WEATHER CONSULTANTS, LLC Howard Altschule Forensic Meteorologist 1971 Western Avenue, #200 Albany, New York 12203 (518)
Make a Cloud Finder. How to Fold the Cloud Finder: Play the Weather Word Game:
 Make a Cloud Finder Make a Cloud Finder. The pattern is included here. Learn the names of the beautiful clouds that may appear in the sky where you live. Color your Cloud Finder, and cut it out on the
Estimating Firn Emissivity, from 1994 to1998, at the Ski Hi Automatic Weather Station on the West Antarctic Ice Sheet Using Passive Microwave Data
 Estimating Firn Emissivity, from 1994 to1998, at the Ski Hi Automatic Weather Station on the West Antarctic Ice Sheet Using Passive Microwave Data Mentor: Dr. Malcolm LeCompte Elizabeth City State University
History of satellites, and implications for hurricanes monitoring and forecasting
 History of satellites, and implications for hurricanes monitoring and forecasting Pat Fitzpatrick Mississippi State University With assistance from Lisa Fitzpatrick 1 Precursor to U.S. Weather Satellite
RE: James vs. ABC Company Greentown, NJ D/A: February 20, 2011
 PO Box 7100 Hackettstown, NJ 07840 Phone: 1 800 427 3456 Fax: 908-850-8664 http://www.weatherworksinc.com June 16, 2012 Attn: John Doe Law Offices of John Doe 123 Fourth Street Smithtown, NJ 04506 RE:
Read and study the following information. After reading complete the review questions. Clouds
 Name: Pd: Read and study the following information. After reading complete the review questions. Clouds What are clouds? A cloud is a large collection of very tiny droplets of water or ice crystals. The
Improved Warnings for Natural Hazards: A Prototype System for Southern California
 Improved Warnings for Natural Hazards: A Prototype System for Southern California Yehuda Bock Research Geodesist Scripps Institution of Oceanography University of California San Diego, La Jolla, Calif.
Ensuring the Preparedness of Users: NOAA Satellites GOES R, JPSS Laura K. Furgione
 Ensuring the Preparedness of Users: NOAA Satellites GOES R, JPSS Laura K. Furgione U.S. Permanent Representative with the WMO Deputy Director, NOAA s s National Weather Service WMO Executive Council 65
THIRD GRADE WEATHER 1 WEEK LESSON PLANS AND ACTIVITIES
 THIRD GRADE WEATHER 1 WEEK LESSON PLANS AND ACTIVITIES WATER CYCLE OVERVIEW OF THIRD GRADE WATER WEEK 1. PRE: Comparing the different components of the water cycle. LAB: Contrasting water with hydrogen
Frequency distribution by mont
 Windshear and Turbulence Alerting Services Hong Kong Observatory December 2010 Frequency distribution by Significant windshear: 1 in 500 flights Significant turbulence: month 2nd peak 1 in 2000 flights
Wind shear - poses challenges and dangers at the most critical stages of flight
 Wind shear - poses challenges and dangers at the most critical stages of flight Authored and illustrated by Sari Jay June 2009 Introduction Over 40 years ago, in the 1960s, low level wind shear was just
Mobile Communications Chapter 5: Satellite Systems
 Mobile Communications Chapter 5: Satellite Systems History Basics Localization Handover Routing Systems History of satellite communication 1945 Arthur C. Clarke publishes an essay about Extra Terrestrial
physics 1/12/2016 Chapter 20 Lecture Chapter 20 Traveling Waves
 Chapter 20 Lecture physics FOR SCIENTISTS AND ENGINEERS a strategic approach THIRD EDITION randall d. knight Chapter 20 Traveling Waves Chapter Goal: To learn the basic properties of traveling waves. Slide
Overview. What is EMR? Electromagnetic Radiation (EMR) LA502 Special Studies Remote Sensing
 LA502 Special Studies Remote Sensing") LA502 Special Studies Remote Sensing Electromagnetic Radiation (EMR) Dr. Ragab Khalil Department of Landscape Architecture Faculty of Environmental Design King AbdulAziz University Room 103 Overview What
LA502 Special Studies Remote Sensing Electromagnetic Radiation (EMR) Dr. Ragab Khalil Department of Landscape Architecture Faculty of Environmental Design King AbdulAziz University Room 103 Overview What
Clouds/WX Codes. B.1 Introduction
 Clouds/WX Codes B.1 Introduction This appendix provides the necessary tables and specific instructions to enter Clouds/Wx at the Surface Data screen. This guidance assumes no previous knowledge of synoptic
ABSTRACT INTRODUCTION
 Observing Fog And Low Cloud With A Combination Of 78GHz Cloud Radar And Laser Met Office: Darren Lyth 1, John Nash. Rutherford Appleton Laboratory: M.Oldfield ABSTRACT Results from two demonstration tests
1. Introduction. FER-Zagreb, Satellite communication systems 2011/12
 1. Introduction Topics History Characteristics of satellite communications Frequencies Application 1 History Arthur C. Clark suggested in 1945. Earth coverage with 3 geostationary satellites. On 4th of
Air Coverage Test with SCANTER 4002 at Horns Rev Wind Farm I and II
 Air Coverage Test with SCANTER 4002 at Horns Rev Wind Farm I and II Abstract The challenges of aircraft detection in the area of wind farms are addressed. Detection and tracking capabilities of the SCANTER